Tag: Splunk

  • Splunk Adds Data Management Tools to Observability Platform

    Splunk Adds Data Management Tools to Observability Platform

    At its .conf22 event, Splunk today announced it is making it easier to both onboard data and then manage it across hybrid IT environments via the Splunk Cloud Platform.

    In addition, Splunk Enterprise is being extended to add support for Microsoft Azure with SmartStore for Azure to store cold data alongside existing support for Amazon Web Services (AWS) and Google Cloud Platform (GCP). There is also a developer edition of Splunk Cloud that enables developers to create and test their own applications, which is currently in preview.

    Garth Fort, senior vice president and chief product officer for Splunk, said the overall goal is to make it easier to automatically tune the parameters used to store data in the Splunk observability platform. As more organizations embrace observability as a DevOps best practice, many of them are encountering challenges managing the large volumes of data they are now collecting in the form of logs, metrics and traces.

    The Data Manager for Splunk Cloud Platform will initially be made available on AWS and Azure, with support for GCP to come later this summer. In effect, it provides IT teams with a control plane for data management that spans multiple clouds.

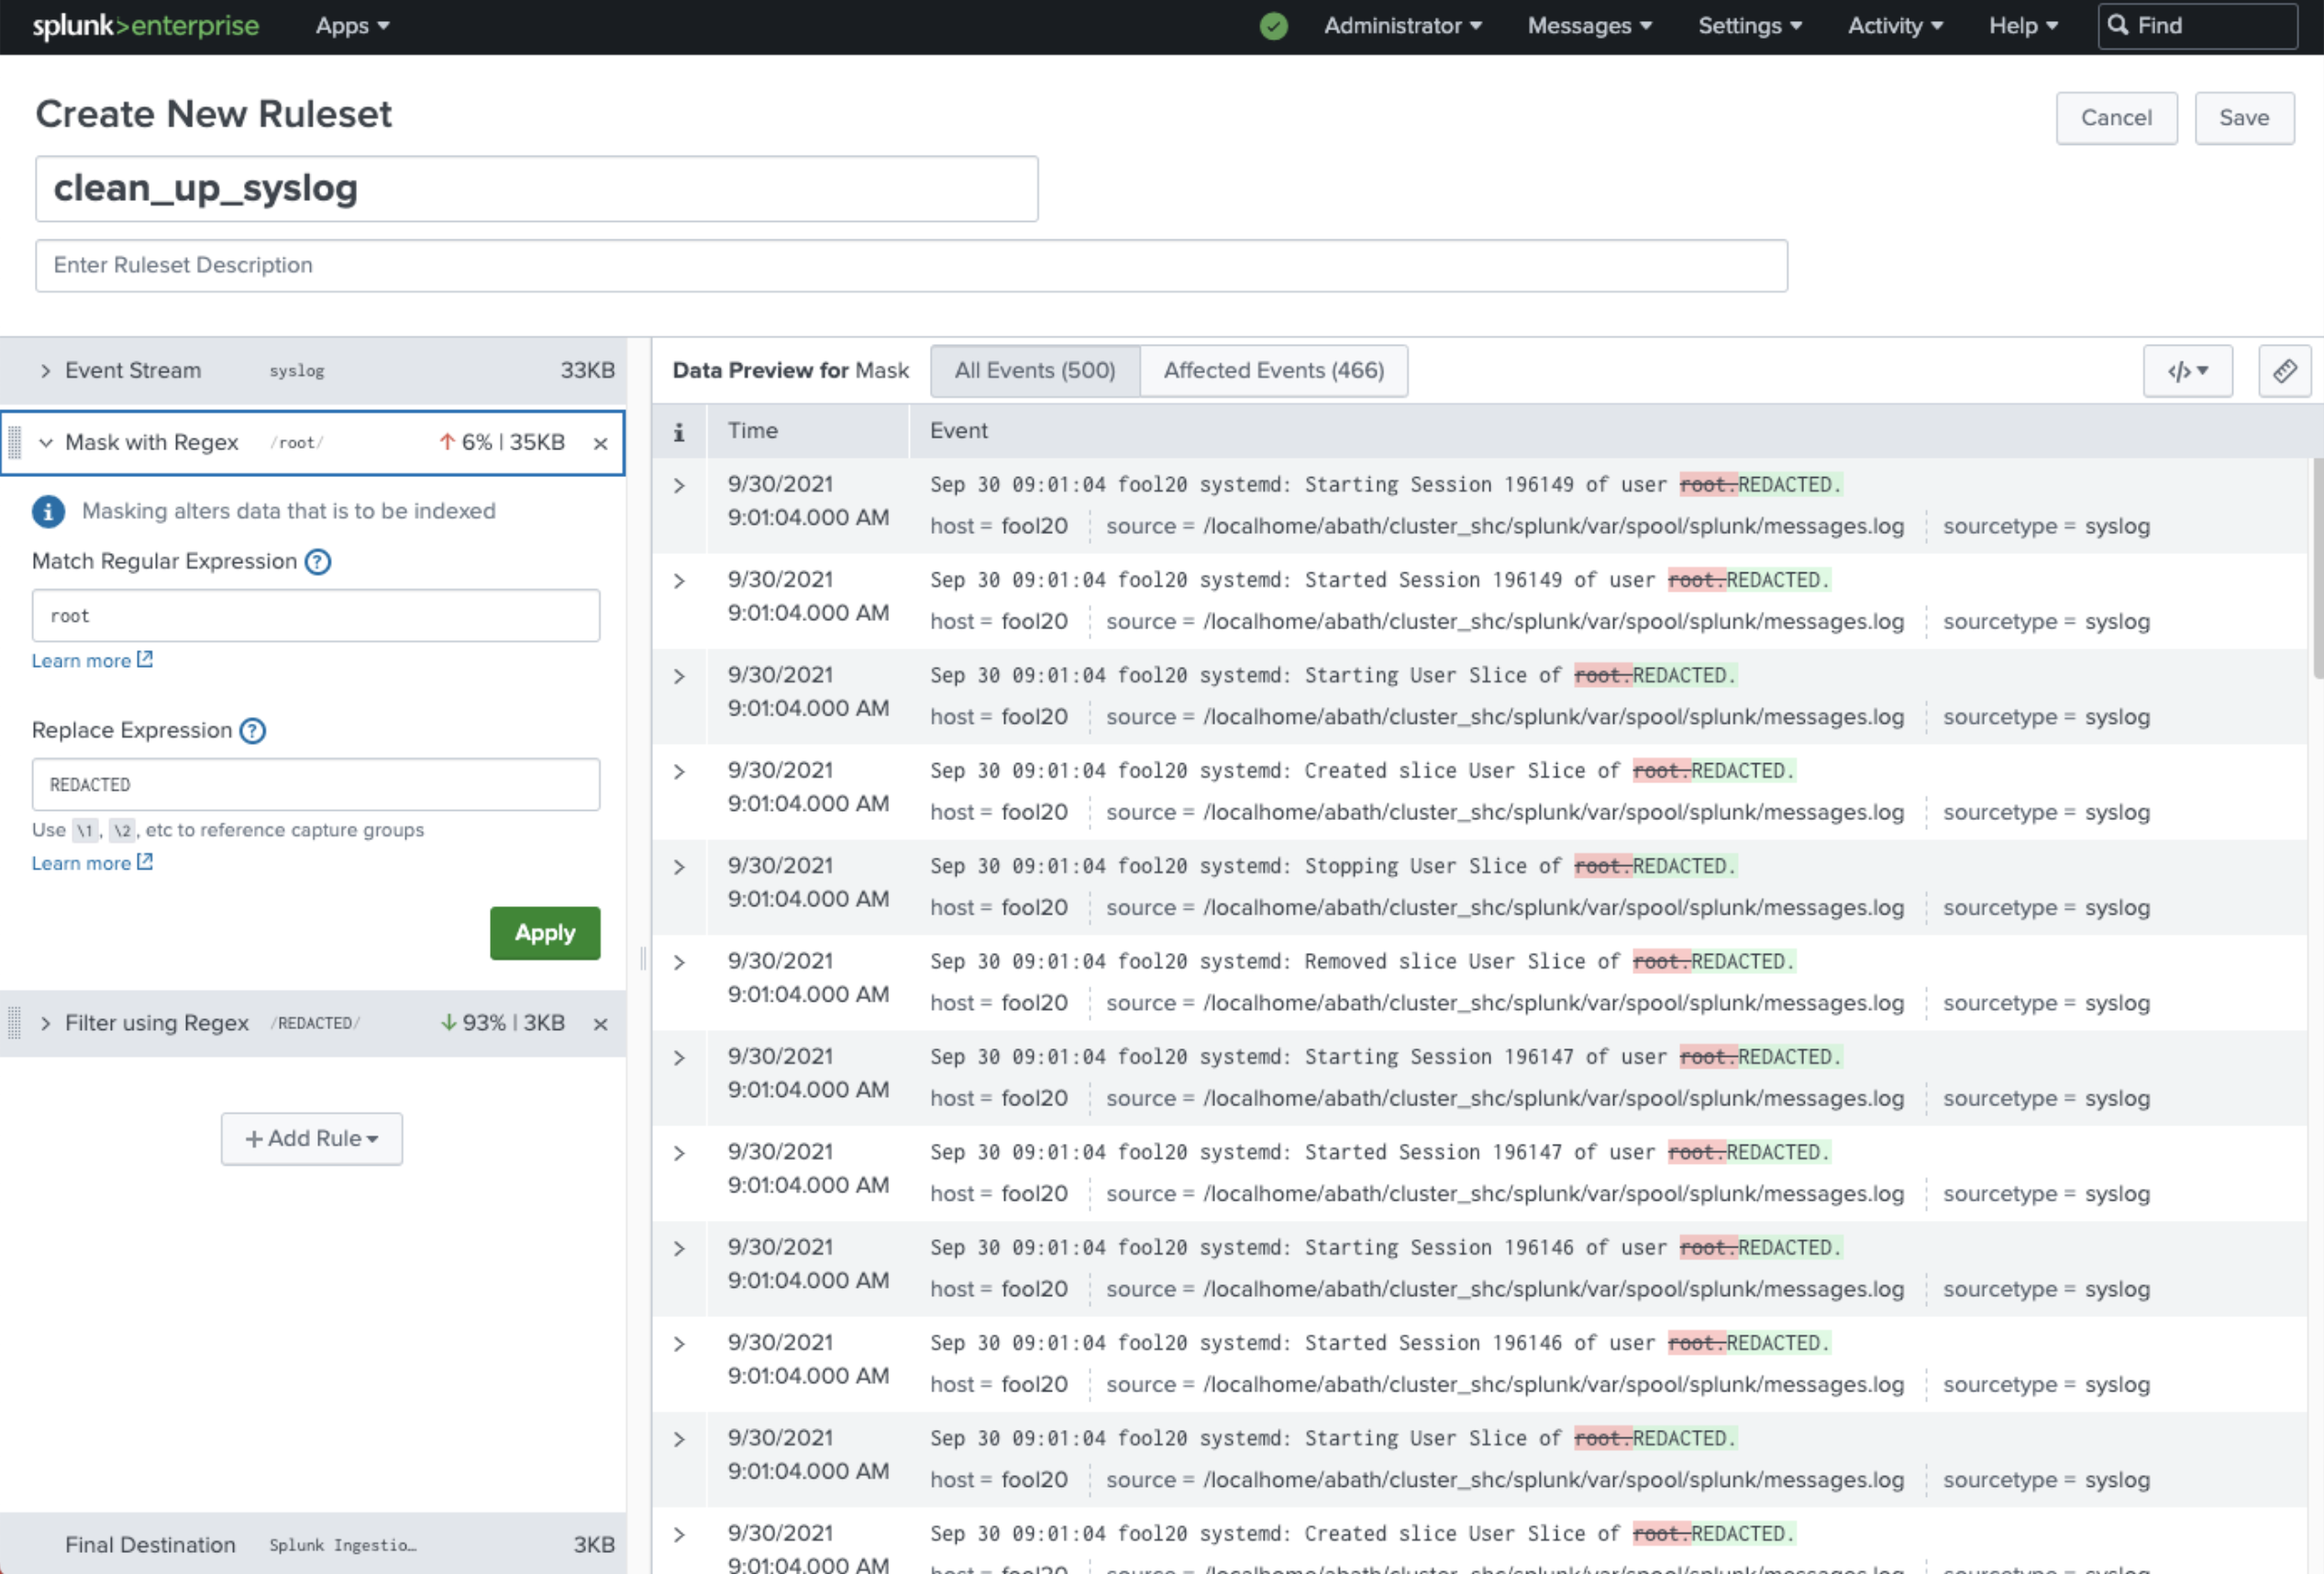
    Ingest Actions, meanwhile, makes it possible to apply granular controls that enable IT teams to filter, mask and route data in motion within the Splunk Platform or to external AWS S3 cloud storage services.

    Other capabilities Splunk unveiled at the conference include an expansion of Federated Search tools to enable a single pane of view across their entire Splunk ecosystem and a fully managed Splunk Assist service for Splunk Enterprise 9.0 that provides customers with deep insights into their security environment.

    Finally, the company has enhanced Splunkbase, a framework for accessing curated collections of more than 2,500 applications and integrations provided by Splunk and its third-party partners.

    As the pioneer of IT operations analytics, Splunk has a large footprint within enterprise IT environments. It is now looking to expand that base to become an observability platform provider. It’s still early days as far as the transition to observability is concerned, but the goal is to make it simpler for IT teams to query platforms and surface issues that could lead to an IT disruption before it happens.

    It’s not clear how many organizations have the skills and expertise required to formulate those queries, but over time it should become more feasible to augment an IT staff with machine learning algorithms capable of discovering those issues.

    In the meantime, IT organizations are collecting more data than ever about their IT environments. In theory, that data will provide the context needed to optimize application environments that get more complex with each passing day. The challenge, of course, then becomes finding a way to efficiently store and manage all that data both before and after it has been analyzed.

    Regardless of the approach to observability, the need to go beyond simple monitoring of IT environments has never been more apparent.

  • Splunk Survey Surfaces Gains in Observability

    Splunk Survey Surfaces Gains in Observability

    A global survey of 1,250 observability practitioners, managers and other experts published today by Splunk found that sophisticated observability practitioners are able to cut downtime costs by 90%. That figure is based on an estimated cost of $23.8 million annually for comparative newcomers to $2.5 million. However, only 9% of respondents are advanced enough to be considered observability leaders compared to 59% that are still beginners.

    Those leaders reported they are seeing a 69% better mean-time-to-resolution (MTTR) for unplanned downtime or performance degradation thanks to investment in observability. The survey also noted those same organizations launched 60% more products or revenue streams from application development initiatives in the last year.

    Observability has always been a core DevOps tenet, but achieving and maintaining is a challenge. Most DevOps teams today aspire to be able to maintain some level of continuous monitoring. However, as it becomes easier and less costly to instrument applications, interest is rising in observability platforms that make it simpler to launch queries and investigate anomalies.

    Spiros Xanthos, senior vice president and general manager for observability at Splunk, said observability platforms are clearly driving down the cost of downtime. There is also a clear correlation between organizations that have embraced observability and the number of microservices-based cloud-native applications that have been deployed, he noted. In effect, increased complexity is driving organizations to turn to observability platforms to manage IT environments in the age of the cloud, said Xanthos.

    The survey found 75% of respondents have multiple cloud-native applications that run in multiple environments. Just over one-third (34%) of internally developed applications are based on microservices constructed using containers, with 28% of respondents reporting they exclusively run cloud-native applications on public cloud infrastructure.

    Overall, the survey also found that two-thirds of leaders reported their visibility into application performance is excellent compared to 44% of beginners, while 64% of leaders reported that visibility into their security posture is excellent compared to 42% for beginners.

    The survey also found 59% of leaders can push code to production on demand for most internally developed applications compared to 28% of beginners. A total of 41% of leaders said they can detect problems associated with internally developed applications within minutes compared to 20% for beginners.

    It’s still early days as far as adoption of observability platforms is concerned but, theoretically, IT should become easier to manage even as the number of platforms employed continues to expand. Advances in analytics and artificial intelligence (AI) are improving the signal-to-noise ratio so that not only are more issues being surfaced sooner but that more trusted recommendations are being made, said Xanthos.

    Observability is, of course, a journey. Most organizations are not even quite sure what type of questions they should formulate to get the most value from investment in an observability platform. Organizations should start small, with a finite project to gain an understanding of how to leverage observability more broadly as they gain more maturity, said Xanthos.

    Regardless of the approach to observability, the one thing that is certain is that traditional IT monitoring is no longer sufficient in an era where IT environments get more complex by the day.

  • Will Splunk be Gobbled up by Cisco?

    Will Splunk be Gobbled up by Cisco?

    Word on the street is that Cisco and Splunk are in discussions about a possible acquisition. Splunk, the technology monitoring, search and analytics company could be acquired by Cisco—originally a networking company but now a complex hardware and software conglomerate.

    Splunk has generated quite a reputation as a ‘dealer’ over the years. The company, much like a drug dealer, gets you hooked and then, when you can’t live without what they’re selling, makes you pay. The difference is that what they’re selling is insight and visibility into your own data.

    For many years, Splunk’s pricing model was simple—customers paid for the amount of data that was ingested. Splunk didn’t invent this type of pay-for-what-you-use-and-consume model. For mainframe workloads, IBM has long charged clients based on millions of instructions per second, or MIPS. Likewise, the entire cloud computing business model is based on a pay-for-what-you-use model. If, for example, you leave an AWS experimental instance running over the weekend or while you’re a vacation, you’re going to pay for it (many of us have learned that the hard way).

    So why am I picking on Splunk for being a dealer? The whole value proposition of Splunk is that the more data it ingests, the more useful the software platform can be. Splunk can help operations and security teams connect disparate data points to uncover potential emerging problems or greatly reduce the time it takes to resolve an incident. However, to unlock the power, you need to push more and more (and more and more) data into Splunk.

    But here is where Splunk gets down and dirty: Like any dealer, Splunk will give teams free trials and the ability to ingest data from new areas of your business for free. Once a team starts to see the value and is hooked on the software, the Splunk sales team is right there to take your money.

    Splunk now offers other pricing models, but the stigma sticks.

    Splunk Customers are the Company’s Best Salespeople

    Splunk has done an excellent job at creating evangelists out of their existing client base. I’ve attended a lot of vendor conferences, and my experience is that Splunk’s customers are some of the most enthusiastic I’ve ever encountered. What does user enthusiasm tell me about a vendor’s product? It is either that the product is making that employee a superstar within their company or making that employee highly desirable across the broader technology market.

    At Splunk events when I have candid conversations with customers, the adoption pattern follows a fairly standardized script. The IT operations team adopted Splunk. IT operations had a ton of success and shared that with the rest of IT. Security saw ops’ success and wanted to try Splunk out for themselves. In many cases, the cybersecurity use case within the company became the bigger Splunk deployment once the platform’s capabilities were understood.

    So Why Would Splunk Sell?

    Customers like Splunk and they’re obviously seeing value. So, why would a company like that ever sell? Well, first of all, the SIEM 2.0 market vanished; security log data analysis is table stakes. What do I mean by that?

    So Long, SIEM

    The idea of security information and event management (SIEM) hasn’t gone anywhere, but now security vendors need to do more than just SIEM.

    It wasn’t long ago that those of use following the security industry tracked RSA Netwitness, Logrhythm, IBM Qradar, HPE ArcSight, RSA Archer, Carbon Black and other SIEM vendors. The reality is that all of these companies have gone through massive transformations. Those of you reading this article might be surprised by the companies that now own many of these SIEM vendors!

    Splunk is no longer unique in its approach to applying machine learning and artificial intelligence to security log data.

    AIOps—The Company Lost its Focus

    Splunk cut its teeth with operations teams. The company helped ops teams quickly find the root cause of disruptions and spot problems before the pain was felt by customers. However, operations isn’t sexy. Rather than doubling and tripling down on operations, the company expanded to security. It made sense; security organizations deal with huge amounts of complex data.

    However, as DevOps rose to prominence, Splunk has been widely left out of the conversation. DevOps teams need software tools that can normalize data across job function-specific software platforms. This would have been a perfect opportunity for Splunk—however, new competition stepped in to fill this gap.

    The World Evolved—Businesses Need Observability

    SIEM 2.0 was hot—“was” being the operative word. Today, DevOps and DevSecOps teams are looking for observability offerings. Observability tools provide teams with the ability to understand and see what is going on within systems and software from a variety of perspectives. Observability platforms can view system and cloud health and resiliency, but can also give operations teams container-level data.

    Enter the Observability Vendors

    By no means is this a comprehensive list, but my colleagues at Techstrong Research and I have come up with a list of observability vendors you should be paying attention to. Some of these vendors are pure-play observability companies while others, like Splunk, have a variety of offerings.

    •   Splunk
    •   Sumo Logic
    •   Logz.io
    •   StackState
    •   Lightstep (acquired by ServiceNow)
    •   Dynatrace
    •   App Dynamics
    •   VMware – Tanzu
    •   AWS CloudWatch
    •   Azure 
    •   Honeycomb.io
    •   Grafana Labs

    Acquisitions

    •   IBM acquired Instana for observability and Turbonomics for AIOps
    •   Cisco acquired Epsagon
    •   Cisco acquired AppDynamic for $3.7B for application performance management/monitoring
    •   VMware acquired Mesh7
    •   GitLab acquired observability distribution Opstrace 
    •   NewRelic acquired CodeStream
    •   Splunk acquired SignalFX, FlowMill and Omnition
    •   ServiceNow acquired Lightstep

    Within the observability space, there is also a tremendous amount of open source. Many vendors are coalescing around the OpenTelemetry project, for instance, that focuses on collecting data. This type of open source use makes sense—vendors should focus on areas of differentiation and customer value rather than just data collection.

    Open Source related projects

    • Prometheus
    • OpenTracing and OpenCensus from Google (folded into OpenTelemetry)
    • Zipkin (Twitter) one of the first open source tracing projects

    Why Would Cisco Want Splunk?

    Splunk’s stock has been in decline since its CEO left in Q4 of 2021. Like other technology companies, inflation and a general technology sell-off is further impacting its stock price. In addition, the company is transitioning clients to cloud-based offerings, which is often a painful process for public companies (many companies have gone private to eschew Wall Street’s prying eyes).

    Cisco has, historically, occupied the network layer. Splunk understands network data and can offer many benefits to Cisco clients.

     Splunk is an enterprise software vendor that can scale in a non-linear way if Cisco can add stability to Splunk’s leadership and vision.

    Now, will the deal for Splunk get done at $20 billion? No. But a possible acquisition is very possible, especially given the fact that Splunk’s runway is short and getting shorter.

  • Open Source is the Engine for Observability at Scale – Observability at Scale TV EP 2

    Open Source is the Engine for Observability at Scale – Observability at Scale TV EP 2

    As today’s organizations seek advanced monitoring and observability to ensure the performance of their microservices and cloud native systems, issues of cost, complexity and tool sprawl have emerged as pervasive challenges. Join our hosts Alan Shimel and Mitch Ashley along with panelists Dotan Horovits (Logz) and Constance Caramanolis (Splunk) as they dive into the challenges that DevOps practitioners are frequently forced to compromise on and how they transform modern observability. The video and a transcript of the conversation are below. 

    Alan Shimel: Hey everyone, welcome to Observability At Scale, one of the latest video series or video show series, over here on TechStrong TV part of TechStrong Group. I’m your host, Alan Shimel. And let me just say that Observability At Scale is sponsored by our good friends at Logz.io, it’s L-O-G-Z and many thanks to them for sponsoring this. This is a great subject.  

    I recently in KubeCon about two weeks ago. And I will tell you, it was pretty much all Observability all the time. I did 40 interviews there in two days. And I wouldn’t be surprised if somewhere between a third and 40% of the people I interviewed were about Observability. And many of those being at KubeCon CNCF Cloud Native Con, many of them were about open-source Observability. 

    Whether we’re talking about Prometheus or OpenTelemetry or several of the other Observability-related open-source projects out there. That seems to be the subject of today’s episode: Observability and open source. And I think we’ve got a great panel to discuss this. Let me introduce you to them. First of all, we have Dotan Horovits. Dotan is with Logz. Actually Dotan, you introduce yourself. I don’t want to put words in your mouth. Go ahead.

    Dotan Horovits: Gladly. Glad to be here, Alan. And my name is Dotan Horovits, and I’m a developer advocate at Logz.io. Logz is a cloud-native platform for observability. And the nice thing that I love about Logz.io is that it’s all based on popular open-source tools that we’re going to talk about extensively today like the ELK Stack and Prometheus and OpenTelemetry and Jaeger and so on. So that’s about Logz and myself.

    Alan Shimel: Thank you, Dotan. Next up, we have Constance Caramanolis, and I hope I did that justice. Hey, Constance, how are you? Maybe a little bit about yourself for our audience?

    Constance C.: Good morning. I’m good. Hi, everyone. I’m Constance. I’m a principal software engineer at Splunk. Right now I’m on OpenTelemetry Governance Committee for I guess another five days until elections are over. But I’ve been involved in open source for about four or five years now, both on Envoy OpenTelemetry and on the product with Con community.

    Alan Shimel: Excellent. Thank you, Constance, for coming on today. We appreciate you having you here. And then last but not least, is my co-host of Observability At Scale. He’s also CTO here at TechStrong Group and a principal analyst at TechStrong Research. It’s Mitchell Ashley. Hey, Mitchell, how are you?

    Mitchell Ashley: Good, good, good. Great to be here and very thankful to Dotan and Constance for joining us. I look forward to a great conversation.

    Alan Shimel: Yep. Thank you. So guys, as I started the show off I was out in Los Angeles, I guess it was two weeks ago now for KubeCon Cloud Native Con. And first of all Linux Foundation did an amazing job creating as safe an environment as possible for us to do an in-person event. And it was great to be in-person they got. I don’t want to belabor it but this stuff is good on Zoom, it is better in-person. 

    One day maybe we’ll run this as a live panel from a KubeCon, and that would be just great. But it was all Observability all the time, it seemed. Several things with Observability. Number one, the hairs on the back of my neck stand up when I go to a major show. And there’s something that’s so hot, so hot, that I just feel I can never live up to its promise. And that is what I was afraid with you all. 

    Are we in a overhype cycle around Observability. And then secondly, so much of Observability is based on open-source underpinnings, if you will. Right. There’s a lot of great open-source programs. Maybe that’ll save us from the usual hype cycle that we get here, I don’t know. Anyway, I’m interested in your comments on that, is Observability being overhyped at this point?

    Dotan Horovits: If I may take the first pass on this one. I think that as many trends, and we’ve seen the quite a few of those thought out the years, you have so many vendors trying to piggyback on the trend and leverage that for the relevant offerings that it creates a bit of a blur and confusion about what exactly Observability is about.

    Is it about tooling or methodologies? Is login in its own right for vendors that just provide, let’s say, login of vendors just provide metrics is that Observability? And can you rebrand for Observability yes or no? You have two of these, is that enough? Is signals the whole story about Observability at all? Or is the discussion about Logz metrics traces do justice to Observability?

    I think these are the sorts of conflict and confusion that I see and sense in my conversations with the user community, with customers of ours, with partners of ours. And, again, lucky enough in my position as an evangelist, I use my time to try and clarify and try to separate between the tooling and the methodologies and the essence of things. But definitely, a lot of confusion around that.

    Alan Shimel: A lot of confusion. I did an interview or a panel discussion yesterday with some folks. And one of the things, there was a good line that came out of there was actually around the definition of DevOps, but it’s equally, I think, applicable here, which is, what is Observability? And all of these kinds of things you mentioned, Dotan is, where is the value? 

    Show me where the value is in and I’ll show you what it is, who’s using it, who’s doing it, who’s not. Where is the value? Constance, one might say you were into Observability before it was cool, before it was hyped.

    Constance C.: True. Yeah, right, because that was one of the selling points of Envoy, was making things transparent to the networking to everyone around. And one of the features that made people really love the project was that we would joke, there’s a staff for that. You would send a request, there would be staff for the connection, and everything related to it, and so that made things really easy to debug as a consumer of it. 

    Dotan, you’re definitely right in terms of so much confusion because observably can almost be like the block-chain. And no offense of block-chain, but that’s like the key word that gets thrown around in terms of getting really hip and cool. I think the nice thing about this attention is that it is forcing a lot of people to start thinking more about why they’re doing things.

    There’s a lot of just doing things because you’re either told to or your thought about and now sort of be like, hey, if you’re going to do something, we’ve always asked how do we know at work, but it’s like, oh, let me just write a test. Now it’s a little bit more like how do I systematically know it works by either adding instrumentation so I can consistently monitor it or observe it. 

    I think that is a really good thing that we need to start moving towards, because it’s a little bit more of a, we still check something in, throw it over our shoulders and be like, whoa, good day, everyone. And we’re starting to think a little bit more that sustainability. 

    And I also think there’s a second part too, especially when it comes to these projects that were mentioned earlier, we’re not just thinking about tools anymore, we’re sort of seeing them as products and starting to actually say why this could matter to you, why you should actually adopt them. 

    And that’s something that as engineers, it’s not in our normal toolset in how we think about things, we’re starting to get better at, because we need to start. We’re also selling things for open source, the currencies, commits and contributions and not necessarily money.

    Alan Shimel: I think that’s super important. To the question, is it overhyped? Will it be overhyped? Yes, yes. And whatever the next question is, yes. But I think what Observability has going forward is two big things. One is it started from open sources, it started from a community. Second was trying to solve a real problem around as we move to micro-services’ architecture containers.

    How do you manage this stuff? How do you understand what’s happening? I remember Constance, you’re on a podcast we did together, we were talking about how do you know what happened where, what’s doing what, and what do these things do, to use generic terms, but what is it? So we’ve created this flexible, malleable component containerized architecture. 

    Now how do we understand it? We operate it and improve it over time. I guess the other thing we were talking to, you said software engineers, developers, operations people, they’re not into marketing hype. They’re pretty real folks. They want to know, are you solving a real problem for me or is it a checkbox and you’re calling it monitoring observability?

    So we have a pretty healthy skepticism in the market too that will fair it out, I think in most cases, what’s real, what’s not. Where the value is, to your point, Dotan. Okay, go on.

    Dotan Horovits: If I may just add on that, one of the benefits of the open source tools that we’ll talk about and standards, by the way, it’s not just tools, it’s also standards, such as OpenMetrics and others, is that it’s usually driven by real needs of real companies. Actually, today, I had an episode with a gentleman, senior SRE, site reliability engineer, from Google in charge of the entire identity services package of Google. 

    So when you log into your Google account, it goes through their micro-services. And many of the tooling that they use, and they’ve been using for a couple of decades, is the predecessor of what we currently talk about at the CNCF and many others. So obviously, Kubernetes itself, the containerization is a successor of Borg, their internal containerization orchestration system. 

    And then you have Google sensors that evolved into open sensors that now is emerged into OpenTelemetry together with OpenTracing. And you have the Dapper project that very, very fascinating research paper about distributed tracing that was, I guess, the forefather of Zipkin open source and the Jaeger open source and many others in the industry. 

    The nice thing is that Google’s scale is such that where we are at today was where they used to be a couple of decades ago. So in a way, these are well rooted within realistic problems at scale in micro-service architecture, in containerized environment, cloud native environments and technology. 

    So I feel much more confident basing Observability standards, tools and practices on the open source rather than on some vendor initiatives that again, might be inspired by some strategy and might have some forecasting behind it. But much less solid ground around Observability practices hands on.

    Constance C.: Two things I want to add to that, one is like, I think, I guess this is one of the things I want to keep on advocating for, is that I think we should get more just for nitpicking by cognitive doesn’t actually mean containerization. I think it’s just —

    Alan Shimel: And it doesn’t mean Kubernetes necessarily either.

    Constance C.: Exactly. Yeah, that was actually one of the points I was trying to make is cognitive is like any of the things there. But it’s more just I want us to dump that because a lot of people when they think about, oh, let me modernize my stack, I’m going to go straight to containerization. But that might not be the problem that they actually dissolve. 

    And so that’s just one thing I want everyone to be aware of when people are talking about cloud native is like, what is the problem I need to solve when you’re upgrading your stack, remodeling your house, thinking about that problem there? And I guess, I don’t know, Alan, if you want to talk to us now, but the vendor influence. The vendor influence is really interesting.

    Alan Shimel: I was going to bring that up. Let me jump into that. So let me just also lead off with this stuff. Look, Gartner has been doing a hype cycle for as long as I’ve been in technology, 25, 30 years. And the hype cycle is real. That is the way our industry works. Things get really, really overly high, they do the trial, disillusionment, and then they become productive, or whatever that end stage is. 

    What’s a little different about Observability is it’s in this new foundational era of open source, where you have, as I said, several really good open source projects that are driving so much of the Observability innovation out there. None of those projects are controlled by a single vendor. 

    They’re owned and managed by Linux Foundation and maybe some other foundations, which creates this whole golden era of coopetition, to your point Constance, among all the vendors. And this is a very interesting thing. So everybody starts with that same base. When Mitchell and I were doing vulnerability scanners 20 years ago, you could use the open source that was Nessus.

    Nessus was still open source then. You could use the Nessus scanning engine but there were proprietary scanning engines that people were using, some of them really based on Nessus some not. Not the case here. Here, you got a company like Logz, and Dotan, I don’t mean this in a bad way. But you got a company like Logz, for instance, almost their entire value prop is built upon open source. 

    Built upon that open source. I spoke to the Splunk people, their observability stuff, built upon open source. I’m just made mentioning that because we’ve got the two of you here, but there’s a lot of observability vendors out there. And they’re all built upon the same open source foundational tools. 

    I don’t know if we’ve had this kind of coopetition in a market like this in years past and in times past where, look, everybody starts at that same level and what you do with it. Who makes the best observability solution? I don’t know, I guess it depends on really what your needs are. 

    But it’ll be very interesting to see how in the real world laboratory of market conditions, people all come from the same open-source base, and what the value add is on top of that.

    Dotan Horovits: I would challenge two points there. First of all, we started the discussion from the CNCF and from the Linux Foundation, and we can add on top of that, the Apache foundation and others. But let’s bear in mind that many popular tools out there still are controlled by vendors. We can talk about the ELK Stack, ElasticSearch —.

    We can talk about the Grafana that is highly popular, and it’s controlled by Grafana Lab that actually rebranded itself to Grafana to be synonymous with the open source. So there is another beast out there, open sources that are very popular and very well adopted and very mature, but then again, not controlled by a foundation and this various implications. 

    I guess the most prominent implications are when these open sources are then being relicensed to some degree. So users one day wake up to find that the open source on which they built the entire system around is suddenly being pulled of the open source [crosstalk].

    Alan Shimel: One day we woke up and Nusses was an open source anymore, it wasn’t like that. But that’s exactly the point that I was making with foundational open source and why CNCF and these kinds of foundations —, Apache, whatever, it’s so great. And I’m not picking on Grafana, I happen to like Grafana, I like Loki as well, which is another Grafana project. 

    But the very fact is, if you have one company that’s controlling an open-source project, other companies are very often hesitant to contribute. They may use it for now, but they’re hesitant to contribute. And so in the long run, and I’ve been in open source, Mitchell will tell you, we’ve been in open source 25 plus years. 

    Over the long run the foundational model where you can have coopetition among various vendors prove superior to what I call the big brother open-source model where you have one vendor who owns that, and can pull it at any time or calls the shot. If I’m a VC-funded company, a unicorn or a public entity, and I’m investing 10s of millions, hundreds of millions of dollars, I want to be very careful that I am not dependent on an open-source project that is controlled by a single company. 

    This may be getting off observability and I’m sorry for getting on my soapbox, but I think this goes to the reason why CNCF and that community is so vibrant. It’s so much vitality, why the projects coming out of there are so popular and really changing our game. I look at observability because companies feel like everyone gets dealt the same hand, what you do with it is up to you. 

    No one’s going to pull the rug out from under you. And Constance, you’re on these boards so I’m sure you probably feel that way, but I’m interested in what you all think?

    Constance C.: The vendor has such a dirty word in like CNCF like KubeCon, Cloud Native Con, and open source. Okay, I’m putting on my vendor hat. Well, I’m actually putting on both hats, the vendor hat and also the contributor hat. One thing that the vendors have is that there’s a little bit of superpower. 

    And maybe we don’t as vendors or as leverages, is that we actually get to see a broad spectrum of how things are used. And if we’re doing a good job in terms of like, hey, we’ve seen these things like 10 times over and over so that we think this is really important and bring this to the community that could really help the community. 

    I think sometimes the messaging gets lost, because we’re just like, hey, we need this thing here and not explaining why about there. I think that’s sometimes why vendors get a bad name. It’s such a dirty word within open source, because you feel like, oh, you’re controlling how we want to use things, you’re going to make us buy these things there. 

    If you look at our stats, I can’t remember what the stats are on top of my head, a lot of our talks come from vendor companies because a lot of things we use, they’ve contributed so much time into it. I’m only saying this because I’m trying to make it less of a forbidden word. Because they do have valuable insights, and they do contribute a lot. 

    Then there’s also the end user part who has a lot of different use cases that vendors wouldn’t necessarily see. I also think for like some of the examples you mentioned, it might just be a matter of time before they move over to more CNCF. Because a lot of like, OpenTelemetry is still new, two-ish years. I guess, everything within CNCF are about six, seven years, so really, really new. 

    I think it’s just more like continuation of time, as CNCF is, as you can still see, it’s so new that it’s like iron itself out. It’s starting to be, you could say, the de facto place where a lot of people look to, to donate their projects and be a part of that community. 

    KubeCon and Con keeps getting crazy, crazy numbers of attendees and participation, it’s going to become more and more projects start coming to it, because there’s more of that trust, and it’s a little bit more of a matter of time. I like your, what was it?

    Alan Shimel: Coopetition.

    Constance C.: Coopetition. I’m starting to see it less and less. My scope is OpenTelemetry, I will say I wanted OpenTelemetry be like, we’re all vendors, you’re little skeptical. And as I’m leaving the GC now is like, oh my goodness, just seeing so many different people’s, so many different companies’ perspectives on what customers are targeting, what problem we’re trying to solve.

    And start to view these people at first, I’m like, who are you? It’ll now be like, setting up one on one fairly regularly. Talk about careers and life. We go to open source to collaborate with others who are working on projects that are similar to us or probably they’re similar to us. And this was like another avenue to see the more people and get to know them.

    Dotan Horovits: It’s important to say I work for a vendor — that also contribute to OpenTelemetry and to Jaeger and to others. So definitely I agree with you entirely that the know-how within these companies and the broad perspective of different use cases across different verticals, industries, geographies, gives a very valuable perspective.

    It just requires the right mindset of the vendor, because even if you look at the evolution, specifically around observability, players such as Datadog, New Relic and even Splunk started off with a proprietary agent that did very intelligent things. 

    I agree entirely that the ability with a proprietary agent to fetch the right telemetry, to enrich it with the right metadata to do the right aggregations, to fine tune it to the backend tool, storage and analytics and visualization, that’s perfect. But then again, it is very vendor locked. You can’t correlate across different vendors across different signals, assuming that not the same vendor serves all signals. 

    And that’s what the driver that brought us to OpenTelemetry. And gladly is to say, and by the way, today OpenTelemetry is the second most active project under the CNCF according to the DevStats, CNCF DevStat. It’s really amazing to see. That essentially brought the vendor to their realization that the locking through agents is no longer the future path. 

    And they’re aligning with OpenTelemetry and even contributing know how around the agents back to OpenTelemetry. And now the differentiating factor is within the collector, doing intelligent processing, aggregation and the power of visualization based on that. And that’s the right play, and that’s the play that evens the playing field because everyone gets the same raw telemetry and the raw signals. Now, it is up to you to draw the most value out of that and bring it to the end.

    Alan Shimel: That’s exactly what I was trying to say.

    Mitchell Ashley: With your point, yeah.

    Alan Shimel: That was exactly. I’ll take it one step further. It’s not just the CNCF. We do another video show on here with the open mainframe project of all thanks. Another Linux Foundation project. And it’s really an umbrella for 26 different open mainframe-related projects. It’s the same thing. You got Broadcom and IBM and Rocket and BMC, and many others all working together to be able to do like DevOps on mainframes, project Zoe and stuff.

    The CDF, Continuous Delivery Foundation, same thing. You got all the CD vendors in there.  Yes, there are the Grafanas there. Are the big brother open source players left there? This is the foundational era of all, and mean no offense, why like foundation. 

    But this is the foundational era of open source. You just said, Dotan, that’s it. That’s it. You can’t beat that. And that is why the Splunk and the New Relics and the rest of the world have come around to recognize that as well.

    Mitchell Ashley: Maybe [crosstalk] Alan. May be just kind of fanboy for a minute. What’s really awesome about this conversation is that we’re coming to it from multiple points. It isn’t just about let’s start an open source project, and that grows up into its evolution and becomes popular, etc. That’s one point of entry. There’s other points of entry, the proprietary. 

    We started here, now this has sprung up and we need to, maybe in some cases, companies are forced to. You have to, to be competitive, because something like OpenTelemetry has really become so foundational, to use that word, Alan, that that’s critical. You have to be part of that community, and maybe even have to contribute to be able to do that. I’m referring into a genuine vendor here. 

    And of course, tomorrow, someone else will start. And they’re going to start from where we are today. So what’s cool about this open source, it isn’t one thing, it isn’t one way of starting and one place of starting. You may be, like you were contributing to some early projects when you were at Lyft Constance. 

    Or you may be starting the next company, Dotan, that you’re going to build on OpenTelemetry and maybe one or some other projects, you’re going to join Jaeger, whatever, starts something new. But my point is, it’s not one thread through it, it is multiple threads. 

    But having an underlying activity that is bigger than any one of us, that we are contributing to, that it sort of advances the scrum as we move down the field, so we’re heading in a direction that sort of the rising tide lifts all boats kinds of things, yes, we’re all going to compete. And some people are going to only be interested in sort of their pure open source work. 

    And that’s what I’m going to do. And that’s how kind of a developer I’m going to be or what I’m going to contribute to. Others are going to say, how do I productize? How do I commercialize? How do I build something on top of that? Because I have some great ideas too, to develop it. And that’s what’s cool, how far open source is come from, when Alan and I tried to build some products on earlier open source stuff and to where we are today.

    Dotan Horovits: And that’s the beauty. The beauty is that, many talk about open source in the context of community in the greater good and everything, but then it’s important to say it is also a viable business model. It’s [crosstalk] one that you can build a viable business model, unlike some that claim that they cannot sustain it going forward. 

    And use that as an excuse maybe to take it off the open source or things like that. Actually, just look now, last week, or this week that chromosphere became a unicorn raising 200 million with a one point something billion dollar valuation. And that’s all based on M3DB or M3 that spun out of an internal Uber project, Uber engineering that developed its own time series database, scalable Prometheus, if you’d like, database in terms of time series storage.

    And now it’s a company in its own right with its own open source, in addition to a commercial offering. Now they’re expanding from metrics to also distributed tracing, as far as I understand. So it is happening. It is accelerating, actually, innovation, including business innovation, including new startups. It has sprung up around observability. 

    And it’s a very exciting thing to see that as the open source by polar signals that there is now around a continuous profiling in observability. You see that from all angles, and you see startup and innovation. And I think it’s fueled by and facilitated by the open source. And that’s something that they think is great.

    Alan Shimel: Absolutely. So here for me was the key sort of switch that switched, that enabled this. There was a time when we used to talk about the only open source business model that ever succeeded was Red Hat. That was a common thing you used to hear. And why? Because you look at some of the early open source commercial models, and they were about what we offer support and training. 

    And that was like, how do I monetize open source? You do support and trainings really. Well, that’s not a great model. That’s been proven, not a very lucrative model. Then we started doing some open core, premium modules. So I’m going to give you bare bones and if you want the good stuff, you pay me for it. And that was the model. 

    And look, there’s still companies doing that sort of model, it’s viable. Some people have problems with it, is it really open source? I think it is, but another story. But today, what we have is, Dotan, what you’re talking about. And I think, frankly, SAS has been the great enabler of this. Because now, I can take this open source project, set it up as a SAS app that’s going to do it for you. 

    You know what? People understand that these things cost money to develop, maintain, and deliver. And if I’m getting it as a SAS app like that, and I’m paying monthly or subscription, whatever your subscription is, that’s the way business is done. That’s the way software is done today, whether it’s observability, or anything else in this cloud native world. That has been the enabler.

    Yeah, it’s open source, but I’m getting it as a SAS app, this is what it cost, and I’m good with that. I don’t feel like I’m getting something that I should be getting for free. Ron Gula, who started Tenable Network skewed. I don’t know if you guys know Ron. But Ron always used to say, look, with open source that’s free as in freedom and free as in beer. 

    We’ve concentrated on the free isn’t freedom with observability. It’s not necessarily free as in beer. And I think that’s a key mind view that we need that’s enabled, quite frankly, Logz success. Dotan, right? People say yeah, maybe built on open source, but I’m getting real value out of it. And they’re packaging it all up for me and building on top of that. I’m willing to pay for that.

    Dotan Horovits: I would like to even reiterate what Constance said before because when you look at the vendors, the vendors actually bring value here. The vendors, say, okay, I will make the open source accessible to you. But then again, open source projects, and Constance probably can say a lot about that from Envoy and others, very focused on the core functionality, the core value proposition.

    But for a much more mature organization, it needs an entire wrapping around it that provides DSSO and the authentication, the certifications and all the administrative aspects. The open source developers are not even bothered with that. Even a more powerful UI and an accessibility and user management control agents who are back whatever. 

    And this is the wrapping that vendor with again, vendor that serves enterprises and knows all these needs can augment the open source with these capabilities. I think Splunk is doing it magnificently with enterprises and Logz.io and many others.

    But the idea is that okay, you have the open source that you know and love but the open source beyond having it in a managed version also needs some additional layers to get it to be a commercial grade or enterprise grade. So it can actually be acquired that whatever you run is certified, meets the criteria that you need to run it within your organization at scale. 

    Constance C.: So I guess I’m going to say I’m very disappointed all three of you. I guess you didn’t watch my keynote.

    Alan Shimel: No, I didn’t. I apologize. But tell us.

    Constance C.: Okay, so I don’t necessarily know if it should be offered. Some things shouldn’t be offered as like the vendor implemented for you. But the main thing, one of the points I was trying to make that CNCF is more than Kubernetes. That’s why I was calling out the Cloud Native. We don’t think the — hold it. But the next thing for CNCF you have to keep.

    Actually let’s use it like the hype train. CNCF is on this hype train. And it’s great, because it’s celebrating all this hard work. I’m going to say as a community, we actually deserve quite a bit of attention, because we’ve done a lot of great work. But for us to keep on having celebrations like KubeCon Cloud Native Con, and community based, and just having these fun discussions, we need to make sure that we think of CNCF as a whole product. 

    And each project needs to think as a product. And we actually need to start thinking about integrations. Because as CNCF as a whole, we have great projects here. But there’s no glue between them. And so once you drop one project, sometimes you get some other project for free. But if you’re trying to integrate multiple things at once, you get a hard time.

    You don’t get any freebies once you implement, say Kubernetes and you’re trying to implement Envoy, both things there. No overlap, and so we need to start thinking about from a more together. I don’t honestly know that should be offered to SAS, I actually think that – I know, there’s a bit of debate about should there be CNCF Stack. 

    But I think that we should probably actually have something easily set up 10 projects that were really great together. All look great. And that can help things there. The thing that I really like about where observability space maybe for the value add as vendors, is like the key distinction. For OpenTelemetry, it’s about instrumentation data collection. That’s where our boundaries are specifically set. 

    We will never do anything about visualization. We’re trying to make you gather your data and then after, you can choose how you want to interact with that. There’s a little bit of that boundary that I think are being set around projects of where things go, because you can either try and almost be just kind of gobbling everything up, everything around you. Or you set your boundaries and then you have to let something else track there.

    Alan Shimel: Sorry, I think that’s a CNCF decision. They have to make, like for instance, how many service match projects do you are under CNCF.

    Constance C.: Well, so that’s a no kingmakers rule. Like we do have an explicit rule about there being no kingmakers, because we do want to offer things right. Because I’m biased that I love Envoy, but for some people Linkerd works great. And that’s amazing because there’s all these things there. Some people really love Prometheus, I think open source is great. 

    Metrics is not necessarily equal there. There should be different option because things work better for other there. But it doesn’t mean that we can’t maybe say have like, I don’t know, a few CNCF Stacks. Like these 10 things work great here, these 10 things work there. And this is actually going to be more on the engineers, because CNCF does have more of the model of the open governance so you choose your own adventure. 

    But then you see a little more of, it’s this great thing about open source, you choose your own adventure but we also need to think a little bit more like PMS, because marketers and salespeople are thinking about what the future will be. Because if we just implement the next thing, like go faster build all those things there, you’re not going to have sustainability to project.

    Because I think the thing that we’re taught, everyone’s like, okay. This is almost sold as this is the last big project you’ll ever adopt. 

    Alan Shimel: Agree.

    Constance C.: But we’re not. And if we don’t think about the future, sorry, everyone, you’re going to have another rewrite in 5 to 10 years.

    Alan Shimel: Guys, we’re about out of time, I got to ring the bell here as I said in the beginning of our talk. But you know what, look. I didn’t take the prerogative of taking the last word because I’m the host. We are in a golden age of open source innovation right now. And we have been for the last couple years. And I think CNCF in similar kind of foundations have ushered this golden aged. 

    And there’s a lot of companies including Logz and Splunk, and many, many others who are constantly innovating and pushing what we can do off of this foundation, and I mean foundation of open source. And I don’t know how long it’ll last until we go into a post-cloud native world, I don’t know. I may not be here, but I do think when we look back on this, it is a golden age.

    And it’s going to be very interesting to see what the next short-term, because who knows long-term, what the next short-term future holds and especially for observability. Observability is kind of the poster child right now for what we can do. That’s my poster post right there. Anyway, on that note, I think we’re going to close this one out. 

    Constance, thank you so, so, so much for joining with us today, this was great. I apologize, I had that little network outage there and I don’t have you guys up on my usual monitor. So I keep looking over here to my computer. But thank you for joining us. Dotan, as always, a pleasure to have you on my friend. I look forward to being able to see you soon. Yep. And then of course, Mitchell. You want to take the last word, Mitchell, and we’ll wrap it up.

    Mitchell Ashley: I’m going to leave it right where you said it. You just said it perfectly. Let’s end there.

    Alan Shimel: Okay, then. Hey, we’ll be back in just a couple of weeks, two weeks I think, with our next Observability At Scale. It’s a great series if you’re interested in observability. Check it out. But for now, this is Alan Shimel, TechStrong Group. Have a great day.

    [End of Audio]


  • Splunk Expands Scope of Observability While Lowering Costs

    Splunk Expands Scope of Observability While Lowering Costs

    During its online .conf21 conference Splunk Inc. today revealed a bevy of updates that advance observability while at the same time reducing the total cost of deploying its platforms.

    As part of that effort, Splunk also announced it will now make workload-based pricing available to all customers.
    Previously, a select number of small customers had access to workload-based pricing while other customers licensed Splunk platforms based on how much data was loaded into the platform. That approach, however, tends to discourage IT teams from loading as much of their data as possible.

    CEO Doug Merritt said workload pricing was created to enable a value-oriented pricing model that customers could employ instead of a data-centric model that can discourage IT teams from analyzing as much data as possible to improve IT operations.

    To further lower total costs, the company is also previewing a Flex Index option for customers that choose workload-based pricing to enable longer retention for lower-value data at a lower cost. Splunk is also expanding its cloud storage to include a preview of SmartStore, which allows larger volumes of data to be stored more cost-effectively on Microsoft Azure Cloud initially with support for Amazon Web Services (AWS) and Google Cloud Platform (GCP) forthcoming.

    Other enhancements to the portfolio include a preview of a data manager, a revamped onboarding tool for data stored in Amazon Web Services (AWS) and Microsoft Office 365, and Ingest Actions, which enables IT teams to act on data in motion in addition to data at rest stored in Splunk or the S3 cloud service from AWS.

    The company is also now making it easier to find and explore data via a federated search tool and a Splunk Dashboard Studio offering, available via Splunk Mobile, that makes it easier to create dashboards.

    At the same time, the company is also making available Splunk Operator for Kubernetes to make it easier to install its platforms in cloud-native environments. There is also now Splunkbase, a curated catalog that makes it simpler to find or develop a Splunk application.

    In terms of observability, the company is providing a preview of AlwaysOn Profiling for its application performance management (APM) platform, dubbed Splunk APM. AlwaysOn Profiling extends existing tracing capabilities to provide continuous code-level visibility and analysis.

    In addition, there is now a preview of an enhanced version of Database Visibility for Splunk APM, which automatically uncovers slow queries that are causing transaction latency without having to instrument a database.

    The company also announced that its real user monitoring (RUM) for mobile applications, which makes use of open source, now is generally available alongside the Splunk Observability Cloud for Mobile platform. The company also revealed there are previews of integration between Splunk Log Observer and Splunk Enterprise and Splunk Infrastructure Monitoring AutoDetect, a tool that automatically discovers infrastructure anomalies. There are also now additional Content Packs for managing Microsoft365, third-party APM tools and synthetic monitoring.

    Finally, Splunk has expanded its security portfolio to include Splunk SOAR App Editor, which provides a way to edit, test and create security orchestration, automation and remediation (SOAR) applications. There are now more than 350 SOAR apps now available on Splunkbase. The company also launched Splunk Intelligence Management based on a platform it gained with the acquisition of TruSTAR earlier this year and that it is making available security services via a team of experts dubbed SURGe.

    It’s not clear to what degree these additions will enable Splunk to fend off what has become a larger number of rival providers of observability platforms. However, as one of the most widely used IT operations management platforms in the enterprise, it’s clear Splunk enjoys an incumbent leader status it is determined to maintain.

  • Splunk Donates eBPF Telemetry Data Collector to CNCF

    Splunk Donates eBPF Telemetry Data Collector to CNCF

    Splunk Inc. announced during the KubeCon + CloudNativeCon North America conference that it donated a data collector to the OpenTelemetry project run by the Cloud Native Computing Foundation (CNCF).

    Splunk’s data collector runs as a sandbox-level program at the kernel of a Linux operating system and takes advantage of extended Berkeley Packet Filter (eBPF) technology to make it simpler to collect networking telemetry.

    The OpenTelemetry initiative itself spans a range of open source tools, application programming interfaces (APIs) and software development kits (SDKs) that are used to instrument applications. Previously, Splunk contributed the SignalFx Smart Agent and Smart Gateway to the OpenTelemetry project along with more than 64,000 code contributions.

    Morgan McLean, a director of product management for Splunk, said that while OpenTelemetry is officially in beta, some elements of the project are more mature than others. For example, tools for capturing metrics and traces are already being employed, while another set of tools for capturing log data will be ready sometime next year, he said.

    The data collector contributed by Splunk is among the first that operate at the kernel level to collect data, added McLean. That approach makes it possible for some types of data to be captured by default rather than requiring developers to always instrument their applications using agents to enable an observability platform. It will also contribute toward the eventual convergence of network operations and DevOps processes.

    Going forward, DevOps teams should expect to employ a mix of open source data collectors that operate at both the eBPF and application level, said McLean. The eventual goal is to instrument every application by default by making it much simpler to collect data. Today, most DevOps teams are employing a mix of proprietary and open source agent software to collect data that then must be deployed and then integrated with all the applications they build. Given the cost and level of effort required, the percentage of applications that are actually instrumented is, not surprisingly, fairly low.

    However, as agent software becomes more readily accessible, the percentage of applications that are instrumented should increase considerably in the years ahead. For DevOps teams that depend on that data to optimize application performance, that capability should prove to be a boon for improving overall observability in IT environments.

    Observability, in one form or another, has always been a core tenet of any DevOps best practice. Initially, DevOps teams focused on continuous monitoring as the most effective way to proactively manage application environments. However, it can still take days, sometimes weeks, to discover the root cause of an issue.

    Monitoring focuses on predefined metrics to identify when a specific platform or application is performing within expectations. The metrics tracked generally focus on, for example, resource utilization. Observability platforms combine metrics, logs and traces—a specialized form of logging—to instrument applications in a way that makes it simpler to troubleshoot issues without relying on a limited set of predefined metrics focused on a specific process or function.

    Those observability platforms then make it possible to correlate events so that it is easier to identify anomalous behavior indicative of an issue’s root cause. Armed with these insights, it becomes a lot simpler for IT teams to resolve issues faster.

    It’s unclear when OpenTelemetry tools will become more widely employed, but as more tools for collecting data become available, the impact on DevOps will be nothing short of profound.

  • Splunk Unveils Unified Observability Platform

    Splunk Unveils Unified Observability Platform

    Splunk today unveiled an observability platform delivered as a cloud service that captures all metrics, traces and logs in real-time without relying on sampling.

    Spiros Xanthos, vice president of product management for observability and IT Ops at Splunk, said Splunk Observability Cloud collects all that data via a single agent based on open source OpenTelemetry software to instrument an application.

    Historically, application performance management platforms (APMs) have only analyzed samples of data to identify a potential anomaly. Splunk Observability Cloud analyzes all the streaming data captured by its agent software to enable IT teams to pinpoint the root cause of an issue faster, said Xanthos.

    As a result, Xanthos said the signal-to-noise ratio dramatically improves compared to legacy monitoring platforms. It will then be up to each IT team to decide how much of that data they want to store after it’s been analyzed, added Xanthos. Pricing for Splunk Observability Cloud is based on the number of hosts employed rather than the amount of data collected.

    The Splunk Observability Cloud unifies a Splunk analytics portfolio by including capabilities provided via Splunk Log Observer, Splunk Real User Monitoring (RUM), Splunk Synthetic Monitoring, Splunk Infrastructure Monitoring, Splunk APM and Splunk On-Call. Splunk Synthetics Monitoring is based on technology Splunk gained with the acquisition of Rigor last year.

    Splunk

    The Splunk Observability Cloud is one of the first such platforms to rely solely on OpenTelemetry agent software being developed under the auspices of the Cloud Native Computing Foundation (CNCF) to collect data. That project not only reduces the cost of instrumenting applications, it also reduces the number of agents an IT team might have to deploy to collect metrics, traces and log data.

    Many rival observability platforms can collect data from OpenTelemetry agent software, but also tend to encourage DevOps teams to deploy proprietary agent software that they claim is easier to install and collects data at a more granular level. Splunk has decided OpenTelemetry has matured to the point where those proprietary agents are no longer required, said Xanthos.

    The rise of observability platforms presents an opportunity for IT teams to rationalize a raft of monitoring tools that often surface conflicting analyses. IT teams today spend an inordinate amount of time convening so-called “war room” meetings to determine the actual source of an issue. Those meetings can go on for hours, only to eventually discover an issue that only takes a few minutes to fix.

    While observability has always been a core DevOps principle, the level of visibility most IT teams have into their application environments is limited. There is no shortage of monitoring tools, but because there is no unified approach to observing an IT environment, there simply isn’t enough context being provided. As IT environments become more complex – thanks primarily to the rise of microservices-based applications that have lots of dependencies – that lack of context is rapidly becoming a major issue. A microservices-based application is designed to degrade gracefully if one microservice suddenly become unavailable. The issue is that it can take a very long time to discover the root cause of performance degradation.

    It may be a while before most IT teams achieve true observability, but once they do, many will wonder how they previously managed IT without it.

  • Splunk Adds Remote Workforce Metrics Dashboard

    Splunk Adds Remote Workforce Metrics Dashboard

    Splunk has made available a Remote Work Insights dashboard designed to help IT administrators track and identify the most relevant IT metrics for a workforce that is working from home to help combat the spread of the COVID-19 pandemic.

    Company CTO Tim Tully said the dashboard is initially configured to track virtual private network (VPN) traffic as well as access to cloud applications being made via an instance of an identity management platform from Okta.

    In addition, the dashboard tracks the level of usage of Zoom video conferencing services to help determine to what degree employees are continuing to collaborate during the pandemic.

    The level of productivity being achieved in most corporate environments is tied directly to the amount of network bandwidth being made available via a VPN, which can be deployed inconsistently on various client devices. Cloud application experiences, meanwhile, can vary widely based on the geographic region an end user is located.

    The dashboard helps IT teams to determine where there are issues they can address and where there are issues that may need to be addressed by a third-party service provider.

    Built on top of the Splunk Mobile applications, the dashboard provides a way for IT administrators to employ a tablet or smartphone to continuously monitor key remote connectivity metrics, Tully said, noting that capability means IT administrators don’t have to stay tethered to PC all day to monitor their environments.

    Over time, Splunk plans to add support for additional metrics to make it simpler for IT teams to monitor remote workforces, he added.

    Beyond simply monitoring metrics, the Remote Insights Dashboard also makes it possible to send rich notifications based on thresholds defined by the IT team. That approach allows Splunk Mobile to reduce the number of alerts being generated by the various IT platforms being monitored, said Tully. Those notifications then provide the relevant actionable intelligence IT administrators need to share with other IT professionals to remediate an issue.

    It’s not clear to what degree IT teams will work from home after the COVID-19 pandemic subsides. Many organizations may decide it’s less expensive to have IT teams work remotely at a time when many of them will be looking to, for example, reduce the amount of office space they require to reduce costs. Many organizations are about to discover that IT staffs, much like customer support personnel, don’t necessarily need to be in an office to be effective.

    Regardless of where they are located, many IT professionals are about to discover how productive they can be working remotely. That may create some boundary issues between the home and office. However, it should also go a long way toward eliminating the occasional need to go to the office at odd hours of the night, only to determine the source of a problem can only be fixed by a third-party service provider the IT professional could have contacted from home in the first place.

    — Mike Vizard

  • DevOps Chats: What Is Your Data Really Worth? with Splunk

    DevOps Chats: What Is Your Data Really Worth? with Splunk

    Gaining real insights can catapult companies ahead of the competition, but that’s easier said than done. Splunk recently released its new report What Is Your Data Really Worth? which produced some very compelling results.

    Leading-edge data innovators use data to raise gross profits by 12.5%. Ninety-seven percent of this top tier meet or beat their customer retention targets. Mature organizations are almost 10 times more likely to draw more than 20% of their revenue from new, innovative products and services. A select group of companies, categorized as data innovators, achieved impressive and measurable results.

    Andi Mann, Splunk chief technology advocate, joins Mitch Ashley on DevOps Chats to share some of the key insights in the report and discuss how companies are utilizing their data to achieve higher revenue growth, improved customer experiences and gain cost savings.

    As usual, the streaming audio is immediately below, followed by the transcript of the conversation.

    Transcript

    Mitch Ashley: Hi, everyone, this is Mitch Ashley with devopsy.kinsta.cloud, and you’re listening to another DevOps Chat podcast. Today, I’m joined by Andi Mann, chief technology advocate with Splunk, and our topic is a report that just recently released called, “What Is Your Data Really Worth?” The ultimate question, you know? It’s kind of, from, do you remember—what’s the, 42? Is that the answer? Okay, anyway, another topic. [Laughter]

    So, welcome, Andi—good to have you on DevOps Chat.

    Andi Mann: Hi, Mitch. It’s so good to be with you again.

    Ashley: Absolutely. Andi and I are friends from way back, so we’ve known each other for quite some time now. [Laughter]

    Mann: Yeah, this could get a bit squirrelly, mate. Let’s see how we go. [Laughter]

    Ashley: I made sure I didn’t have too much caffeine before we recorded, so hopefully that will kinda keep me in check, anyway, we’ll see. [Laughter]

    Mann: [Laughter]

    Ashley: So, for folks who don’t know you, tell us a little bit about what you do and what you do at Splunk and a little bit of your background.

    Mann: Sure. So, Mitch, I’m chief technology advocate at Splunk for our IT Markets Group. What that means, as an advocate, I spend my time explaining stuff to other people and advocating for technology mostly. So, I talk a lot. A lot of people will see me doing podcasts like this, they’ll see me at conferences and keynotes, writing, and other things. A lot of outbound talking about Splunk and our data delivery platform and all the great solutions we’ve got to bring data to everything.

    But a lot of people don’t see the other side of it, which is me advocating for my customers. It’s one of Splunk’s core values that we have two ears and one mouth, and we should try and use them at least in that proportion. So, I try to listen a lot to experts like yourself, like other analysts and pundits, customers, market makers, and try and help Splunk create the best possible products and solutions to make our customers successful.

    Ashley: Sounds like when I was a kid, the saying was, “God gave you two ears for a reason, Mitch.” [Laughter]

    Mann: [Laughter] Exactly, right? Oh, you weren’t the only one who got told that as a kid, huh?

    Ashley: No, I’m guilty as charged. [Laughter] So, let’s just jump to the report. Tell us a little bit about, obviously, you’re in the data aggregation analysis collection, all kinds of interesting parts of the data world and lots of different sources. How did you decide to try to answer the question of what’s your data really worth? What was the genesis of this report?

    Mann: Well, the first thing we did was, we decided to find an independent expert to help us. So, we went to Enterprise Strategy Group. Now, you know them, they’re an analyst firm out of Boston.

    Ashley: Yeah. Good folks, good folks, yeah.

    Mann: Really good folks. Their key areas where they focus on is data and security. And so, for the data part of this survey, that was a very obvious choice. So, they hope to figure out a bunch of questions to ask to see if companies were using their data in advanced ways or not. So, we were looking at things like how much data they use, where do they get their data sources from, which business departments use data in their decision making and a whole bunch of other outcomes.

    And we were able to figure out from that with working with ESG, within Enterprise Strategy Group, we were able to figure out a certain percentage, around about 10% of the survey respondents out of 1,300 respondents were what we call data innovators. So, they were taking more data, they were using it in more deliberate ways, they were using it in more business departments and more business decisions.

    And so, we were able to figure out, well, if they’re using data in better ways, what are the good things that happen when you do that, and comparatively, for the companies that are using data in sophisticated ways, what are the down sides for them?

    So, it’s a really interesting set of questions and answers that we managed to find some really interesting data on.

    Ashley: Great question to ask. So, tell us, what was the number one thing that jumped out to you? What was the learning you didn’t expect to get from this study?

    Mann: So, I think the, one of the learnings that I think we did expect to get was that using data better helps you in your business, in all sorts of ways. So, the one big area I think I was a little bit surprised at was that using data better is not just gonna help you save money, it’s gonna help you make money. So, for these data innovators, on average, they had a profitability of around 12% gross, across different sizes of businesses as well. That meant about $38 million average total gross profit for these innovative organizations who are collecting, managing, and analyzing data to improve their business.

    I think the second thing that surprised me was that this wasn’t even split between top line and bottom line. You know, in IT especially, we often look at ourselves as a cost center. We’re often told to do more with less. We’re often told to find ways to save. What we don’t hear a lot about IT is how important it is to making money, to adding revenue, but that’s what we’ve found from this research. Data innovators added on average over 5% to their annual revenue because they were using data better, and that added to reduction of cost of around 5% as well.

    So that’s how we get up to that 10 to 12% on the bottom line, but it’s a combo of making more money and saving money, which is—you know, there’s not a lot of technologies which you can point to for that.

    Ashley: Definitely both sides of the line, now. There was 5.32% over 12 months as a result of their data use. Talk about—how do you define a data innovator?

    Mann: So, some of the things we looked at for the data innovators—are they more or less sophisticated in their strategy? So, do they have a data strategy, do they have a chief data officer? Do they have specific plans over a 12 to 24 month period of how they’re gonna get more data in and use that data? Do they have analytics programs in place? Do they have a data science program in place? You know, these are some of the signals that we looked at to see what they were able to do with data.

    And then in terms of the outcomes, we looked at things like revenue growth, we looked at operational cost reduction, the ability to innovate. How long does it take to get new products or new ideas to market? We looked at outcomes as well, like customer satisfaction, customer retention, ability to make faster decisions.

    So, all of this sort of gave us this picture of what does a data innovator look like?

    Ashley: Now, just to give folks an idea here, this isn’t like baseball, everybody gets an award and gets to be called a data innovator. This is 11% of global organizations was your measurement. So, it is kinda top 11% kinda cream of the crop of folks.

    I found another interesting stat that I read in the report that said one in five data innovators generated more than 20% of their annual revenue from products and services developed in the past 24 months, compared to just 2% of data innovators. So, if you have really invested in analyzing, assessing, using, and applying data, that number is backing up what you said about—yes, it does add to topline growth.

    Mann: Yeah. Because, I mean, when you’ve got data to go on, you can make these rapid decisions. If you’re talking about innovation in life, you obviously have written about innovation quite a lot and we’ve talked about it directly a couple of times and, you know, to innovate, you’ve got to be able to make fast decisions. You don’t try things out.

    You know, typically, 95% of innovation will fail. That’s okay, as long as you fail fast, fail small, fail cheap, and fail forward. But if you don’t have the right data to make decisions, then all of a sudden, you’re in a data paralysis. You’re in a decision paralysis. You can’t make those rapid decisions. You end up having to get more information. You end up going with the loudest voice in the room, or you end up going with the loudest person in the room which, by the way, tends to work against some of the greatness of diversity and inclusion about getting different opinions, about getting different, diverse opinions and viewpoints.

    Ashley: Mm-hmm.

    Mann: So, if you—but if you have data, the data speaks for itself, and you can set gates for innovation. There’s a classic innovation theory—you try stuff out, you do it small, you set gates, you pass the gate.

    One example, for example, and directly for this audience as well, is thinking about what is a high quality release? Is it a release that has no bugs? Well, that might be too high a bar to get over, but to understand what level testing has it gone through, what is the pass/fail rate? What is the code quality? What is the compliance quality in your code? These sorts of things, they’re data points that you can then make decisions on.

    Even more so, you can automate decisions based on data points. If I’ve passed 99.92% of my tests and I’ve run 100% of the tests that I expect, that’s a really good mark and I’m probably gonna go straight into production with it.

    Ashley: Mm-hmm.

    Mann: So, I can iterate faster, I can do new things in new ways, because I have surety that the decisions I’m making are real and based on substantive information that will matter when I get to prod.

    So, innovation is absolutely a strong outcome that we see in this research as well, coming from these data innovators.

    Ashley: Now, I kind of threw the trick question at you first. What didn’t you expect to learn from this? I mean, let me toss that one out there again, since we talked about some things you did expect to learn. Were there any small, medium, large surprises that you walked away from some of the answers that came out of the research?

    Mann: Yeah, look, I think some of the surprising stuff was just sort of around the vertical side in the industries that were good and industries that were bad. I would’ve expected some other, some industries who are lower on the ability to get data insights, I would’ve expected them to be higher. Specifically, higher ed and public sector. They have a lot of access to data, they don’t necessarily have the same issues with data analytics and aggregation that private sector do. You know, they’ve got things in place around privacy and protection of data.

    So, there’s some really positive things. Higher education especially, I would’ve thought, well, they have investigative units. Research is something they do. I was a little surprised by that. What we saw was that technology organizations do really well by using data better. I sort of got that, that makes sense. They’re involved in machine learning programs and AI programs and things like that. They’re on the cutting edge. Somewhere around two-thirds of financial organizations had really good results in terms of higher revenue through better utilization of data assets.

    Ashley: Mm-hmm.

    Mann: And again, financial organizations are often on the cutting edge of technology and so forth, so that made sense. But for me? Higher education and public sector were only down around 50% at this ability to use data in operational ways. And honestly, that surprised me. I think they could do a lot better. I think they’ve got the fundamentals, the people, the technology, the inquisitiveness and the opportunity, certainly, to be able to use data in better ways. So, yeah, I’d love to see those numbers come out better.

    Ashley: Now, I wonder if, do you think there’s a correlation or a connection to this idea that those folks that were data innovators, their culture is, what you termed in this report, quote-unquote data obsessed. It was just data driven company, everything is—you know, decisions are driven by data, you know, collecting and using, it’s not just the loudest voices in your room. It seems like that’s a pretty high correlation there to the folks that are really in a place and are leveraging data in a very successful way.

    Mann: Yeah, the cultural aspect is really interesting. You know, we’ve talked about culture in the DevOps community for a decade or more, and how important the cultural change is. And, you know, we know from DevOps you can throw all the tools at the problem. If you don’t have a culture of collaboration and sharing, then you won’t have a collaborative environment to work in regardless of what tools you throw out there.

    Data is the same. The data’s there. The big difference between the data innovators and companies that aren’t necessarily as innovative with data, you know, the companies we call the data detractors and so on. One big difference is if they’re inquisitive about the data that exists and go looking for it and look for ways to use it. It’s not necessarily that they have more data, it’s not necessarily that they have different data, it’s not even necessarily that they have data that people don’t understand or understand better or worse. It’s that they have a culture that values data driven decisions.

    And so, when the decision comes to the—you know, the meeting comes to a decision factor, they have people in that room who deliberately put their hand up and go, “What is the data saying?” Rather than having the people in that room go, “Okay, I think we’ve got everything we need. What do we all think?”

    Ashley: Mm-hmm.

    Mann: Right? And that’s a cultural change, Mitch. That’s a cultural difference. Having that data obsession as we’ve termed it in the report means that your culture is looking for data, actively looking to make those data driven decisions. Actively looking to get data from everywhere and bring it to every decision. Not just the important or less important or whatever, every decision. And that absolutely is a cultural difference.

    Ashley: So, don’t take this—this is not a trick question at all. I’m interested or curious about your thoughts on data, data, data—extremely important, this report showed the value and the impact that can have. I’m thinking in an analysis standpoint, sometimes you can get into analysis paralysis or maybe the insights aren’t always just in the data, but from other factors and things.

    How do you blend both the tools, the experience, the knowledge, the capabilities of the organization and infuse that with data in a really healthy way? What are your thoughts about that?

    Mann: Yeah, look, that’s a super question, Mitch, because you know, there are lies, damned lies, and statistics, right?

    Ashley: Wow. Yeah, we—

    Mann: You can make data say whatever you want. [Laughter]

    Ashley: Yes, we can make it say whatever we want—true.

    Mann: So, you’ve gotta be careful about stuff, right? You’ve gotta be careful about bias, you know? I talked about diversity and inclusion a little bit. If all your algorithms are written by people that look and sound exactly like you, then they’re certainly gonna reflect who you are and what [Cross talk].

    Ashley: Mm-hmm.

    Mann: So, having a variety of data, but having a variety of algorithms created by a variety of people from different backgrounds—so, you’ve gotta have diversity in your teams. Again, it’s a cultural thing, right?

    Ashley: Mm-hmm.

    Mann: Your data will tell you what you want it to if you ask it. So, you’ve gotta have the ability to get more data, you’ve gotta have the ability to ask data, ask continual questions of your data. So, it’s not just the first answer. Typically, when you’re doing data analytics and inquisition, the first answer just pops up more questions for you. So, you’ve gotta be able to go through that iterative cycle of asking more questions. That’s a very fundamental and practical thing to do with how do you structure your data, what tools do you use to inquire after your data. You’ve also gotta have the understanding that some things are not necessarily a data decision. Some things actually don’t have data, and you do need to have personal experience.

    I’m a big believer, Mitch, in letting the machines make the right call on stuff they’re good at. Complex data, time series data, high cardinality data, long periodic data—you know, humans are awful at things like pattern matching, we’re awful at looking at long term data about patterns. Machines are really good at that stuff. So, let machines—

    Ashley: Also really good at large volumes of data where we, as humans, love a data point of one. You know, my kids—

    Mann: Exactly. [Laughter]

    Ashley: Those millennials … I have two data points at home, so I’m super set. [Laughter]

    Mann: Oh, yeah. anecdata, yeah, it’s the bane of our existence, I think. But it’s important to understand that machines can’t make intuitive leaps, either.

    Ashley: Mm-hmm.

    Mann: Machines have no imagination whatsoever. Have you ever seen some of the Harry Potter scripts that have been written by machine learning engines?

    Ashley: I have not.

    Mann: Oh, my goodness—it’s so awful, Mitch. It’s so bad. [Laughter] Because machines have no imagination. So, there is a cutoff point, and it’s a fair question to ask, and I don’t think there’s any definitive answer of where that cut point is. But at some point, you need to have a human to interpret and bring imagination, bring intuition, bring experience to that data driven decision.

    But I would certainly posit that you bring that human experience to the data, you don’t just go with a human gut feeling.

    Ashley: Mm-hmm.

    Mann: The data will tell you what to do.

    Ashley: I don’t recall this as looked at or at least talked about in the report—I would imagine those data innovators have figured out where that balance is, it’s not just about having the most data or the data, the answer is always in the data, right? It’s that balance of, you know, it’s the right sources, it’s the negative validation as well as the positive validation, the correlation, the analytics, how statistically valid is the information. So, all kinds of things that data scientists know how to do that help you be really good about how to use that data, and of course, that’s probably a maturity curve that you work up to.

    Mann: Yeah, exactly right. I mean, we see—and it’s not necessarily specifically in the data, but we absolutely looked at that maturity curve and what it means to be a data innovator versus a data adopter versus a data deliberator, someone who’s in the early phase, for example. We deliberately looked at what it was like as a company, what patterns. And again, in the DevOps community, they’re very familiar with this concept of patterns and anti-patterns.

    Ashley: Mm-hmm.

    Mann: And the patterns that the data innovators took gave us a sense for what is a mature business. You know, we’re not necessarily gonna be able to tell you exactly what those gates are that define good innovation or define a good test outcome, or define a good marketing campaign or whatever it is, a product that will be successful.

    But what we can do is help you understand what the data told us about data maturity. And so, that’s why we’re actually working on, we actually loaded up onto the Splunk.com website a data maturity calculator. So, it’s a free—it’s a web based assessment tool, it’s free, obviously, so you can actually compare yourself against some of these data innovators.

    You know, a really easy way to assess what’s your data use, what tools you need to get the most out of your data, what data you’re missing and how do you compare on this data maturity curve to be able to make those decisions between smart, experienced individuals and definitive or maybe not so definitive data and data driven decisions.

    Ashley: Mm-hmm. Interesting. Great. Well, we’ve used our time pretty well here. Let’s certainly find out how do folks get this information? You talked about this assessment tool of kinda where are you on the data innovator curve—how about getting the report, information about it?

    Mann: Yeah, absolutely. So, it’s all available up on Splunk.com. In fact, if you go there on the homepage right now, you will see the data-to-everything platform, and you’ll see links there to be able to get that video. You’ll be able to get, also, stories from some of our customers who have used data and turned data into delivery. And, you know, household names like Domino’s and others are really using data to create an impact, to be a data driven organization.

    So, yeah, jump onto Splunk.com, you’ll be able to see the report there, you’ll be able to jump on, read the report. You can also take that assessment for yourself. It’s gonna be really fascinating to understand how you line up with those data innovators and where you can go to try and get a slice of that extra money that those innovators are getting.

    Ashley: Great. Splunk.com, great place to go for lots of other information as well as this report. Say, by the way, before we end things, I hope you come back. I’d love to have a conversation with you about data in the DevOps world. One of the challenges—data has such a different nature, right, than—

    Mann: Yeah.

    Ashley: What we can do, you know, more flexibly with software and configuration automation and things around software, oftentimes developers sort of struggle with this amorphous, large piece of data or collections of data and how that’s evolving along with things like DevOps. So, I’d love to have a conversation about that.

    Mann: Yeah, that would be a great conversation. Yeah, I would love that, Mitch. That’d be cool.

    Ashley: Awesome! Well, hey, thanks a lot, Andi, for joining us today.

    Mann: Thank you, Mitch. It’s a pleasure. Always great to talk to you, mate.

    Ashley: Always great to talk with you. And I won’t talk about where Australia fell on the list of data innovators, but that’s another topic, so.

    Mann: [Laughter] I know! Don’t—please, don’t! Thank you!

    Ashley: Okay, alright. [Laughter] Well, you’ve listened to another DevOps Chat podcast. I’d like to thank my friend, colleague, someone I’ve known for quite a while, Andi Mann, chief technology advocate with Splunk for joining us. And thank you, of course—you, our listeners. This is Mitch Ashley with devopsy.kinsta.cloud. You’ve listened to another DevOps Chat podcast. Be careful out there.

    — Mitchell Ashley

  • Splunk Updates SignalFx APM Platform

    Splunk Updates SignalFx APM Platform

    Splunk today unfurled its first major update to the SignalFx application performance management (APM) platform since acquiring it last October.

    Karthik Rau, general manager for application performance management (APM) at Splunk, said SignalFx Microservices APM combines for the first time the SignalFx platform with Omnition, a software-as-a-service (SaaS) platform for implementing distributed tracing as an alternative to application sampling that Splunk also acquired last year.

    In addition, the latest iteration of SignalFx adds a Kubernetes Navigator tool to a SignalFx Infrastructure Monitoring module to make it easier to manage Kubernetes clusters alongside the microservices-based applications running on that platform. The module surfaces recommendations to expedite triaging and troubleshooting based on machine learning algorithms that are embedded in the platform. Splunk has also enabled workflow integration across Kubernetes Navigator and Splunk Enterprise and Splunk Cloud to provide IT teams with additional insights and context, noted Rau.

    With the acquisition of SignalFx, Rau said Splunk is at aiming to advance two major DevOps trends. The first is the rise of open source agent software that makes it increasingly feasible to instrument the entire IT environment. Omnition, prior to its acquisition by Splunk, was a founding member of and contributor to the OpenTelemetry project now being managed under the auspices of the Cloud Native Computing Foundation (CNCF).

    The second is the need to eliminate relying on sampling in favor of employing distributed tracing to be able to analyze every event that has occurred within an IT environment.

    At a time when IT environments are getting more complex, Rau said being able to resolve IT issues is critical. Modern applications based on microservices can be especially problematic given all the dependencies involved, he noted. In contrast to legacy APM platforms built to monitor monolithic application environments, SignalFx is built from the ground up to address application environments based on microservices, he said Rau, noting core to that effort is the ability to ingest massive amounts of distributed tracing data.

    Historically, APM platforms were used sparingly to help manage the most mission-critical applications in the enterprise largely because of concerns about cost. Given the complexity of modern applications, however, it’s become apparent that observability is now a core tenet of any approach to implementing best DevOps practices. The issue many DevOps teams will need to address is determining to what degree the existing tools they have for observing their IT environments sufficiently meet the requirements of new classes of applications. In many cases, that decision may be predicated on the rate at which those organizations are embracing microservices-based applications.

    Of course, Splunk is not the only vendor making a case for an APM platform optimized for microservices. Competition between emerging and legacy providers of APM platforms that have added support for containers and Kubernetes clusters is already fierce. The real issue going forward, however, is determining which of the platforms will enable DevOps teams to discover the most relevant issues soonest. After all, when short-handed DevOps teams encounter an issue, every second it takes to remediate that problem counts.

    — Mike Vizard