Tag: SLAs

  • Broadcom Survey Surfaces Raft of IT Automation Challenges

    Broadcom Survey Surfaces Raft of IT Automation Challenges

    A survey of 501 IT leaders published today by Broadcom suggested that islands of automation that operate independently of each other are major contributing factors to organizations failing to meet service level agreements (SLAs).

    The survey found that 98% of respondents encountered at least one automation issue, with 61% noting that SLA issues are a monthly occurrence. More than a third (35%) said these issues occur weekly. A full 88% indicated SLA breaches directly impacted customers in a significant way.

    The survey also found nearly three-quarters (74%) lacked visibility across their data center and cloud environments, with an equal number lacking end-to-end visibility of their automated business processes. Only 28% possessed tools that could predict automation issues, and more than two-thirds (68%) were unable to model or predict whether a new or updated automation job would actually meet SLAs. A full 69% said they are unable to properly size automation workload resources, with 61% having no way to simulate automation workloads before implementation, the survey found.

    Only slightly more than half (55%) of respondents, however, could provide SLAs and key metrics in a format that is appropriate for business stakeholders.

    Aline Gerew, head of automation for the Agile Operations Division at Broadcom, said that while it’s routine for IT teams to leverage a range of automation tools and platforms to manage IT, it’s clear they are challenged to manage those platforms in a comprehensive fashion. As a result, whenever there is an issue with one tool or platform, it creates a bottleneck that impacts customer experience in a way that ultimately adversely impacts revenue, she noted.

    In fact, many IT teams are now starting to identify automation architects within their IT teams to enable DevOps teams in a more holistic manner, added Gerew.

    Overall, the survey found that 80% of respondents are using three or more automation platforms, with just over a quarter (27%) using six or more.

    Nearly three quarters (74%) are also relying on three or more observability solutions, with just under a quarter (24%) using six or more. Just under three-quarters of respondents noted they are consequently subjected to alert storms that ultimately serve to make it more challenging to resolve issues. More than half (56%) of respondents are blind to the downstream effects of an initial alert and, as a result, do not inform response teams of which systems, jobs, applications and business processes are affected.

    In some ways, IT automation has become too much of a good thing. Every provider of an IT platform makes automation tools available, but as they are invoked, each one creates yet another island that IT teams are expected to manage in isolation. However, all it takes for an SLA not to be met is for an issue to arise that IT teams can’t easily determine the root cause of because one or more automation platforms obscure the underlying issue in the absence of any standardization, noted Gerew.

    Given the complexity of modern IT environments, automation is now a requirement. The issue, as always, is finding a way to apply it all in the most transparent way possible.

  • Senser Extends AIOps Reach to Manage SLOs and SLAs

    Senser Extends AIOps Reach to Manage SLOs and SLAs

    Senser is extending the reach of its artificial intelligence for IT operations (AIOps) platform to now include an ability to define and maintain service level agreements (SLAs) and service level objectives (SLOs).

    SLOs are a set of internal performance goals that require access to telemetry data from service level indicators (SLIs), while an SLA is a formal commitment to maintaining specific levels of service.

    Senser CEO Amir Krayden said the company’s AIOps platform collects data from SLIs and then applies predictive AI models to enable IT teams to achieve SLOs and SLAs. The Senser AIOps platform leverages extended Berkeley Packet Filter (eBPF) and graph technology to gain visibility into the entire IT environment versus requiring IT teams to deploy agent software. Machine learning algorithms are then used to aggregate and analyze that data to define thresholds for predicting performance in addition to recommending benchmarks for tracking SLOs and SLAs.

    That approach provides a single source of truth for identifying the actual level of service being provided based on a topology of the infrastructure, network, applications and application programming interfaces (APIs) that makes it possible to identify the root cause of issues and the potential impact of an outage for degradation of performance.

    IT teams have been attempting to achieve and maintain SLAs and SLOs for decades, but given all the dependencies that exist in a distributed computing environment, it’s difficult to achieve that goal. Senser is making a case for applying AI within the context of a platform for automating the management of IT to define and maintain SLOs and SLAs to make it possible to consistently manage SLAs and SLOs in a way that reduces the level of cognitive load that would otherwise be required. Senser is also working toward adding generative AI capabilities to provide summaries that explain what IT events have occurred.

    Collectively, the goal is to provide IT teams with a more efficient holistic approach to monitoring and observability that legacy platforms are not going to be able to achieve and maintain, said Krayden.

    At the core of that capability is eBPF, a technology that allows software to run within a sandbox in the Linux microkernel. That capability enables networking, storage and observability software to scale at much higher levels of throughput because they are no longer running in user space. That’s especially critical for any application that needs to dynamically process massive amounts of data in near-real-time.

    As the number of organizations running the latest versions of Linux continues to increase, more hands-on experience with eBPF will be gained. IT teams may not need to concern themselves with what is occurring in the microkernel of the operating systems, but they do need to understand how eBPF ultimately reduces the total cost of running IT at scale.

    Ultimately, the goal is to reduce the current level of complexity that today makes effectively managing highly distributed computing environments all but impossible for IT teams to manually maintain in an era where the pace at which applications are being built and deployed only continues to accelerate.

  • What’s the Difference Between SLI, SLA and SLO?

    What’s the Difference Between SLI, SLA and SLO?

    If you’re just getting into site reliability engineering (SRE) or platform engineering, you’ve probably come across a bunch of new terminologies, like SLI, SLA and SLO. These benchmarks are commonly referenced in the day-to-day life of an SRE but may seem foreign to outsiders. So, what are the differences between these abbreviations?

    Well, one of the hallmarks of the SRE approach is to gauge performance and set targets for application metrics. These targets can be thought of as reliability thresholds. If a site’s latency reaches a certain point, for example, it may break the agreement the software provider has with its consumer.

    SREs create and monitor service-level performance benchmarks for all sorts of metrics, such as uptime, latency, error count, mean-time-to-recovery and throughput, among others. But not all these performance goals are part of public agreements. Companies usually take a more proactive approach to setting more internal targets to stay far away from breaking external agreements and user trust. It’s become a best practice to set these baselines to retain functional, reliable systems.

    As mentioned, the type of targets range from firm partner commitments to more internal goals. Below, we’ll attempt to define, in simple terms, the differences between service-level agreement (SLA), service-level objective (SLO) and service-level indicator (SLI). While these concepts share many similarities, it’s important to understand how they are applied in practice. Keep in mind that each company may have a nuanced understanding of these terms and may conceive and apply them differently.

    Service-Level Indicator (SLI)

    First off, service-level indicators (SLIs) refer to the actual metrics produced by software services. This is a direct measurement of a service’s behavior. These are the real numbers that indicate overall performances, such as error rate and latency over time.

    One example of SLI would be the number of successful requests out of total requests over a one-month period. Say an engineer used an application monitoring tool that ingests data from production logs. This data showed that out of one million requests made, ten requests failed. An SLI for availability would thus be 99.999% uptime.

    Service-Level Agreement (SLA)

    Second, most technologists are familiar with service-level agreements (SLAs). Even if you’re not, you’ve likely agreed to many throughout your history as a digital user. SLAs are like a pact between the software provider and the software user or client. These binding commitments often note availability expectations that must be upheld. SLAs may also include responsiveness to incidents and bugs. It depends on the contract, but if an SLA is broken, some kind of penalty may be incurred such as a refund or a service subscription credit.

    These days, the average business relies on many cloud-based SaaS, PaaS and IaaS. Just to initiate something as simple as an online payment might require hitting multiple remote servers. But if all these services just went offline whenever they felt like it, our digital operations would come to a grinding halt. SLAs are thus necessary for enterprise software contractual agreements to ensure both parties meet specific standards.

    Once an engineer tracks SLIs and has an idea of typical behavior, they can then set an SLA that makes sense. If we take the example above, an SRE may consider guaranteeing a lower threshold than what is being actively monitored. This would ensure that application performance, at its current pace, doesn’t break any legal or contractual obligations. In this scenario, perhaps the SLA mentions an availability objective: No more than 100 requests fail per one million requests made. This would essentially equate to 99.99% uptime.

    Service-Level Objective (SLO)

    Lastly, service-level objectives (SLOs) are similar to SLAs but explicitly refer to the performance or reliability targets. An SLA may refer to specific SLOs. Or SLOs may be tracked just for internal purposes. As Google described, “the availability SLO in the SLA is normally a looser objective than the internal availability SLO.”

    You don’t want the end users to be the first people clamoring about a 400%+ latency rise in your mobile web apps. Thus, SRE teams typically keep a close eye on performance to ensure they never even get close to breaking SLAs. Some do this by setting and monitoring internal baselines that are more ambitious than the SLA threshold.

    If we take our example above, if an SLA guarantees a service uptime of 99.99%, the business may set an internal target of 99.995%. In other words, for every one million requests, no more than 50 should fail. If software systems aren’t hitting these marks, it’s a sign that the company must reevaluate designs and search for bottlenecks. Or, perhaps engineering teams have goals to improve the average downtime for the next quarter—an internal objective could be set at a higher standard than the currently perceived performance.

    As the Google Cloud blog described, “every service should have an availability SLO—without it, your team and your stakeholders cannot make principled judgments.” It’s a good reminder to be modest in your reliability commitments, they added, as consumers will come to expect this level of performance. On the other hand, setting more ambitious internal performance targets has the benefit of delivering a better result than the agreement on paper, increasing a software service’s competitiveness.

    Real-World Performance Benchmarks

    Keep in mind that the above numbers are simply for demonstration purposes. One interesting resource for real-world figures is API.Expert, a service that queries popular APIs and posts weekly performance statistics. Since APIs are the heart of many UI-based platforms (and our digital economy at large), these benchmarks stand as a good indicator of average uptimes and latencies in the industry.

    For example, at the time of writing, API.Expert’s Enterprise APIs collection ranked Microsoft Office365 and Pivotal Tracker at the top, both with a 100.00% pass rate and a 220 ms and 248 ms latency, respectively. On the other end of the spectrum, Docusign is at 99.93% with an 877 ms latency and Box is at 99.99% with 414 ms latency.

    SLIs, SLAs and SLOs—Oh My!

    Although it may sound good to an unpracticed ear, an SLA of 99.99% still equates to 52 minutes and 36 seconds of downtime per year. That’s nearly an hour of downtime in which customers are left scratching their heads or, worse, searching for other options. For traumatic health care situations, a loss of connectivity could be a matter of life and death.

    Although creating SLAs and SLOs is important to gauge system health, the reality is that it can be challenging to track and enforce them. “These agreements—generally written by people who aren’t in the tech trenches themselves—often make promises that are difficult for teams to measure,” according to the Atlassian knowledge center.

    In summary, SLIs demonstrate the real behavior of software systems. These metrics inform the creation of SLAs, which must be met to ensure B2B agreements. These SLAs often reference particular service-level objectives (SLOs) that must be met, which usually give more breathing room around SLIs. Lastly, in a digital economy with accelerating digital expectations, it makes sense to monitor internal SLOs and improve baselines over time.

  • Say Goodbye to Late-Night SRE Wake-Up Calls

    Say Goodbye to Late-Night SRE Wake-Up Calls

    Thousands of SREs, on-call engineers and DevOps pros all over the world dread nothing more than the late-night incident alert. The pager buzzing at 2:00 a.m. can cause panic for SREs and leave IT and DevOps teams with quite a mess to contain. But incident response doesn’t have to cause panic if you have the right automation tools in place. If you have ever wondered why companies like Amazon, Google and Zoom rarely suffer service outages and downtime while other companies struggle to achieve similar efficiencies, you’re not alone. In fact, you’re halfway to understanding what makes incident response automation such a vital component of your workflow. 

    Without a doubt, the best way to take back control over manual incident response and—once again—sleep through the night is to implement a powerful automation solution for incident response. We’ve listened to stories from SREs around the globe about the benefits of automated incident response. Plus, we’ve experienced them ourselves (from companies like Cisco, for example).  In the end, we’ve learned a thing or two about creating efficiency by leveraging automation and integration. Below, we’ll briefly cover how leveraging automation to remediate issues with or without a human in the loop is the best way to say goodbye to 2:00 a.m. wake-up calls.

    An Overview of Incident Response

    First, a staggering fact: In 2019, 17% of global enterprises lost more than $5 million every hour their servers were down, according to Statista. Even for smaller companies, the cost of servers going down is enormous. Following the news of Facebook’s recent outage (losing $13.3 million an hour; not counting the loss from the stock price drop), the need for minimizing downtime and reducing these costs is clear. 

    In order to fix issues faster, organizations need an easy-to-use tool that SREs and DevOps teams can implement to troubleshoot and automate incident response. For one, users should opt for a drag-and-drop system. This method is preferred over headless automation tools that too often result in data loss and extended downtimes.

    Next, IT organizations need to take the next step with automation and implement best practices. We can go from asking “How do we bring in automation?” and start to think in terms of “What are the use cases when I do?” A winning incident response toolset will help customers navigate this challenge. An automation platform should also allow users to fine-tune workflows with a library of connectors and actions that are comprehensive enough to get the job done. Ideally, your cloud stack should include several functions such as alerting (such as PagerDuty), monitoring (like Datadog) and analytics (Splunk, for example), while integrating with collaboration tools like Slack and Jira.

    What Are Some Typical Use Cases?

    Let’s dive deeper into three use cases that incident responders and engineers commonly encounter. These examples demonstrate why a powerful automated platform lets small businesses automate effectively and ensure long-term uptime just like larger enterprises.

    Incident Response Automation

    It’s all hands on deck when that 2:00 a.m. incident response alert goes off. Why rely on manual responses which can often lead to broken uptime SLAs and even drag down a company’s reputation? Automation is the key to operating any large-scale service in the cloud.

    Cost Management

    The costs of extended periods of downtime don’t stop at the checkbook. When incidents occur without drag-and-drop automation, long-term side effects can dramatically up the company’s losses.

    Orchestration

    Orchestrated automation tools provide credential management, templates, playbooks and data processing for any company size. They empower users to curate services to their liking as well.

    Want to Learn More about Automated Incident Response? 

    Sign up for this upcoming devopsy.kinsta.cloud webinar on Monday, October 25th at 3:oo p.m. Eastern. We hope you’ll join us to learn more about how to integrate automation into your workflow and stop those pesky 2:00 a.m. wake-up calls.

  • Higher Mobile App Stability Begets Higher User Ratings

    Higher Mobile App Stability Begets Higher User Ratings

    In the competitive mobile market, application stability is imperative. Downtime leads to poor user experiences, which stunts growth and revenue. Apps that have poor stability suffer the consequences. In fact, new studies show that just a 1% lower stability ranking can lead to nearly a one-star drop in App Store ratings.

    Bugsnag recently released its 2021 Application Stability Index (ASI) report, Characteristics of Leading Mobile Apps. The study took 260 top-performing mobile apps across industries and reviewed each’s stability and end-user satisfaction. The study found that apps with solid stability tend to rank much higher in the App Store and maintain increased user engagement. The report also demonstrated that developers are pivoting to weekly releases to quickly address bugs, progressing from the bi-weekly standard for software updates.

    Below, I’ll review the specific details of the ASI and the report and consider how stability varies throughout industries. Hopefully, the results here will help other software teams benchmark their app’s performance and release cadence against top-performers within their sector.

    Stability = User Satisfaction

    When measuring uptime and availability, five nines, or 99.999% uptime, is the golden target for most teams. This report measured stability as the percentage of apps sessions that were crash-free. The median across market-leading apps was 99.80%.

    What’s interesting is that apps with more nines in their stability score achieve markedly higher App Store ratings. Apps that scored less than 99.00% had a median rating of 4.15, whereas apps with 99.99% to 100% measured uptime had a median rating of 4.70. The distribution of ratings was extremely wide for low-performing apps, compared to higher average scores for higher stability.

    What do these results say? Users expect uninterrupted sessions. Frequently occurring stability issues can damage the consumer’s opinion of an app, leading to dissatisfaction and harsh reviews. The more stable an app is, the better chance it has to drive consumer success.

    Stability by Industry

    The study also exposed stability differences between industries. B2B SaaS apps ranked relatively high, at 99.85%. This is likely because B2B software must meet service-level agreements (SLAs). Such services have fewer (yet more high-paying) customers to support, the report speculated. Mobile apps directly tied to the exchange of money, such as e-commerce (99.86%), travel and hospitality (99.90%) and financial and banking (99.85%) also ranked consistently high in stability.

    Coming in second were mobile apps in the business-to-consumer (B2C) (99.82%), consumer goods (99.80%) and health and wellness (99.78%) categories. Though these areas require decent availability to remain viable, they may not need such stringent SLAs. In such scenarios, non-stop availability isn’t as directly tied to end revenue.

    Lastly, apps with the worst stability were found in the mobile games (99.71%) and media and entertainment (99.65%) categories. Mobile gaming had the worst ratings of all industries; mean stability equated to over a full day of outage per year. Increased downtime in both categories is perhaps due to more problems with frequent media updates. These areas also tend to have a lower average revenue per user (ARPU), which may affect how teams value ongoing support.

    Deployment Frequencies

    According to the report, highly stable mobile apps tend to release at least once per week, replacing the bi-weekly norm for updates. Nearly all industries are pushing at least four releases per month, aside from consumer goods and travel and hospitality, at 2.5 and 4 respectively. E-commerce takes the cake with a mean of seven releases per month.

    Nowadays, progressive delivery is made possible due to increased emphasis on CI/CD. Therefore, rapid deployment frequencies are the norm. Releasing new versions more quickly can help appease users with new features. It’s also helpful to quickly patch bugs and decrease mean time to recovery (MTTR) for major incidents.

    Users Love Stable Apps

    Throughout the pandemic, digital reliance soared—84% of consumers said applications were a lifeline to normality, found a recent AppDynamics report. In this climate, mobile applications are critical to delivering valuable interactions.

    Yet, user expectations have evolved. Now, it’s readily apparent that stability directly impacts consumer confidence. The ASI findings behoove engineers to edge closer to the five-nines goal. The more nines you have, the better off you are.

    “The results of our second ASI report highlight the need for better proactive error monitoring and stability management to help engineering teams build healthier apps that deliver superior customer experiences,” said James Smith, SVP of the Bugsnag Product Group at SmartBear.

    It’s good to reiterate that this study examined a handful of leading apps from each industry. So, these scores shouldn’t be construed as inclusive of the entire app marketplace, only as benchmarks for the top mobile app performers.

  • Nobl9 Makes SLO Specification Open Source

    Nobl9 Makes SLO Specification Open Source

    During an online SLOconf event today, Nobl9 revealed that the platform it created to enable IT teams to achieve service level objectives (SLOs) is now available under an open source Apache license.

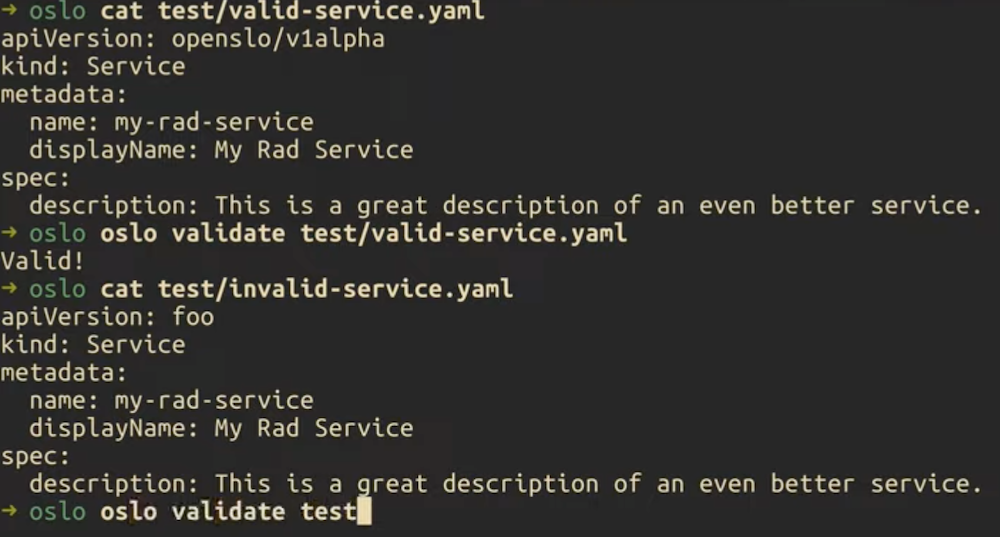
    Brian Singer, chief product officer for Nobl9, said the goal is to make a YAML specification format for defining SLOs that includes a parser and basic validation and testing capabilities more accessible via an OpenSLO project. Achieving that goal is critical at a time when organizations are deploying microservices-based applications that have dependencies that often adversely impact performance and availability.

    While the concept of an SLO and/or a service level agreement (SLA) has been around for a long time, IT teams that have embraced DevOps best practices by hiring site reliability engineers (SREs) are programmatically attempting to assure that SLOs are attained and, just as importantly, maintained, said Singer. Most SLAs have, historically, not been well-enforced. OpenSLO makes it possible to achieve that goal by embedding SLO objectives within a YAML file that become part of a Git-based workflow, he noted.

    SLOs

    Niall Richard Murphy, author of the book, Site Reliability Engineering, has signed on to be a core OpenSLO contributor working alongside committers from GitLab, Dynatrace and Nobl9. The ultimate goal is to make it simpler to share and migrate portable SLO specifications across multiple application development projects by constructing them using an object model, said Singer.

    Nobl9, meanwhile, will continue to operate a software-as-a-service (SaaS) platform for managing SLOs based on OpenSLO. Singer noted there will be an increased need for OpenSLO as it becomes more widely employed. The Nobl9 SLO platform is compatible with monitoring platforms such as Datadog, New Relic and Prometheus, and uses data collected from monitoring and observability platforms to calculate acceptable rates of error per service. It can be configured to trigger alerts and even workflows in anticipation of outages.

    Accessible via a CLI/GUI/API, the platform also enables DevOps teams to create business rules and define “facets” of users based on the application experiences required. DevOps teams can identify users who are being serviced poorly in addition to tracking groups of users. They also can associate contractual obligations to an SLO for a critical business period.

    The platform also makes it easier to determine how to make systems more reliable or lower reliability goals to reduce costs when possible. IT organizations will also spend much less time determining the root cause of any issue using a combination of real-time and historical data that is more accessible. Today, it’s not uncommon for IT teams to spend weeks looking for the source of an application degradation issue, only to discover the problem can be fixed in a matter of minutes.

    It’s still early days as far as adoption of SLO-as-code is concerned, but the days when SLAs or SLOs were, at best, aspirational statements of intent are coming to an end. The expectation is SLOs will soon be maintained via YAML files embedded within application code and distributed across a rapidly expanding enterprise with more interdependencies than any IT team can manually track.

  • How to Use APM to Hold Cloud Providers Accountable

    How to Use APM to Hold Cloud Providers Accountable

    Here’s the challenge: Cloud providers’ service level agreements (SLAs) typically stop at the edge of their cloud, while your internal service level expectations run end to end. Measuring performance from the end user to the application and back, including device details, user productivity and page load times, is essential for customer satisfaction and continuous performance tuning. How long does it take to launch an online app, open a work order or complete a claim form? What are execution and completion rates in different locations? The metrics and associated metadata provided by application performance monitoring (APM) tools can help your DevOps teams rapidly identify actual performance issues, troubleshoot them quickly and efficiently and optimize cloud spend and service level agreements.

    Automate Data Collection

    Collecting performance details for multiple web browsers, operating systems and devices is impossible if you have to manually tag and instrument the code. Modern APM solutions automatically deploy JavaScript snippets, page tags or agents to your web pages, Java and .NET applications and mobile apps. Small binary agents and efficient compression algorithms ensure minimal performance impact to the end user device or the network as they send telemetry information to the APM back end. Your DevOps team can then work with the actual attributes of every device, including manufacturer, model, operating system type and version and resource consumption to monitor the end user experience across IaaS, PaaS, SaaS and hybrid environments.

    Early Warnings with APM

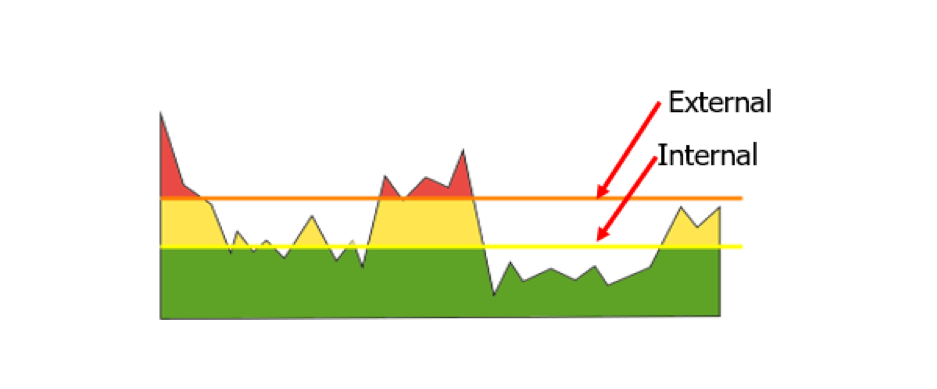
    To trigger early warnings, APM systems automatically determine an application baseline, or you can manually set specific thresholds. Typically, internal thresholds are set up to provide early warnings of possible issues before users are negatively impacted, while external thresholds can be linked to your actual SLA terms.

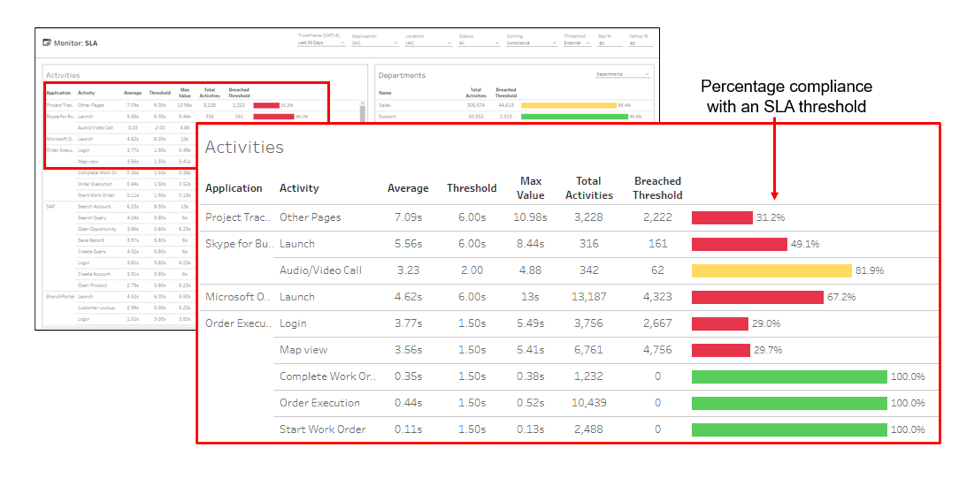
    These SLA reports are more than colorful views. By using dashboards that color-code SLA status based on the end user experience, you can better enforce service levels with your cloud providers. For triage purposes, you can break out details by department, geography, operating system, device type, target server, carrier and other characteristics as needed. You can also see at a glance your compliance measurements, which show the percentage of response times that are meeting the agreed-upon targets with your cloud providers to hold them accountable for performance.

    Streamlining Remediation

    Automation is key to accelerating mean time to repair (MTTR). When an alert is triggered, APM tools integrate with your service desk systems to automatically open trouble tickets, identify probable causes and analyze the business impact for prioritization. This level of detail and integration significantly reduces delays that are historically associated with performance troubleshooting, as it provides the necessary context for troubleshooting. Another option with advanced APM solutions is the ability to automate remediation of common end user experience issues, without involvement of the service desk staff.

    Comparing Before and After

    Another useful outcome of these detailed metrics is the ability to compare parameters before and after a change. By baselining performance, APM tools help you document and validate the actual end user experience impact of code releases, device changes or service provider upgrades. It’s not uncommon for users to complain after a new release, but using APM reports you can take a data-driven approach to quickly investigate user complaints by comparing different time intervals. You can start by exploring various characteristics and isolate the affected group based on device health, network subnet, geography, server or cloud provider. Once you have determined whether the problem is within your control (code, architecture, etc.) or within your service providers’, you then can have more productive discussions with service providers to demonstrate exactly where and when an SLA violation occurred.

    Keeping Track of SaaS Applications

    As you expand use of SaaS applications such as Office 365, end user experience monitoring and SLA management can be used to hold these providers accountable. Slow application launches, logins, page loads and other performance issues can impact user productivity, adoption rates and deployment schedules, costing the organization support resources and unused license fees. That’s why SaaS-based APM tools give you immediate usage measurements, enabling you to quickly adjust license quantities and optimize costs. Real-time monitoring of user wait times, crashes, device health and other experience metrics gives your team comprehensive awareness of how performance, device type or operating system versions are affecting employee productivity. This information can be used to quickly identify problem areas, validate migration plans and prioritize future investments.

    Monitoring for Accountability

    Getting what you pay for from your cloud providers is much easier if you incorporate detailed user experience measurements into your SLAs. A best practice is to monitor everything that happens on every device across the organization such as how long it takes to boot up, login, open specified apps and perform business-critical tasks. If any of these are off target, your APM solution can open and prioritize a trouble ticket with a list of probable causes, before the affected users can call support. Automated end user experience monitoring, reporting, and policy management, backed by self-instrumenting devices and apps, are essential links between a service provider’s commitment and your actual results.

    — Gayle Levin