Tag: service mesh

  • HashiCorp Advances Open Source Consul Service Mesh

    HashiCorp Advances Open Source Consul Service Mesh

    HashiCorp this week updated its Consul service mesh to make it easier to manage namespaces across multiple services.

    Previously, DevOps teams would have to manually ensure each namespace assigned to a group of services did not conflict with each other. The release of 1.7 of Consul enables teams to restrict access to services residing in isolated environments on a shared cluster, eliminating the issue.

    In addition, DevOps teams can now delegate administrative privileges for a given namespace to individual teams, which enables them to manage their own services in keeping with best DevOps practices, rather than having to rely on a cybersecurity team to manage that process for them.

    With the rise of microservices based on containers, interest in service meshes to provide a means to discover and manage services is on the rise. However, services span both emerging microservices-based applications and legacy monolithic applications. Rather than adopting a service mesh that only runs on one platform, HashiCorp is opting for an open source service mesh that spans multiple platforms and is easier to deploy and manage than rival offerings such as Istio.

    Amith Nair, vice president of product marketing at HashiCorp, said that approach also makes it easier to deploy a service mesh at scale across multiple clouds and on-premises IT environments. Because Consul is designed to deployed on top of proxy servers such as Envoy or NGNIX, it can be deployed almost anywhere to manage services sprawl across the extended enterprise, noted Nair.

    As far as the adoption of service meshes are concerned, it is still early days. Many organizations are in the process of shifting away from managing applications to focusing on services that span multiple applications. Given all the dependencies that exist between various services, that shift represents a major challenge. A service mesh alleviates some of that challenge by providing a mechanism for both discovering and governing services that are increasingly interdependent.

    That approach also provides the added benefit of allowing teams tasked with governing and auditing IT environments to focus more on higher levels of abstractions versus updates to every line of code on which those services are constructed.

    For now, there are no standards, de facto or otherwise, in terms of service meshes. Many organizations may find themselves adopting multiple frameworks, which may lead to further advances in interoperability specifications such as the Service Mesh Interface between rival platforms.

    Less clear for now is who inside an IT organization will be responsible for acquiring and managing a service mesh. In some organizations it might be a network operations or cybersecurity team. In other organizations, those roles may have already been incorporated within a larger DevOps team.

    Regardless of the approach, the need for some type of service mesh is becoming more apparent. The good news is there is now no shortage of options. However, DevOps teams should note that in terms of overall complexity and amount of compute resources consumed, not all services meshes are the same.

    — Mike Vizard

  • A New Paradigm in Container Security with Service Mesh

    A New Paradigm in Container Security with Service Mesh

    Containers have been around for some time, but only recently has the technology become mature enough for large enterprises to adopt it both on-prem and in the cloud. The obvious benefits for developers include the ability to dramatically reduce the time to production and the ability to lower the operational burden. This is further supported by implementing a service mesh which provides fast, reliable and secure communication among containerized infrastructure.

    The Rise of Kubernetes and its Impact on Security

    Kubernetes (k8s), introduced late 2014, bring container orchestration at large scale to both cloud and on-prem environments. The benefits of using k8s is clear and stipulated mainly due to the ability to become agnostic to the infrastructure. An application based on k8s can easily scale out from your datacenter into multiple cloud providers, and back. However, the challenge with Kubernetes is it creates a huge problem for security operations. Trying to enforce micro-segmentation on a large k8s cluster using traditional firewall models is not feasible.

    As the move to containers rise, so will container-based cybersecurity attacks. Criminal hackers will always be on the hunt for new ways to exploit this area. As container operations are inherently dependent on the development pipeline (CI/CD) so should be their security attributes. Any other interaction point will be an afterthought resulting in slower operations or reduced security. Organizations moving to containers and k8s should act preemptively due to on-going and increasing complexity driven by scale.

    Enter Service-Mesh

    Implementing a service mesh layer ensures that communication among containerized infrastructure services is fast, reliable and secure. It is a configurable, low‑latency infrastructure layer that handles service-to-service communication. It is responsible for the reliable delivery of requests through the complex topology of services that make up a modern, cloud-native application. In practice, a service mesh is typically implemented as an array of lightweight network proxies called sidecars, that are deployed alongside application code without the application being aware. The mesh provides critical capabilities, including service discovery, load balancing, encryption, observability, traceability, authentication and authorization, and support for the circuit breaker pattern.

    Criteria and Security Best Practices

    • Pre-scanning of images isn’t enough. Enforcing runtime micro-segmentation for container services should be addressed at runtime as they introduce an easier, more prominent attack vector.
    • Easy integration with development pipeline. As noted, the alternative will impact business agility or security quality.
    • Micro-segmentation should be decoupled from the infra and network as otherwise, it will require some kind of application to IP/PORT/protocol mapping.

    Implementing security built for k8s environments and running both on-prem and in the public cloud that uses Istio, a well-known open-source service mesh developed by Google, is recommended. Vet solutions connect directly to the code pipeline with enhanced security capabilities, such as the signing of artifacts that will be deployed to the k8s cluster in the code stage with the ability to generate signed identities. Instead of looking at machines and IPs when workloads boot up, the administrator will see that services will be able to control where they run.

    This will also enable you to intuitively create identity-based micro-segmentation. This is an advantage since micro-segmentation was always a complicated task to achieve, requiring administrators to map an application to the network while keeping track of what is running in the environment.

    With identities and a service mesh layer, it is only necessary to focus on your business logic. The fact that identities were generated during the CI/CD pipeline, provides the ability to control the application without the need for service discovery. Identities are represented by their business-context names, originating in the CI/CD pipeline, so the operator can easily group them together and assign policies at different layers of granularity.

    K8s is a great technology that enables the harvesting of containerized environments. Adopting it can accelerate your organization’s digital transformation dramatically, but it can also require you to adopt new methods of application security. Contracting with a k8s-focused security organization will allow the business to accelerate its migration to cloud-native applications on-prem and in the cloud, in a most automated fashion.

    By providing the needed security and operational capabilities, k8s clusters admins are afforded an enterprise-level micro-segmentation solution with policy orchestration, single pane of glass to your clusters in a multi/hybrid cloud deployment and the ability to connect between containerized clusters and legacy applications, as well as other resources that are external to the cluster.

    — Ran Ilany

  • DevOps Chat: Service Mesh Tracing, from Envoy, Omnition to Splunk

    DevOps Chat: Service Mesh Tracing, from Envoy, Omnition to Splunk

    As application functions get smaller, containerized, become microservices and combine into service meshes, a new set of challenges crop up. What functions does each service perform? What state constitutes services in trouble? What are the dependencies between services across a complex service mesh? How can we instrument observability and tracing between the service interactions?

    Constance Caramanolis, software engineer at Omnition, joined us on DevOps Chats, recorded just before Splunk’s acquisition announcement. After working at Microsoft, Constance joined Lyft, in part to work with Envoy–an open source project created by Lyft that brings upstream and downstream tracing across a service mesh. Constance recently joined Omnition, while still in stealth, to help “flip tracing on its head.”

    It’s genuinely a fascinating conversation and gives us a window into the challenges and solutions to managing a service mesh at scale. Listeners should also check out our DevOps Chats episode talking about the Splunk’s acquisition of Omnition with Rick Fitz, SVP and GM of Splunk’s IT Markets Group.

    Transcript

    Mitch Ashley: Hi, everybody. This is Mitch Ashley with devopsy.kinsta.cloud and you’re listening to another DevOps chat podcast. Today I’m joined by Constance Caramanolis, software engineer with Omnition. Constance, welcome to DevOps Chat. Great to have you on the podcast.

    Constance Caramanolis: Thank you so much for having me. I’m very excited.

    Ashley: Oh, I’m excited too. I love having, pardon the term, but rock stars like you, developers that are doing some cool work on our podcast. The topic is service mesh at scale, but before we get into that, would you first just introduce yourself, maybe tell us a little bit of your background as a software engineer, what you do currently at Omnition, and if you could tell us a little bit about Omnition?

    Caramanolis: Yeah. So I’ve been in the industry for several years. I first started off at my Microsoft. So I got a lot of good experience in terms of building large components that need to run reliably. So I worked on Windows and Windows Film there and then I moved to Lyft three and a half years ago where I purposely joined to work on Envoy with Matt Kline and Jose Nino and others within Lyft. At Lyft I worked on all aspects of Envoy from configuration management to adding either integral features for open source community or just rolling it out within Lyft.

    The last few months I was on Lyft I worked within our data platforms team just building a variation of a work flow tool. So now I actually just joined Omnition not too long ago. And I’m gonna be focusing a lot on the open telemetry component. We’re using open telemetry through so much valuable data that tracing provides that it’s actually, instead of just looking at individual traces, you’re able to get a whole understanding of what an application does and what impacts _____ have and how it propagates using that tracing data.

    Ashley: Easy to see why you made the transition from your work on Envoy at Lyft and now at Omnition. Well, let’s start out with talking about service mesh, microservices, of course containers, et cetera, et cetera. That’s certainly how we’re developing applications these days. Service mesh brings some other things to it, I think some more complexity because you’re talking about a configurable low latency infrastructure layer that’s really designed to handle network based and process communications at high volumes. So that right there tells you that there’s complexity involved and any time you’re building software, creating applications, how you run that in a service mesh architecture has got to bring with it some challenges. In your experience, what are some of those challenges that you’ve seen?

    Caramanolis: I think the big one, especially how it ties back to Envoy’s main goal in provide observability is that as you break components apart and put different parts of the internet, doing what is still working versus isn’t working and having a consistent definition of that is very challenging. Good example that we love to use when we’re talking about Envoy, especially before people have adapted Envoy is that there is no standard definition of what a failure is. Some people may say that a 503 is not an error. Please don’t do that.

    Ashley: I’ll avoid that on this podcast.

    Caramanolis: Thank you. But if you don’t have–not having standard definition of error across different languages and tools makes it actually hard for people from different teams or just say higher up VP’s or directors to know if things are working or not. Observability just across any service mesh is pretty complicated. Another one thing is definitely coordination in terms of topology especially if we’re talking about coming from monoliths. One of the benefits of a monolith is that you know where all the code is, you can figure out where the ____ ’cause it’s usually within one repo and you can just read it.

    But then the other–that’s definitely great ’cause you need to see where everything is, but when it gets really large it can take a long time to build, deploying it. You have some pieces of code that run maybe once every ten minutes. So why does that need to be running alongside something that’s high priority. It needs to be really efficient. When you’re bringing things apart it’s gonna be harder to actually correlate how things interact. As everyone usually tries to keep documentation up-to-date, sometimes you’ll forget like, “Oh, I’m actually calling an API that just moved to service B and ___ service A.” So keeping that mental model of the service topology is very challenging and is so dynamic.

    Ashley: Especially with microservices architecture. We’re creating so many more of them too.

    Caramanolis: Oh, my goodness. Yeah. Especially it could be say one person’s start of day where like, “Hey, just create a new service and deploy it and let it invoke a very low priority API call.” That’s–you immediately depend on how many people you hired, ____ example blowing up the number of services very quickly. I would say probably third challenge of microservices. One is in actually operation. Is that from an operation point of view how do you remediate things when things go wrong? ‘Cause unfortunately, things will go wrong and usually the goal of any application is stay up as long as possible and to serve customers, whatever your definition of customers are.

    How do you build tools to handle things when things do go wrong and low do you maybe standardize that so that way you don’t have to train a company’s engineers in ten different tools to say, “Handle a certain error case or three different error cases and standardize in that”?

    Ashley: Very interesting. It’s compelling to me why you might pursue a path of using a tool like Envoy. Tell us a little bit about how did you end up using Envoy.

    Caramanolis: I joined Lyft to work on Envoy because I had actually met Matt almost a year before I ended up joining Lyft, but he was talking about how–when we were talking about it it’s just there is a need for Lyft to scale ’cause especially one of the big problems that was experienced is that we were not getting really good observability on our ELB’s. So sometimes we could see things–we know that say I was–for example, I was trying to ____ ride, but when we’d look at our metrics we wouldn’t be able to see things failing.

    So that definitely clearly led to an initiative you saw that our observability along, just our regular request path need to be improved. So Matt and I–and that’s just one example. Matt definitely talks more about the motivation of why Lyft built Envoy, I think in one of his earlier talks. It was definitely–and also just it was an area–I’ve always loved infrastructure and backend. And so being able to build something that the entire company is reliant on, Lyft being able to scale is a road blocker to us being successful.

    So Envoy allowed us to scale because we could add 10 or 100 services instantly and not have to worry about service discovery. So just being a part of something so critical and the opportunity to just learn so much and I’m gonna say I definitely–I was intimidated by the project. So I loved the idea of joining a project where I’m gonna get–mentally get my ass kicked in terms of I have no idea what this is. It’s swimming in the deep end with sharks and I can’t wait to see if I can learn how to swim and see how great–how this shapes me as a developer.

    Ashley: You are a courageous person. Not everybody is willing to expose themselves that way to that much risk. So congratulations. That’s great.

    Caramanolis: Thank you.

    Ashley: Fantastic. More of us should do that. Well, you gave a talk just recently, I think it was December of ’18, KubeCon talking about reducing in the meantime to detection specifically with Envoy for service mesh. Say a little bit about that.

    Caramanolis: Yeah. So a lot of the talks–so I’m gonna say we, as a community. There’s a wonderful community of either contributors and maintainers and also just people who bring blogs around Envoy, a large of the community has talked about either Envoy’s features and how it’s helped them from more of a technological point of view of how it’s helped them to scale and become reliable and just debug issues. It was definitely one thing that we’ve experienced internally is how do we translate that so the rest of the developers, and when I say the rest of the developers, like application developers. Not the DevOps or infrastructure engineers who are either enabling ongoing ____. How do the rest of the application developers use Envoy to their benefit day to day?

    So I was trying to make a talk that would show how I use Envoy at Lyft to identify where issues are coming from and build that up to be more digestible to everyone else. Also tried to highlight that I know with the amount of work I’ve done on Envoy I have built my own blind spots about things that I’ve forgotten or were critical. So I was using an example that I had a very lose definition of HP status codes before I joined Lyft. I’m sure there’s so many application developers who don’t have that–who don’t have a solid idea of what those mean.

    So I would have to give presentations on what these meant or what these ____ meant and how they’re related to Envoy just so that way everyone would have the same set of tools going forward to better debug issues when they happen. So yeah. I was trying to make that digestible as a presentation.

    Ashley: Interesting. Yeah. I heard the talk went over very well. I’m sure you had a lot of people come up to you after with some good questions or wanting more information. It’s a great way to share. When you and others contribute back to the community, not just code or other things, but also talks, and people get to see real applications on Envoy and the technologies. Anything you’ve walked away with in terms of learning since giving that talk about either reducing meantime to detection or implementing Envoy for service meshes?

    Caramanolis: I think some of the bigger learnings is that–or maybe the learnings that resonated more with me is that these types of talks need to happen more especially within Envoy and giving say an intro debugging talk or even making interactive. So say if we’re able to set up a test environment where we had Envoy’s, like a mini microservice environment. Then you can do test requests and see how they failed. And after give people a hands-on safe way to learn how Envoy worked, that’d be really great because you can see everything on a slide. You can listen to it, it can resonate, but applying that to day today is a little hard without there being someone to bounce ideas off of.

    Envoy as a project itself has been really, really successful and there’s been amazing contributions and hearing ____. I was very lucky to work with a lot of really smart people from Google and all these different companies. I’m just mentioning Google ’cause those are the people I worked with most closely. All these really, really smart people, I got to learn from them indirectly or directly, I should say. But also at conferences people would come up to us and say, “Oh, I was trying to do this with Envoy,” and you’re like, “Oh, I never thought of that.”

    And Envoy Con, there was just like 30 minutes talk of people would come up with, “Oh, we’re trying to do this one case here. So we built our own filter and we did that thing that way.” You’re like, “Woah, that is really cool.” Just seeing how other people think a problem differently really could highlight either gaps in our own knowledge or like, “Oh, maybe we should try their approach.” So I think maybe that’s the most valuable thing about conferences. Maybe I could share with people, but hearing what other people have thought about this topic really teaches me a lot about different ways to solve a problem.

    Ashley: It really is. A talk really is almost like initiating the two way conversation gets to happen. That’s what kind of–seize it with lots of good information for people to come up and talk with you after. So that’s awesome.

    Caramanolis: Oh, yeah. Actually that’s a really good way of saying it. Yeah.

    Ashley: Well, what advice would you have for anyone who is maybe not experienced in using Envoy, if they’re just approaching it. How would you suggest that they get started and maybe are there some early lessons learned that you could share with them about how to more effectively use it?

    Caramanolis: Usually when these types of questions come up I always ask people what problem are they trying to solve. At least one common question that was at KubeCon, and since this is the context of KubeCon, is “Should I migrate to Kubernetes or Envoy?” I always reply back with, “What is your most pressing problem? Are you having issues with network observability or standardization of error cases, or is it that your current deployment pipeline isn’t working as expected?”

    So say they wanna focus more on the Envoy part, then I wanna–then it was like finding out more about their topology. So the Envoy configs. Anyone who has definitely worked with Envoy and has listened to this will probably giggle at this. The Envoy configs are definitely overwhelming, especially for those who are initiated into it. And so starting off really simple. Either Matt–I think Matt and myself, one of us had talked about how we had rolled that Envoy at Lyft. So we started off with either do it at edge or do at ingress with no service mesh or egress and slowly built that up there is like building up at one part of the interactions instead of doing it all at once because all at once, there’s so many components that can go wrong.

    One misconfigured value, it could be technically correct value, but say you put the wrong port, but you hear it everywhere, then finding out where that wrong is very hard. So definitely my advice would be starting off small, set a really clear scope, either ingress or egress out of one service or set of services or just at your edge and then building that trust within your developer community. So once you have that definitely start educating the rest of the developers who are using it saying, “This is how the errors look like and this is what that means,” and helping them see that value, ’cause once all the developers see the value it definitely–at least for my simplify their lives ’cause they no longer have to spend time like “I know this one error is failing, but either which service is causing it or do I know if it’s a network issue or is it bad application code?”

    With Lyft, Envoy was able to very much isolate it to service B is having a bad day and we can see if it’s having any other impact anywhere else, but at least we know where to focus on service B. If there are any questions, the Slack community, the flag channel for Envoy is very responsive if you do run into issues, like always ask questions there or post an issue and get hub and people do make a really concerted effort to reply as quickly as possible. I would say the community–

    Ashley: That’s fantastic.

    Caramanolis: I really respect them and love them and I do miss working with them on a more daily basis.

    Ashley: Can you maybe translate or transition into a little bit of what you’ve been doing at Omnition? What kind of work are you doing now?

    Caramanolis: Yeah. I’m actually gonna relate a little bit back to my KubeCon talk. Part of my KubeCon talk was talking about how I had this one issue. I know it’s hitting–I get, like say, if I’m gonna use an example, I think with the example I used and the talk was I can’t see photos. So I know it hits on the edge and it goes from service A to service B to service C. What allowed me to do that with Envoy is that Envoy has very clear metrics of your upstream and downstream colors. And to avoid defining that within here ’cause some people have different definitions, pretty much Envoy tells you what services your dependent on.

    So without having those metrics of knowing where your service is dependent on, sometimes it is hard to track down what piece of code is causing an issue. So one way actually people do that is actually with traces. If you trace–say I know that this request is failing. I could look for this trace and then see that it’s going from service A to service B to service C, which is really valuable. So what Omnition is trying to do is actually foot tracing on its head because usually the normal paradigm is to look at an individual trace and then try to correlate other data around it. Either it’s like an input value to a request.

    It’s either, “Oh, we know it’s always service B that’s having–after ____ is having a bad time.” And so it’s usually start from a really granular data point and build out the information. We take all the trace data and you’re able to see that everything went from service A, some things go to B, some things go to C, D. And then so if something’s going wrong it’ll be a red line and you’ll just say, “Oh, I know that service B is caught in this error. Let me look more into it.”

    Ashley: That seems extremely useful.

    Caramanolis: Yeah. And it’s like–it’s actually–it almost would make my talk from KubeCon obsolete ’cause I’m trying to teach the ____ with using Envoy as like I follow the service graph, but I follow symmetric that Envoy produces.

    Ashley: I wish you the best. It’s tools like that that really are essentially to be able to grow the infrastructure the way that we’re building software now. Congratulations on the move and I’m excited for you, Constance. I wish you all the best. Thanks for being on the podcast.

    Caramanolis: Mitch, thank you so much. It’s such an honor to be on the podcast. I had a lot of fun.

    Ashley: Well, I did too and I’m honored to have you on here too. You’ve listened to another DevOps Chat podcast. I’d like to thank my guest, Constance Caramanolis, software engineer at Omnition and thank you too, of course, our listeners for joining us. This is Mitch Ashley with devopsy.kinsta.cloud. You’ve listened to another DevOps Chat podcast. Be careful out there.

    — Mitchell Ashley

  • Kubernetes and Service Mesh With StackRox

    Kubernetes and Service Mesh With StackRox

    DevOps and Kubernetes enable organizations to “go with security,” adding security to the code instead of on top of it. In other words, security is built-in rather than bolted on.

    This is one of the aspects of security in the DevOps world with a Kubernetes system that Ali Golshan, co-founder and CTO of StackRox, explained during this exclusive interview with Alan Shimel, Media Ops CEO and editor in chief. The other aspect is security has become continuous instead of snapshots, which provides “a lot more visibility into various stages, various deployments, as well as running environments,” he said.

    During the interview, he explored containers, orchestrations, Kubernetes and service mesh.

    “Leveraging this cloud-native infrastructure, Kube and service mesh the right way reduces your dependency on third-party tools, allows you to hand off things you typically handed off to vendors and does that inside your infrastructure, which makes it actually more secure and highly scalable,” said Golshan. “You can automate that and reduce your lock-in and your sort of dependency.”

    Check out the interview below to learn more about the best and emerging practices in Kubernetes, service mesh and the security feedback loop.

    — Veronica Haggar

  • DevOps Chat: Splunk Moves Into Microservices With Omnition Buy

    DevOps Chat: Splunk Moves Into Microservices With Omnition Buy

    Swiftly after announcing its acquisition of SignalFx, Splunk is vaulting into microservices tracing by announcing its intention to acquire Omnition. Tech companies are rapidly making acquisitions to strengthen their position in the DevOps and contemporary cloud-native software stack.

    Rick Fitz, SVP and GM of Splunk’s IT Markets Group, joins DevOps Chat to share with us the drivers behind Splunk’s move into microservices and service mesh tracing. Information about Omnition is in short supply as Omnition’s been in stealth, racing to develop a product to address the observability needs of DevOps teams. Omnition has received some notice through its contributions to OpenCensus open source, now being merged into OpenTracing.

    In addition to this episode of DevOps Chat, check out Mike Vizard’s article about the Omnition announcement.

    As usual, the streaming audio is immediately below, followed by the transcript of our conversation.

    Transcript

    Mitch Ashley: Hi, everyone, this is Mitch Ashley with devopsy.kinsta.cloud and you’re listening to another DevOps Chat podcast. Today, I’m joined by Rick Fitz, SVP and GM of the IT Markets Group at Splunk. And tailoring onto some recent news, the topic is about Splunk’s intention to acquire Omnition. They announced that on September 4th. Rick, welcome to DevOps Chat.

    Rick Fitz: Thanks, Mitch. Happy to be here.

    Ashley: Great to have you on. Would you start just by introducing yourself, tell us a little bit about what you do? And I’m sure most people know Splunk, but maybe a sentence or two about Splunk.

    Fitz:  Sure. A little bit about me, I’ve been building commercial software my entire career, and started out as a developer working for companies that were development oriented, and then the last 15 or 20 years, I’ve been working on just developing software for IT operations and application development teams in a commercial fashion.

    And in my new role now, I’m here as a General Manager, so I’m an executive here at Splunk, responsible for our strategy and vision of what we’re doing in the company. For those who don’t know Splunk—shame on you, darn it.

    Ashley: [Laughter]

    Fitz:  [Laughter] But let me tell you a little bit about the company. We are the company that actually built and invented, if you will, the ability to index logs at scale. And it made it really easy for the IT practitioners of the world to search that data and find, through an investigative lens, find the actual answer to those murky problems that are always out there. And so, the company is roughly 5,000 employees now, and growing very rapidly. So, we’re headquartered in California.

    Ashley: Well, just a little bit of trivia. I can’t claim credit for this, but I came across Splunk in probably 2006 or so at, I think it was an RSA conference. Tiny little booth, great ideas. Like, this is a cool idea. And of course, the company’s done really well, and I later became a customer of Splunk. So, congratulations on all the success and glad to see that you’re there, too, of course. Well, let’s talk—

    Fitz: Well, I thank you for being a customer.

    Ashley: Oh, absolutely, absolutely. [Laughter] So, let’s talk about Omnition. A lot of people may not know about them. Maybe they do, if they’re open in the—or involved in the OpenCensus, OpenTracing, OpenTelemetry projects, if I can say that right.

    Fitz: Mm-hmm.

    Ashley: They may know them from that, but they’re in ________ so there hasn’t been too much about Omnition. Tell us about that company.

    Fitz: Yeah. The—first, I’ll back up a little bit and kind of let you know why we even picked up a company called Omnition that no one really knows about. [Laughter]

    Ashley: Sure, that’s a good question, too.

    Fitz: The reality is that, in these large, cloud native worlds that a lot of us are starting to develop in, all kinds of things are changing. The things that we build on, the infrastructure we build on, the compute surface, the storage surface, there’s all these things that are now services that are available to us to leverage as application developers.

    And the other thing that’s changing pretty dramatically is just the way we actually build applications. The way we try to attempt to continuously integrate them, continuously deliver them. And perhaps one of the most profound things that’s occurred is that developers are now being asked to kinda own their code and they’re being asked to be on call or being asked to resolve issues.

    And so, if you will, they’re starting to become, as your website suggests, DevOps professionals.

    Ashley: A la DevOps.

    Fitz: Yeah. [Laughter] These trends start to kind of cause a paradigm shift—well, they have, actually, created a paradigm shift in the way you monitor. So much so that, probably over the last couple of years, DevOps practitioners have been talking about monitoring as—they’ve labeled it as a new world called observability.

    Ashley: Mm-hmm.

    Fitz: You know, I’ve been here around enough to know it’s simply monitoring. But I think what they’re trying to point out is that you need to observe the behavior of the data from the systems in order to make your lives easier. And that data comes in the form of logs, which is what Splunk has been known for a long time. It comes in the form of digital exhaust coming from monitoring tools in the form of metrics, which is really important.

    And then the last thing—and if you’re an application developer, I think we can all kinda relate to this—is the traces, the traces that actually come from the application code itself being executed are really great uses of good information.

    But all three of those things combined, the logs tell you kinda the root cause, the metrics tell you kind of what’s going on—is there a measurement that’s out of whack? Do I need to do something proactively to cause something to remove an error?

    And then the traces are really good for that logical layer—that logical layer telling you where to look. Do I have a backing problem? Do I have a code problem? Is it my problem, or is it a front end problem? And that kind of isolation is really important to trace it.

    So, that leads me to answer your question is that, you know, Omnition. Omnition was actually founded in 2018. The team is very small. They were in stealth mode, meaning they were building an application that was focused on tracing, and very specifically, they had a couple tenets in mind when they wanted to do this. They wanted to leverage open source. So, you mentioned that they’re big open source contributors, specifically to the OpenTelemetry project.

    And the other thing that they wanted to do is, they wanted to build this logical topology model that would allow you as a practitioner to isolate where a problem resides. And that was a pretty—it is a pretty novel way of looking at this particular problem. And it’s important, because having a thousand traces isn’t terribly intuitive or useful for a developer.

    Ashley: [Laughter]

    Fitz: But being able to isolate that it’s a front end problem so I can go talk to the guys that are in charge of that—or maybe it’s my logic that’s causing it, but maybe it’s a network issue, firewall issue or something like that. Or maybe it’s outside my firewall and I’m dealing with some latency issues from the world around us.

    Ashley: Mm-hmm.

    Fitz: But you need to be able to isolate that problem so you can solve it. So, long winded answer is, these guys, this team really figured out how to build this logical topology sitting on top of this trace data, leveraging open source—so, pretty darn powerful.

    Ashley: What I was really excited about with this announcement is, one of the things that I talk with companies about and work with them oftentimes is what DevOps, in this fundamental way that we’re creating more cloud native applications, how this really changed the way organizations work as well as how we create software, which I know you speak a lot about.

    And in some ways, what we’re doing is through this kinda granularization of functionality into containers, microservices, mesh—service mesh—it’s very interesting, because you can do lots of great things with it. But it makes the complexity of operating and monitoring—as you say, observability—even more difficult. So, that’s created this whole new cottage area, if you will, which is what Omnition went about, and actually some of the, they’ve had some developers who came over from Lyft, I think, went over to Omnition to help solve this problem.

    So, it’s fascinating to me to see Splunk bring this, this quickly, into your kinda product portfolio of companies, or at least that’s what we expect to happen with the acquisition, that you’re jumping right into service mesh, microservices, and observability, the monitoring of that. So, it seems like it’s a natural fit—maybe, you know, sooner than I expected it to happen, actually.

    Fitz: Here’s what’s interesting. I mean, we have the luxury of a lot of—you know, being around for a while and talking to a lot of our large enterprise customers that are going through this digital experience. You know, they’ve done their lift and shift, they’ve moved to kinda the lift, shift, and augment, and now they’re building a whole new series of cloud native digital services. So, they’re building in this new cloud native way. And when you start to talk to them, they recognize the problems, and they realize there has to be a way of doing this.

    And what we’ve found was, a number of them were trying to build it on their own, or they cobbled together a prototype that actually would kind of get ‘em there, give them some visibility. And then having a lot of those customers kind of advise us—because they’re very large customers at Splunk because of the fact that logs are a critical component of this strategy. But they were building the rest on the side, and in some cases, you know, using other companies to try to do it.

    And we just quickly realized that this is an opportunity for some of our largest customers, for us to come in and help them with this very critical issue and build alongside them as we move forward.

    So, yeah, we recognize that certainly the tracing part of this world is pretty new, but we think it’s the right approach, it’s the right answer to a long-standing problem, and I think the application architectures are at a stage in this cloud native world where this is perhaps the only way that this is gonna be accomplished. So, that’s why it was so strategic for us to do this.

    Ashley: You know, like, observability kind of being replaced for the term monitoring, tracing is also used—you used the word “also”—as kind of a new term in this service mesh, microservice world. Does it have a fundamentally different meaning to you as to what log analysis and things like that—is it substantially different or is it just an extension of what we’ve been doing in a non-container, non-microservice world?

    Fitz: Well, the only analogy is, it tends to be text, [Laughter] and you have to put it somewhere. And actually, some of our customers were putting it in the log and then extracting it, but that’s useful if you’re looking for one specific trace, but if you can imagine some of these applications are throwing up hundreds of thousands of traces a second, and sifting through that, while you can search through it, it’s great, but you really do need some analytics on top of it to organize it in a way that creates useful information. And that, I think, is again what Omnition has done.

    You know, answering the question, “Is this different from the old approach?” You know, I had the opportunity to work with an early Wily team. They had been acquired by CA Technologies, and I got to work with the team, which is an APM company. And the team actually invented bicode instrumentation, which is a way of doing instrumentation of the application on the fly. And it was very novel, because at the time, the operations teams were responsible for monitoring and the developers weren’t. So, the only way they could get their developer team to get visibility into the application—because they couldn’t tell their developers to actually put stuff into the logs.

    Ashley: Mm-hmm.

    Fitz: Well, they could ask. [Laughter]

    Ashley: [Laughter]

    Fitz: But they just couldn’t demand.

    Ashley: They might have ________.

    Fitz: Exactly. [Laughter] You know, us developers, how we are. And so the funny, interesting thing about that is, we tended to sell to the operations teams, so they could get that visibility into their application. In the open tracing world, because the onus, and it gets back to this DevOps ________, the onus is actually upon either an SRE function or, if you will, a DevOps function to establish the standards and policies. Those policies have been enforced by that team, and therefore, the developers, before they can actually bring product into production or bring code into production, there’s ________. And now, all of a sudden, you’re getting a lot more visibility and a lot more fidelity inside the code by that enforcement.

    And then, of course, open tracing is now on to its own standard, so you’ve got a standard to kinda drive. Before, there was no real standard, so you were just putting stuff into a log. And therefore, it’s hard for a vendor to look at it and develop an application to give you visibility into it.

    So, that’s definitely some of the big shifts that have caused this new paradigm to actually emerge, which is pretty awesome.

    Ashley: I think I saw in a blog post either on your site or Omnition’s that their investment and contributions to OpenTracing is something you’re likely to continue and support and want that to continue, is that correct?

    Fitz: Oh, absolutely. Absolutely. We’ve actually been, at Splunk, probably for the last four or five years, pretty definitely contributing to open source more, leveraging open source. We’ve been kind of on that bandwagon for quite some time. But this one, it makes a ton of sense. Both the OpenCensus and OpenTracing have now converged into OpenTelemetry. It makes a lot of sense. And I think that this is definitely where the world is—where it’s headed. I think it’s long overdue, actually. [Laughter] I’m glad to see these things kinda moving forward.

    Ashley: Given the players involved, I think if I recall right, OpenCensus was started by Google, but quickly followed by Microsoft and Dynatrace and Omnition—

    Fitz: Yeah.

    Ashley: – I think was part of this effort, too. So, it’s got some important names behind it.

    Fitz: Yeah, and most of the monitoring companies out there that are touching on applications are participating. So, I firmly believe it will take on as a standard. I think that’s pretty clear.

    Ashley: As you were considering an acquisition like Omnition, what were you hearing from your customers that led you to say, “We need to go find a company” or, “We found somebody like this. This would be a great fit for some of the problems and needs requirements that’s awesome we’re hearing from customers”? What was it that’s behind that, what you’re hearing from customers?

    Fitz: Well, there’s the big part of kind of the equation was this idea that we can use OpenTelemetry and spit this data into a log. But that’s good. I mean, that’s a great first step. I can search for something and that’s a fantastic, great step.

     But very quickly, the customers that we were dealing with at scale, they were saying, “You know, what’s interesting is that all this data—I have the data, but I can’t find any useful information out of the data, you know? I’m struggling with that.” And so, you know, we were in there building, on top of Splunk, the ability to model it and do different things. And we realized there’s the answer. The answer is to develop some form of analytics on top of this big, rich set of data that provides you really useful insight.

    And then, from my APM experience and FHIR experience, you know, the whole idea was having kind of a logical topology that represents the application, and I mentioned some of those words meaning back ends and front ends on the application itself. So, once you have that meta model in your mind and can decorate it with trace information, it becomes incredibly powerful. And that’s—when I broach the subject with our customer and said, “Is that really what you’re looking for?” they said yes.

    And so, we’re surveying the market and seeing is there anything out there, and then Omnition popped up, and it was like—wow, it’s a good day. [Laughter] It’s a perfect day for us, because we would’ve had to build this, and I think this team, with the expertise they have and the smarts they have is gonna be a welcome addition to the team and help us do it for us.

    Ashley: They do. They do have some great people. Now, Omnition, as I understand it, they describe themselves as a SaaS company. I assume this is a SaaS service that they’ve been building. Is it something new for Splunk in terms of a SaaS offering, or does this fit in well with other things that you’re doing?

    Fitz: No, it fits in very well. You know, SaaS grows from a business perspective as a very high growth business for us. We tend to, because data has gravity, [Laughter] we tend to have our software where the data resides. But more of that data is starting to reside in the cloud, so you know you’re starting to see people, as I mentioned, lift and shift or lift and shift and augment or building kind of in a cloud native way.

    So, we’re definitely—we’re part of that trend as well, and we think it’s the smart thing for all of us to get there. So, yeah, we are definitely gonna be SaaS on this particular offer, for sure.

    Ashley: Well, that makes sense, too, doing cloud native if you’re doing microservices, service mesh—more than likely, that’s gonna be stuff in the cloud. So, having Omnition there as well, that seems like the place to be, the right place to be.

    Fitz: Yeah. You know, it’s interesting, I was telling some sales reps yesterday, we were talking and I said, “You know, I contrast the conversation that I had with somebody who owns the data center with somebody who’s working in a cloud native way, and the vocabulary is completely different.” [Laughter] You know?

    Ashley: [Laughter]

    Fitz: Nobody says on premise or cloud—they just don’t think that way. They just assume that it is all cloud, you know? Whereas if you talk to somebody that’s still in a data center, they wanna know where the data is, where do I stack it, where do I rack it, where do I plug it in?

    And so, there’s definitely a difference in that cloud native world, the way people think.

    Ashley: Well, I’ve often had to believe, maybe learned over time, is that you can tell who drew the picture of a diagram on the whiteboard. Whatever is at the center is the data—if it’s the data center people who drew it, if it’s the cloud, it’s the cloud people.

    Fitz: Yeah.

    Ashley: But it’s interesting the transition we’re making with multiple companies investing in cloud management platforms, even down to storage providers and VMware and others. You know, I think eventually we’ll stop talking about hybrid. Everything’s a cloud, whether it’s just in your cloud or somebody else’s cloud and it’ll be managed much the same way. That’s where we’re headed, anyway.

    Fitz: Yeah, and I kinda share that point of view. I think, organizationally, we have to kind of force some of that standardization of vocabulary just to make our lives work. [Laughter] I think it’s gonna get—

    Ashley: Well, it’s also—yeah. [Laughter] I also think you have to do it from a cost standpoint, right? Complexity, managing a physical data center one way and then all these different clouds a different way. So, anyway, a whole ‘nother topic for another time.

    Fitz: Yeah.

    Ashley: We have just a little bit of time left—is there any message that you wanna make sure that gets out to listeners, to customers, future customers about the path that Omnition sets you down or other things about this pending acquisition that we wanna make sure folks know?

    Fitz: Yeah, let me just kinda share a couple things. One is, as I opened with, I think this world of observability is certainly all about having logs as well as metrics as well as traces. Just a couple weeks ago, we actually also announced our intent to acquire SignalFx, so we’re bringing in some of that metric capability. We’ve been known for years to be the log company, and then of course, Omnition is helping us with our tracing capability.

    And so, I think the combo is gonna be pretty darn powerful. I’d encourage your listeners, if they get a chance, if they wanna join us in Las Vegas this year at our .conf, which is our conference. We’ll be talking a lot about what we’re doing there and getting everybody up to speed. And if you can’t attend, all that stuff is posted online, too. You can check us out there, as well.

    Ashley: Yeah, there are definitely some great videos out there, too. Well, I wish you all the best with the acquisition and future business with Splunk. I just want to say thank you—Splunk is a great product, and when I had the opportunity to introduce it in organizations that I was running, all positives. So, it made a big difference in our world, and I think your move into observability around microservices, et cetera, is fantastic, and we appreciate you taking those steps.

    Fitz: Well, thank you. Thank you, Mitch, and thank you to all the listeners for your kind words. I’m sure you’re gonna share with me online later on.

    Ashley: Well, thank you, Rick—Rick Fitz, SAP and GM of the IT Markets Group at Splunk for joining us on the podcast today. And, of course, I’d like to thank you, our listeners, for joining us as well. This is Mitch Ashley with devopsy.kinsta.cloud, and you’ve listened to another DevOps Chat. Be careful out there.

    — Mitchell Ashley

  • Kubernetes Adoption: Are You Ready?

    Kubernetes Adoption: Are You Ready?

    Enterprises are rapidly embracing a cloud-first strategy and microservices play a pivotal role in this journey. But enterprises are achieving various levels of success, measured by many factors includingmaturity of DevOps in the enterprise, ability to identify the right candidates for microservices, selecting the appropriate container management platform, adequate tooling and, finally, cultural shift in design thinking.

    As there is plenty of material around microservices adoption and strategy, this article focuses on the container management ecosystem, which plays a critical role in the success of microservices adoption. Today, Kubernetes has become the de facto platform for container orchestration. Most public cloud providers offer Kubernetes as a service in some form to abstract the complexities of managing Kubernetes as a platform.

    Currently, we see three broad patterns of how enterprises are adopting Kubernetes within their organizations.

    Pattern 1: Kubernetes as a Managed Service

    While Kubernetes makes container management somewhat simple, it is still a complex beast to understand and manage as a platform. Enterprises that have already embarked on a cloud strategy find it easy to test the unchartered waters of Kubernetes by leveraging Kubernetes-as-a-service provided by their cloud providers. It enables them to understand the impact of Kubernetes on their respective application architecture strategy and identify the gaps in their systems (such as the maturity of DevOps management, security management and release management) as well as their monitoring capabilities.

    Pattern 2: Kubernetes as a Turnkey Solution

    Certain enterprises driven by industry regulations and are technology-focused (with considerable experience in other container technology solutions), have shown interest in setting up Kubernetes as part of a private cloud or on–premises with a view to avoid vendor lock-in and limited control associated with managed Kubernetes. There are many such turnkey solutions out there to choose from.

    Pattern 3: Self-hosted Kubernetes Platform

    This category is small compared to the other two categories. However, there are a few enterprises that fully embrace the open source software development model and contribute to Kubernetes community. There are tools and frameworks that can enable the enterprises to setup and manage Kubernetes on their own.

    There are advantages and constraints in adopting any of the above approaches. The decision regarding which strategy to choose depends on the maturity of the enterprise and their business strategy.

    Challenges in Adoption

    Some of the key challenges to be considered, irrespective of the adoption pattern selected, include:

    1. Namespace management: Namespaces play a key role in managing the isolation across application domains and environments, providing controlled management of resources and user management. Bounded contexts can be linked with namespace definitions and standards. It is important to define proper naming guidelines to drive namespace management across clusters.
    2. Resource management: It is necessary to define resource utilization (resource quota) guidelines to ensure the containerized applications co-exist without being eliminated due to resource violations at runtime.
    3. Policy management: It is critical to define appropriate policies including cluster access controls, service access controls, resource utilization controls and secret access controls.
    4. Audit and compliance: It is important to audit the platform for patch levels, secret stores, compliance against the security vulnerabilities, encryption of secret stores, storage volumes, cluster policies, role binding policies and user management controls.
    5. Chaos testing your platform: It is necessary to subject the platform to chaos testing to ensure the robustness of the cluster. It also helps to test the stability of the containerized applications and the impact of crashing these containers. It will also provide vital information about how the platform behaves during high loads or when resources are unavailable for the platform.
    6. Managing the deployment manifests: Kubernetes follows declaration-based management, which means that every object or resource instruction is described through declarative manifests. This leads to versioning complexities, prone to human errors and data corruptions. It is necessary to leverage tools or create custom utilities to manage these manifests.
    7. Observability of the platform: While Kubernetes provides various mechanisms to monitor its own internal components, it does not recommend a standard monitoring approach. It is necessary to introduce well-defined health management standards while designing the microservices. Include appropriate probes for liveness and readiness probes in every containerized application deployed on Kubernetes cluster. Integrate the probe-generated metrics and platform-generated metrics with an external monitoring platform to have comprehensive observability of the cluster.
    8. Continuous deployment of services: It is not recommended to use kubectl-based deployments in a large-scale production setup. Instead, use some of the established open source frameworks specifically built for Kubernetes (such as Helm or JenkinsX) to manage seamless deployments.
    9. Archiving and backup: Kubernetes uses etcd as its internal metadata management store to manage the objects across clusters. It is necessary to define a backup strategy for etcd and any other dependent persistent stores used within the Kubernetes clusters.
    10. Container security management: Kubernetes deploys the applications by downloading the respective images from a pre-defined image repository. It is the responsibility of the repository ecosystem to ensure the image provenance of the images being deployed. Continuous security must be included as part of DevOps pipeline to ensure containers are well-managed.
    11. Service mesh support: Service mesh plays a critical role in streamlining the service to service communication. It abstracts the service level access controls and security management between services through externalized policies. It also provides routing and load balancing features. It is necessary to choose an appropriate service mesh that is compatible with the Kubernetes cluster as well as the underlying infrastructure.

    Conclusion

    Kubernetes makes the container operational aspects simpler, but it requires a methodical approach and best practices to ensure smooth maintainability, as well as seamless developer interaction. For any enterprise which are in a transition journey toward adopting Kubernetes, it is imperative to have a strategy for Kubernetes adoption to ensure success.

    — Sreekanth Nyamars

  • Hooked on Service Metrics

    Hooked on Service Metrics

    We live in an increasingly “as-a-service” world. From software as a service (SaaS) and platform as a service (PaaS) to functions as a service (FaaS) and SaaS-delivered applications, service delivery has become paramount to business goals and practices.

    In today’s DevOps landscape, microservices—the cloud-native approach to designing scalable, independently delivered services—allow teams to prioritize each individual service rather than many services simultaneously, enabling agility and continuous delivery. However, even with all their benefits, microservices come with their fair share of challenges, specifically with observability, monitoring and security. Service metrics are therefore more important now than ever before, as mitigating the challenges and seizing the opportunities introduced by microservices helps DevOps teams create a high-quality end user experience.

    With service delivery so integrated into the overall business and customer experience, it’s crucial to ensure that service performance always remains at its peak. How can tech pros ensure that service-level agreements are met, services run smoothly and end user expectations are met and exceeded? The answer is simple: become hooked on service metrics.

    Getting Hooked

    In this piece, we’ll explore service metrics in respect to microservices. Due to the observability, monitoring and security challenges that microservices can introduce, managing and controlling microservices and their traffic requires an additional layer of tooling: a service mesh. Implementing a service mesh architecture helps facilitate traffic management, service identity and security, policy enforcement and more, which ultimately brings reliability, security and manageability to container and microservice management. Important metrics such as request volume, request duration, latency and request size can be gathered automatically across a service mesh, which helps facilitate successful microservice deployment.

    However, despite service mesh tooling helping to mitigate risks, failures such as RPC timeouts and exception propagation can occur. Failures in the microservices space often occur during the interactions between services, so a clear view into those transactions enables DevOps teams to better manage architectures and avoid said failures. A service mesh provides observability, which enables DevOps teams to easily see what is happening when services interact with each other, making it easier to build a more resilient, secure and efficient microservice system. Additionally, service meshes provide a developer-driven, services-first network—a network that runs without application developers having to build network concerns into their application codes. Service meshes create a network that empowers operators with the ability to define network behavior, node identity and traffic flow through policy.

    Tips for Success: What You Need to Know

    So, how does a DevOps team implement a service mesh architecture for service metrics? Following a few best practices can help ensure success:

    • Know When to Implement: If a DevOps team does not plan to run an excess of microservices, a service mesh may not be necessary; fewer than 10 microservices likely could be managed with existing tools and security tools. But once a team starts running more than 10, a service mesh becomes essential.
    • Understand Your Use Case: After confirming the necessity of a service mesh architecture, you must understand how it will interact with the other types of infrastructure you’re running, as this will help determine what service mesh to leverage. For example, some work well with Kubernetes or Docker Swarm, but if you’re not running services inside containers, you would only benefit from the security or observability pieces of a service mesh. Depending on your use case, you might want to implement a highly capable service mesh such as Istio or a simpler tooling such as Linkerd 2.0.
    • Focus on the Network: With a service mesh architecture, you have several microservices that are communicating over a new network. As such, it’s important to understand the network’s criticality: What would you want out of a network that connects your microservices? You want your network to be as intelligent and resilient as possible; to route traffic away from failures to increase the aggregate reliability of your cluster; and to avoid unwanted overhead such as high-latency routes or servers with cold caches. You want your network to ensure that the traffic flowing between services is secure against trivial attack. And you want your network to provide insight by highlighting unexpected dependencies and root causes of service communication failure.

    Conclusion

    Becoming hooked on service metrics is key to ensuring successful delivery of services and meeting end user experiences. With the value service delivers to a business, it’s crucial to ensure that services are always running at their prime. For microservices, implementing a service mesh architecture and following corresponding best practices help ensure successful service delivery.

    — Adam Hert

  • Kong Inc. Defines Services-Centric Approach to Integration

    Kong Inc. Defines Services-Centric Approach to Integration

    Kong Inc. has released a feature-complete version of its namesake services broker for legacy and microservices-based applications that promises to eliminate the need for legacy application programming interface (API) management platforms.

    Company CTO Marco Palladino said traditional API management platforms, for all intents and purposes, are now dead. Formerly known as Mashape, the core technology developed by Kong Inc. has been widely employed to manage APIs. But the time has come to focus on managing services at a much higher level, he said.

    Despite Kong having been downloaded more than 45 million times, the latest version is being labeled a 1.0 release because the open source service broker has now been deemed to be feature-complete, which includes support for service mesh patterns, Kubernetes Ingress controller and backward application programming interface (API) compatibility to future releases, Palladino said.

    Kong is being positioned as a microservices API gateway capable of supporting sub-millisecond response times in a way that would not be possible to achieve using legacy API management platforms that reside in the cloud or in a local data center. Kong can be deployed on-premises or in public clouds based on virtual machines, Kubernetes or bare-metal servers. That approach makes it possible to employ Kong to manage services regardless of where they run. Kong has also developed a “Kong Brain” function that employs machine learning algorithms to optimize the flow of data traffic between services that has increased dramatically in the last few years, Palladino said.

    Palladino noted that while service meshes exist specifically for Kubernetes clusters, most enterprise IT organizations will require an approach to managing services across legacy monolithic applications and emerging microservices-based applications that are based on multiple types of runtime environments and serverless computing frameworks. Over time, Kong will integrate with various platform-specific service meshes as they emerge to further enable a more comprehensive approach to services lifecycle management, he said, adding that Kong automatically configures itself to serve traffic to new applications as they are deployed and new services are created.

    In addition, organizations can migrate from one service to another based on a different databases schema without incurring any downtime.

    When it comes to managing services, Palladino said there’s still too much focus on tribes that have emerged around specific platforms that wind up polarizing the IT industry. IT organizations clearly need a means to broker services regardless of where they run or might have originated, he said, noting API management could be viewed as a stepping stone toward achieving that goal.

    It’s not clear yet whether legacy approaches to API management are truly dead or simply in the process of transforming into a means for managing services at higher levels of abstraction. Regardless of the outcome, it’s clear that a less brittle approach to managing integration in the age of microservices will be required. Many forget, however, that in most cases a monolithic application is now just another type of service.

    — Mike Vizard

  • Enabling the Financial Services Shift to Microservices

    Enabling the Financial Services Shift to Microservices

    The financial services industry historically has been riddled with barriers to entry. Challengers found it difficult to break through low margins and tightening regulations. However, large enterprises that once dominated the market are now facing disruption from smaller, leaner fintech companies that are eating away at the value chain. These disruptors are marked by technological agility, specialization and customer-centric UX.

    To remain competitive, financial services firms are reconsidering their cumbersome technical architectures and transforming them into something more adaptable. A recent survey of financial institutions found that about 85 percent consider their core technology to be too rigid and slow. Consequently, about 80 percent are expected to replace their core banking systems within the next five years.

    Emerging regulations meant to address the new digital payment economy, such as PSD2 regulations in Europe, will require banks to adopt a new way to operate and deliver. Changes such as PSD2 are aimed at bringing banking into the open API economy, driving interoperability and integration through open standards. To become a first-class player in this new world of APIs, integration and open data, financial services firms will need the advantages provided by microservices.

    Microservices’ 3 Key Advantages for Financial Services

    Enhanced Security

    Modern fintech requirements create challenges to the established security infrastructure. Features such as digital wallet, robo-advising and blockchain mandate the need for a new security mechanisms. Microservices follow a best practice of creating a separate identity service to address these new requirements.

    Faster Delivery

    Rapidly bringing new features to market is a cornerstone of successful fintech companies. Microservices make it easier for different application teams to deliver new functionality independently to meet emerging customer demands. Microservices also scale well to accommodate greater numbers of users and transactions.

    Seamless Integration

    The integration layer in a modern fintech solution needs a powerful set of APIs to communicate with other services, both internally and externally. This API layer is notoriously challenging to manage in a large monolithic application. Microservices make the API layer much easier to manage and secure through isolation, scalability and resilience.

    Service Mesh: Simplyfing Management of Complex Microservice Architectures

    In the face of rapidly changing customer, business and regulatory requirements, microservices help financial services companies quickly respond to these changes. But this doesn’t come for free; companies take on increased operational overhead during the shift to microservices. Technologies such as a service mesh can help manage that.

    Service mesh provides a bundle of features around observability, security and control that are crucial to managing microservices at scale. Previously, existing solutions such as DNS and configuration management provided some capabilities such as service discovery, but didn’t provide fast retries, load balancing, tracing and health monitoring. The old approach to managing microservices requires that cobbling together several different solutions each time a problem arises, but a service mesh bundles it all together in a reusable package. While it’s possible to accomplish some of what a service mesh manages with individual tools and processes, it’s manual and time-consuming.

    Competition from innovative fintech startups, along with ever-increasing customer expectations means established financial services players must change the way they deliver offerings and do business with their customers. Delivering on these new requirements is difficult with legacy systems. Financial services firms need a software architecture that’s fit for purpose—agile, adaptable, highly scalable, reliable and robust. Microservices make this possible, and a service mesh makes microservices manageable at scale.

    — Zach Jory

  • How Service Mesh Addresses 3 Key Microservices Challenges

    How Service Mesh Addresses 3 Key Microservices Challenges

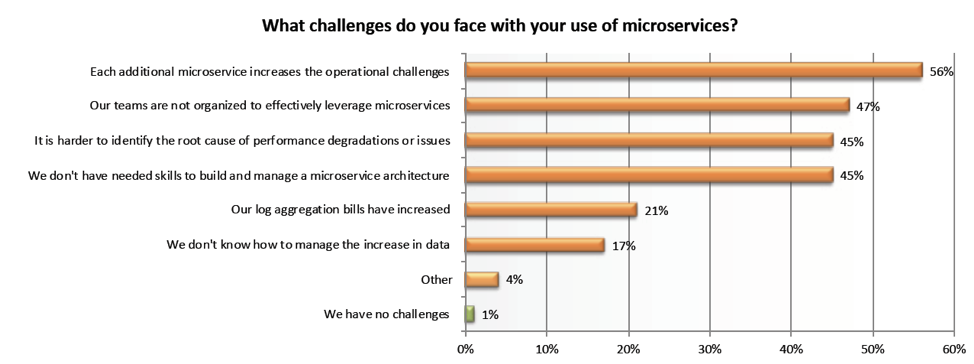
    I was recently reading the “Global Microservices Trends” report by Dimensional Research and found myself thinking, “A service mesh could help with that.” Let’s look at three key challenges listed in the report.

    A couple key points in the report make it clear microservices are seeing widespread adoption. It’s also clear that along with the myriad benefits they bring, there are also tough challenges that come as part of the package. From the report:

    • 91 percent of enterprises are using microservices or have plans to.
    • 99 percent of users report challenges with using microservices.

    Major Microservices Challenges

    The report identifies a range of challenges companies are facing.

    Companies are seeing a mix of technology and organizational challenges. We’ll focus on the technological challenges a service mesh solves, but it’s worth noting that one thing a service mesh does is bring uniformity so it’s possible to for all teams to have the same view, reducing the need for certain skills.
    Each Additional Microservice Increases the Operational Challenges

    Not with a service mesh! A service mesh provides monitoring, scalability and high availability through APIs instead of using discrete appliances. This flexible framework removes the operational complexity associated with modern applications. Infrastructure services were traditionally implemented as discrete appliances, which meant going to the actual appliance to get the service. Each appliance is unique, which makes monitoring, scaling and providing high availability difficult. A service mesh delivers these services inside the compute cluster itself through APIs and doesn’t require any additional appliances. Implementing a service mesh means adding new microservices without adding complexity.

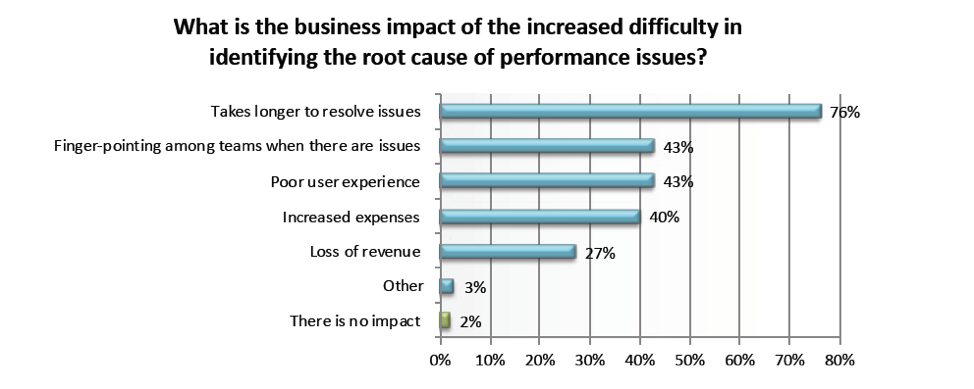
    It is More Difficult to Identify the Root Cause of Performance Issues

    The service mesh toolbox gives you a couple of things that help solve this problem:

    Distributed Tracing: Tracing provides service dependency analysis for different microservices and tracking for requests as they are traced through multiple microservices. It’s also a powerful way to identify performance bottlenecks and zoom into a particular request to identify which microservice contributed to the latency of a request or which service created an error.

    Metrics Collection: With service mesh you also get the ability to collect consistent metrics across your mesh. Metrics are key to understanding what has happened in your applications, and when they were healthy compared to when they were not. A service mesh can gather telemetry data from across the mesh and produce consistent metrics for every hop. This makes it easier to quickly solve problems and build more resilient applications.


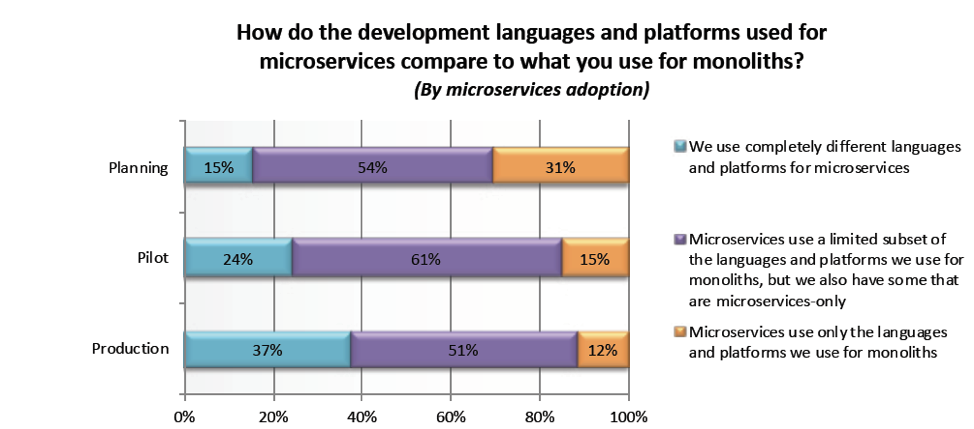
    Differing Development Languages and Frameworks

    Another major challenge that report respondents noted facing was the challenge of maintaining a distributed architecture in a polyglot world. When making the move from monolith to microservices, many companies struggle with the reality that, to make things work, they have to use different languages and tools. Large enterprises can be especially affected by this, as they have many large, distributed teams. Service mesh provides uniformity by providing programming language agnosticism, which addresses inconsistencies in a polyglot world where different teams, each with its own microservice, are likely to be using different programming languages and frameworks. A mesh also provides a uniform, applicationwide point for introducing visibility and control into the application runtime, moving service communication out of the realm of implied infrastructure, to where it can be easily seen, monitored, managed and controlled.

    Microservices are cool, but service mesh makes them ice cold. If you’re on the microservices journey and are finding it difficult to manage the infrastructure challenges, a service mesh may be the right answer. Let me know if you have any questions on how to get the most out of service mesh, I’m happy to talk and you can find me @zjory.

    — Zach Jory