Tom Wilkie, vice president of product for Grafana Labs, said the Grafana OnCall incident management platform is a natural extension of the observability tools the company already provides using the widely employed open source Grafana dashboard. The platform, which is expected to be generally available in 2022, is based on software Grafana Labs gained by acquiring Amixr earlier this year.
Grafana OnCall unifies all the alerts created by Grafana, Prometheus and the Alertmanager tool the Prometheus community created to streamline the number of alerts generated by the platform. The goal is to reduce the alert fatigue a DevOps team might experience when dealing with an IT issue that can be traced back to a single root cause, noted Wilkie.
At the same time, Grafana Labs made Grafana Enterprise Traces available for on-premises IT environments. It is based on Grafana Tempo, a cloud service that makes it possible to store and then analyze distributed traces using inexpensive object storage resources. The latest version of the core open source Tempo project has also been updated to add service graphs and the ability to search recent traces.
Grafana Labs this week also updated Loki, an open source log management platform, to add support for out-of-order log lines, custom log retention policies per log stream and per tenant and a deletion API that makes it easy to scrub log data. Version 2.4 of Loki also adds additional high-availability capabilities.
Other updates to the Grafana Labs platform include support for recorded queries, a set of pre-built dashboards that enable users to quickly drill into their Prometheus metrics data, the ability to consume metrics from the AWS CloudWatch service provided by Amazon Web Services (AWS), improvements to its ability to monitor Kubernetes clusters and updates to the open source load testing tool the company gained by acquiring k6 last year.
Grafana Labs is also committing to expanding its integration with Microsoft Azure cloud service alongside its integrations with AWS, noted Wilkie.
While competition among providers of observability platforms is already fierce, Wilkie said an observability platform based on an open source dashboard that can already collect data from more than 100 sources provides a unique advantage. At the core of the Grafana Labs platform is a centralized framework for collecting data generated primarily by the open source Prometheus monitoring platform being developed under the auspices of the Cloud Native Computing Foundation (CNCF).
While Prometheus is used most often in Kubernetes environments, it is starting to gain traction in monolithic application environments as well; it provides an open source approach to defining a de facto standard for collecting metrics and other data that can be consumed by an observability platform.
It’s not clear yet to what degree IT teams are distinguishing between monitoring and observability. Monitoring focuses on predefined metrics to identify when a specific platform or application is performing within expectations. Observability combines metrics, logs and traces to instrument applications in a way that makes it simpler to troubleshoot issues without relying solely on a limited set of metrics that are pre-defined and monitor a specific process or function.
Regardless of whether IT teams view observability as being distinct from monitoring, it’s clear that the ability to manage IT environments is improving at a rapid rate. The challenge, of course, is the IT environment itself is becoming more complex with each passing day.
During its online GrafanaCONline 2021 conference today, Grafana Labs revealed it has acquired k6, a provider of an open source load testing tool.
Raj Dutt, Grafana Labs CEO, said load testing will complement the observability platform Grafana Labs currently provides based on open source Prometheus software. Most of the output of any load testing processes are typically evaluated using a platform that analyzes metrics, he noted.
The k6 platform has been gaining traction among developers that require access to a tool that makes it simpler to dynamically scale load testing up and down as required versus having to guess how much infrastructure might be required to test an application workload, said Dutt. That capability not only makes it simpler to integrate testing within a DevOps workflow, Dutt added, but also serves to reduce testing costs.
In general, Dutt noted testing is shifting further left as developers assume more responsibility for quality assurance. The challenge is finding a way to enable developers to automatically incorporate testing within a continuous integration (CI) process that allows them to easily observe how synthetic tests are executing, added Dutt.
There’s no doubt developers are running more tests before promoting workloads into a production environment as part of an effort to reduce the number of issues that might be encountered when an application is deployed in a production environment. In many cases, the support calls that arise now go directly to developers who now have a vested interest in reducing the volume of those calls.
The issue that developers are contending with is as they embrace microservices, the dependencies that exist across multiple applications makes it more challenging to successfully deploy those applications. Grafana Labs has been making a case for a cloud platform that makes it simpler to centrally view data collected from instances of Prometheus distributed across multiple application development environments. Prometheus, now being advanced under the auspices of the Cloud Native Computing Foundation (CNCF) that oversees the development of Kubernetes, is now being deployed more widely by IT teams to observe legacy monolithic applications alongside emerging microservices-based applications.
It’s not clear the degree to which organizations are also employing dedicated application testers. In many cases, those testers will surface issues that developers overlooked (or simply chose to ignore) in the face of tight application delivery deadlines.
In the longer term, however, it’s also apparent artificial intelligence (AI) will be playing a larger role in application testing. Someone will still need to review those tests, but many more rote tasks will increasingly be automated.
One way or another, the total cost of testing is declining, thanks in part to increased reliance on open source testing tools that, in many cases, developers are simply downloading themselves. Those tools are reducing much of the licensing friction and cost restrictions that developers might otherwise encounter.
In fact, the easier it becomes to test applications, the better overall application quality will become in the months and years ahead. At at time when organizations have never been more dependent on software, that potential improvement to the overall state of application quality can’t arrive soon enough.
OpsRamp today announced it has added the ability to ingest data captured via the open source Prometheus monitoring software into its namesake IT operations platform infused with machine learning algorithms.
In addition, the company is adding support for customizable dashboards using the Prometheus Query Language to create visualizations of hybrid infrastructure performance. Also, a set of available tools makes it easier for IT teams to discover when workloads have been added to a cloud. These capabilities became available with the Spring 2021 Release of OpsRamp’s IT operations platform infused with artificial intelligence (AIOps).
Finally, OpsRamp has also created an alert definition model that streamlines the alerts generated by the AIOps platform and its integrations for the Microsoft Azure cloud and the Cisco HyperFlex platform deployed in on-premises IT environments.
Deepak Jannu, senior director of product marketing for OpsRamp, said that as IT becomes more complex to manage, many IT teams are starting to realize that managing these environments without help from an AIOps platform won’t be possible. As such, much of the fear and loathing that was initially associated with AIOps is giving way to acceptance as IT teams start to realize these platforms augment their capabilities versus replace them, added Jannu.
Much of the complexity is being driven by the rise of cloud-native, microservices-based applications that tend to have lots of dependencies. OpsRamp has primarily been encountering Prometheus in these environments. However, Prometheus can also collect data from legacy applications, as well, so over time, the expectation is the open source monitoring tool will be employed more widely.
As AIOps platforms become more widely employed, there is no doubt job roles within IT organizations will change. As lower-level tasks become automated, IT teams should have more time to spend resolving complex issues once the AIOps platform has identified a baseline for how applications should optimally behave. In many cases, the need for personnel to perform rote tasks that no one in IT wants to actually do will be eliminated altogether.
DevOps teams that are committed to automating IT tasks will naturally be among the first to employ an AIOps platform to augment the capabilities of site reliability engineers (SREs) that are often challenging to hire and retain.
In general, Jannu noted that the observability that many IT organizations now demand can’t be achieved by simply collecting more metrics. IT organizations will need to invest in an AIOps platform capable of making sense of all the instrumentation data being collected. The challenge now will be defining the right division of labor between man and machine in an IT environment, Jannu added.
At this juncture, AIOps, to one degree or another, is inevitable. In many cases, machine learning algorithms are already being employed to optimize applications or a specific class of hardware. The decision IT teams will ultimately need to make is determining whether to replace their existing IT operations platform or wait for the provider of their existing platform to get around to adding AI capabilities.
Elastic and Grafana Labs have allied to create a plugin through which DevOps teams that are employing Elasticsearch within a DevOps workflow will be able to invoke a monitoring platform, based on Prometheus, that is managed by Grafana Labs.
Raj Dutt, Grafana Labs CEO, said both companies are dedicating engineering resources to building and maintaining a plug-in for a service, based on open source Prometheus software, that is rapidly becoming a de facto standard for observability in DevOps environments. One of the primary reasons for that expanded usage is that Grafana Labs doesn’t require DevOps teams to move data into a central repository to analyze it, Dutt said.
The overall goal is to eliminate the “tunnel vision” that results when relying on tools that only visualizes a narrow set of metrics, Dutt added.
The cloud platform provided by Grafana Labs is based on open source Grafana visualization tools. The primary tool for visualizing Elasticsearch data is based on open source Kibana tools. Grafana, however, is based on a fork of Kibana, so the plug-in represents an effort to bring those two open source communities closer together. The two companies plan to collaborate on including more aggregations, broader query language support and support for space-saving constructs like rollups as the partnership evolves.
Grafana Labs provides a cloud service that aggregates data, pulled from multiple instances of Prometheus, deployed on clusters and servers. Prometheus, especially, gained a lot of traction as organizations began to deploy Kubernetes clusters that are also based on open source software. Both Kubernetes and Prometheus are being developed under the auspices of the Cloud Native Computing Foundation (CNCF).
Once DevOps team initially employ Prometheus to monitor Kubernetes, they frequently expand deployments to monitor additional platforms. That shift has resulted in many providers of proprietary monitoring tools to extend the data they consume to include the metrics captured locally by Prometheus. Grafana Labs claims it has more 1,000 customers, including Bloomberg, JP Morgan Chase, eBay, PayPal and Sony, for a total of more 650,000 active installations of Grafana around the globe. Existing customers of Elastic that are paying for Elasticsearch support include Cisco, eBay, Goldman Sachs, Microsoft, The Mayo Clinic, NASA, The New York Times, Wikipedia and Verizon.
It’s not clear to what degree Grafana and Kibana might ultimately re-converge one day, but it’s clear there will be a fair amount of ongoing cross-pollination across the two projects. In the meantime, DevOps teams should be able to opt for whichever open source visualization framework they prefer alongside Elasticsearch.
In the longer term, it’s clear greater appreciation for observability platforms that provide more context will drive a wave of consolidation among all the monitoring tools that enterprise IT teams rely on today. As part of the transition, enterprise IT teams might even standardize on a set of visualization tools that would eliminate the need to master different user interfaces. After all, the only way to actually achieve observability is through a set of tools that makes surfacing the context required easier to consume.
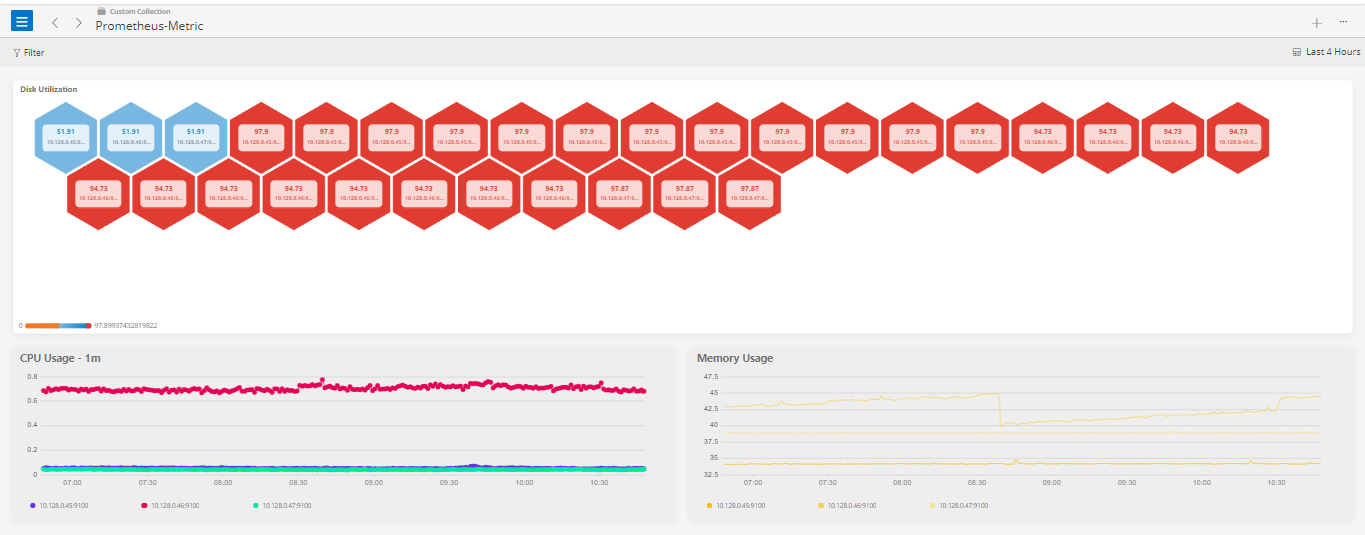
Logz.io announced today the general availability of a cloud service, based on Prometheus, that can collect and analyze metrics alongside its existing log management service.
Jonah Kowall, CTO, Logz.io, said the goal for Prometheus-as-a-Service is to provide IT teams with a centralized approach to analyzing data collected from instances of Prometheus running on local servers and clusters. While Prometheus is relatively easy to deploy, it’s not designed to scale horizontally, which means IT teams have to deploy multiple instances of Prometheus on a fleet of clusters and servers. The Logz.io service makes it easier to aggregate and analyze all the data those instances of Prometheus collected, said Kowall. That approach not only offloads the storage of those metrics, Kowall said, it presents an opportunity to correlate that data against logs and traces that Logz.io already collects.
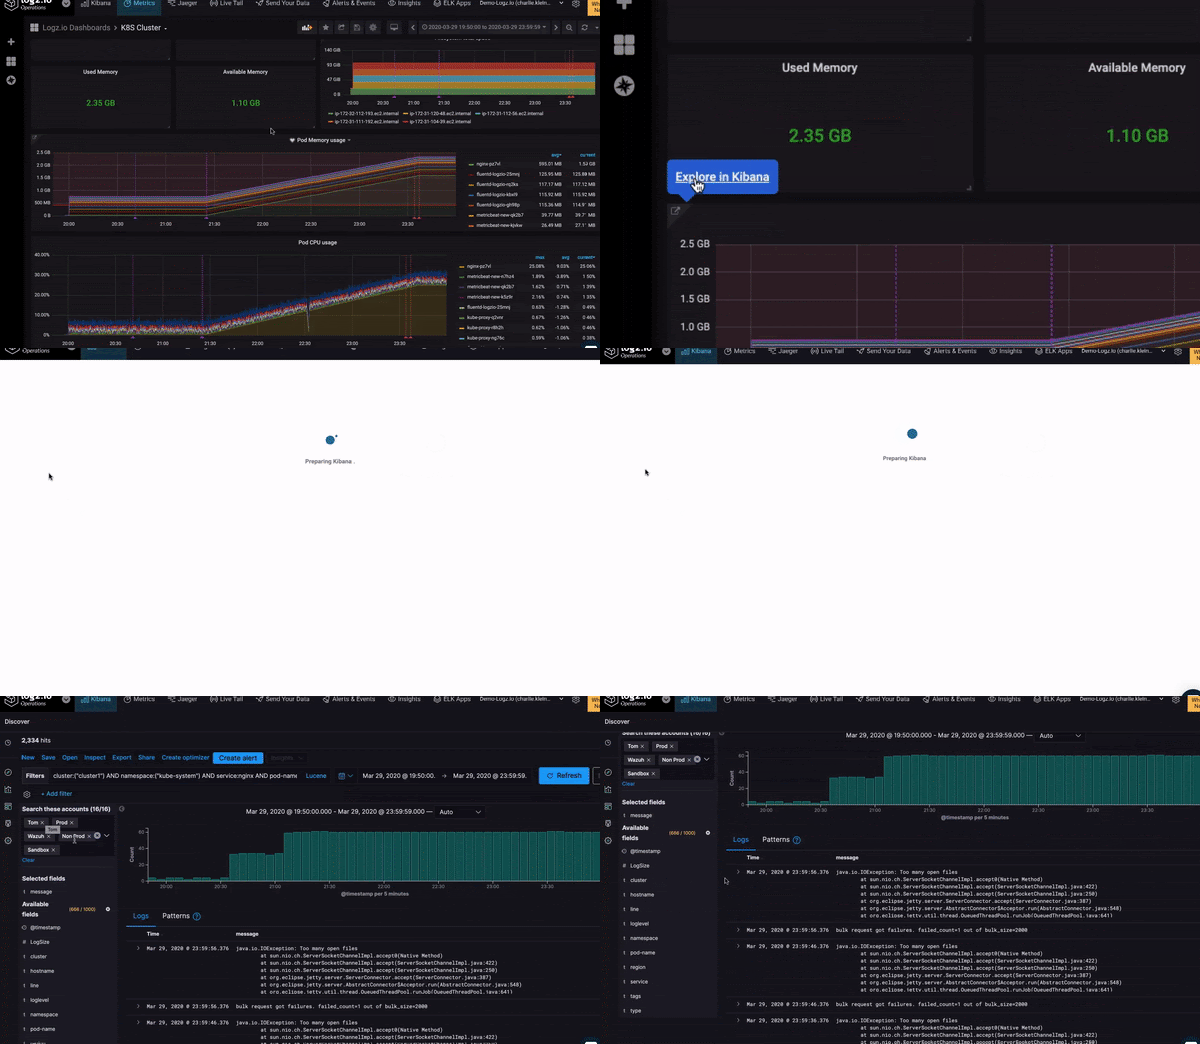
Logz.io, as part of that effort, is also making it possible to upload a Grafana dashboard, typically employed to visualize Prometheus data as a JSON file, to Logz.io, which will then convert the Grafana dashboards to dashboards based on the Logz.io user interface.
While Prometheus is closely identified with Kubernetes, IT teams are starting to deploy the open source monitoring tool more widely to collect metrics. A recent Gartner report predicts that, by 2025, half of new cloud-native application monitoring deployments will rely on some form of open-source software to instrument applications. As part of that transition, Prometheus has already emerged as a de facto standard, Kowall noted.
The primary focus, at least initially, is still on monitoring IT platforms, but as IT teams start to correlate metrics, logs and traces, they begin to benefit from additional context, otherwise known as observability, Kowall said.
Observability, of course, has always been a core DevOps principle. However, as more applications become instrumented using open source tools and agent software, it’s becoming less costly to achieve. DevOps teams will still need to instrument each application, but the costs associated with collecting metrics and other data continues to decline. Most providers of monitoring tools and observability platforms are moving toward adding support for open source tools and agents to collect data alongside the proprietary tools and agent software they already make available. It will be up to each DevOps teams to decide whether to rely on open source tools or continue to rely on proprietary software that may be able to surface deeper insights or is simply easier to deploy.
Regardless of the path chosen, the rise of microservices-based applications with numerous dependencies is forcing the observability issue. Microservices-based applications may not crash as frequently as a monolithic application because they are, ideally, designed to degrade gracefully in the absence of a single point of failure. The challenge is that, once they do degrade, it’s difficult to pinpoint the source of the issue; this may result in applications running sub-optimally for an extend period of time.
The good news is that DevOps teams should now have the tools required to diagnose and resolve those issues long before any end user notices.
Grafana Labs announced today the availability of a unified Grafana Enterprise Stack that enables IT teams to deploy a curated observability platform, based on open source tools such as Prometheus, in their own on-premises IT environment.
Tom Wilkie, vice president of product for Grafana Labs, said Grafana Enterprise Stack, in addition to providing a version of Prometheus optimized for distributed computing environments, includes curated instances of open source Grafana dashboards, Loki log aggregation tools and the Cortex query engine.
Grafana Enterprise Stack also includes plugins for visualizing data from other commercial tools in Grafana, such as Splunk, New Relic, MongoDB, ServiceNow, Oracle and Snowflake. In addition, it includes reporting tools and enhanced authentication and security controls.
Developed under the auspices of the Cloud Native Computing Foundation (CNCF), Prometheus has gained traction as a monitoring platform used primarily in Kubernetes environments. However, Wilkie said it’s only a matter of time before IT organizations expand their use of Prometheus to include a wider range of platforms. The Grafana Enterprise Stack facilitates that transition by making it easier for organizations to deploy a complete observability platform based on open source software, said Wilkie.
While open source software has a key role to play in enabling observability, most IT organizations today rely on a range of proprietary tools to monitor IT environments. Many of those tools will be replaced, in the months ahead, by observability platforms that provide more context than individual monitoring tools currently do. However, it’s not clear yet if IT teams will prefer open source or proprietary platforms that, in most cases, incorporate open source components.
As IT environments become more complex, the tools most organizations rely on today don’t surface enough actionable insights. Most IT teams today still waste a fair amount of time navigating amongst multiple tools in an effort to discover the root cause of a problem. It’s not uncommon for IT teams to take days to discover the source of a problem that is then fixed in a few minutes. The expectation is that observability platforms will sharply reduce the amount of time and effort required to investigate, for example, a performance issue.
Of course, to achieve that goal, applications themselves will need to become more instrumented. A mix of open source and proprietary agent software will make it easier to collect traces, logs and other metrics at a reduced cost. In many cases, IT teams have been reluctant to fully instrument an IT environment, because of both the cost of proprietary agent software and the inherent challenges associated with deploying and managing it across an extended enterprise. However, as the deployment process for agent software becomes more automated, organizations are finding it easier to instrument their applications.
It may be awhile before IT environments are fully instrumented. However, as it becomes easier to collect traces, logs and metrics, the level of observability that can be achieved across an enterprise will undoubtedly increase. The challenge and the opportunity then becomes employing the greater visibility provided by these platforms to manage the sprawl of applications and platforms across IT more proactively.
Sysdig and IBM announced they have extended their alliance to make Sysdig monitoring tools more broadly available across IBM public cloud services.
IBM first adopted the Sysdig platform to enable DevOps teams to monitor workloads running on a subset of the IBM Cloud in June 2018. Now the company will extend those managed instances of the Sysdig monitoring platform running on its own public cloud to include additional cloud services such as IBM Watson, Event Streams, Cloud Databases, Cloud Object Storage and Cloud Foundry.
Janet Matsuda, chief marketing officer for Sysdig, said monitoring capabilities as especially critical as the number of microservices-based applications running on public clouds continues to increase. IBM also makes use of the open source Prometheus monitoring platform to monitor many of those applications. Sysdig last month announced compatibility with Prometheus as a data source.
In the wake of the COVID-19 pandemic, it’s probable that more monolithic applications will also be moving into the cloud as part of organizations’ business continuity strategies. Applications that run in the cloud are easier to manage remotely. Regardless of whether applications are monolithic or based on microservices, it’s clear IT teams will be “flying blind” unless they have access to monitoring tools, Matsuda noted.
Over time, many of the monolithic applications being moved into the cloud will be transformed into a more flexible set of microservices that are easier to update. As that transition occurs, the need to observe the myriad microservices running on a public cloud becomes an even bigger challenge for IT teams.
Of course, some IT teams will prefer to employ their own monitoring tools versus relying on a managed service, especially if they are trying to centralize the management of IT across multiple public clouds and on-premises IT environments. However, for now, at least, the bulk of IT teams are still employing various public clouds in isolation from one another.
Longer-term, the relationship between Prometheus and commercial monitoring platforms is still being defined. Many application developers are relying on Prometheus to observe applications during the development process. Many IT teams, however, are already making extensive use of commercial monitoring platforms to identify and correlate issues in production environments. Sysdig is betting most of those organizations will continue to rely on those tools because they are easier to set up and navigate. In addition, each instance of a Kubernetes cluster currently requires its own instance of Prometheus.
On the plus side, the amount of time and effort being applied to instrumentation and observability as part of any set of best DevOps practices continues to increase sharply. Furthermore, the need to combine security and operational IT metrics and analytics to advance DevSecOps adoption is also going to push IT organizations toward more robust monitoring platforms. Arguably, the real challenge is no longer finding a way to instrument applications as much as it will be turning all the data being collected into actionable intelligence that can be relied on to automate the management of IT at an unprecedented scale.
Company focuses on scale, workflows and enterprise access controls for cloud application monitoring
SAN FRANCISCO — March 24, 2020 — Sysdig, Inc., the secure DevOps leader, today announced cloud monitoring at scale with full Prometheus compatibility. Sysdig addresses the issues of scale, data retention, and enterprise access controls that hold teams back from organization-wide adoption of Prometheus monitoring. Sysdig also introduces support for creating dashboards, alerts, and metric analytics based on PromQL, the query language for Prometheus. Sysdig is the only enterprise monitoring solution to be fully compatible with Prometheus. This allows customers to retain their investment in existing Prometheus exporters, configurations, alerts, and dashboards. With Sysdig, DevOps and cloud teams can scale their visibility, security, and troubleshooting capabilities with a supported platform that simplifies management.
In a separate release today, the company announced PromCat.io, a free repository of curated Prometheus exporters, dashboards, and alerts to monitor any infrastructure, application, and services running in the cloud. Sysdig offers documentation and suggested configurations for PromCat integrations.
“Many of our teams started with Prometheus. However, scaling and retention became difficult. When looking for a monitoring solution, I wanted something that fit well into the ecosystem and supported Prometheus,” said Jason McGee, vice president and chief technology officer for IBM Cloud Platform at IBM. “Central context, to see all of the components of your application in one place, is a requirement. Before adopting Sysdig, we had a very distributed environment, like islands of monitoring. Each team could only see their service. There was no way to see what was going on overall.”
Organizations are moving to the cloud and DevOps workflows to ship applications faster. However, meeting customer expectations requires complete visibility into infrastructure, services, and applications across multi and hybrid clouds and on-premises data centers.
Developers are rapidly adopting open source Prometheus to monitor the performance of their applications. With more than 13,500 code commits and 6,300 contributors, Prometheus adoption is accelerating. However, as organizations transition to full-scale production, they encounter scaling and workflow issues. Additional requirements — including the need for centralized and scalable metric stores, a unified view across clusters and services, and out-of-the-box insights — are needed in order to reduce risk and maintain application availability. Without a macro view of the environment, it is difficult to anticipate issues with microservices that have cross-platform dependencies.
New Features
Fully Compatible Prometheus Monitoring: As organizations scale cloud deployments, they want to retain the industry-standard monitoring approach their developers prefer. Sysdig is the only cloud-scale monitoring solution fully compatible with Prometheus and the PromQL query language. This enables DevOps teams to retain their investment in existing Prometheus exporters, configurations, alerts, and dashboards. The Sysdig platform enhances their existing capabilities with greater scale, visibility, security, troubleshooting, and support.
Cloud Scale: With microservices and Kubernetes, scaling is a major hurdle. With Kubernetes, there is an increase in the number of objects and labels to track. With microservices, there is a dramatic increase in instances to monitor and therefore, the number of metrics to collect. Additionally, with Prometheus, companies are forced to monitor each Prometheus server on its own, making it difficult to view trends that would be visible from a unified view. Issues on microservices that have cross platform dependencies may go unnoticed.
The Sysdig Secure DevOps Platform provides a scalable system that can handle more than 100 million metrics per second, and retain up to 13 months of data. Sysdig is the monitoring solution for IBM Cloud Platform, one of the largest Prometheus monitoring deployments today. With Sysdig, teams can adopt Prometheus compatible monitoring using an enterprise-ready platform.
Other enhancements
Long-Term Datastore: With Sysdig’s data storage, Prometheus metrics are stored for 13 months, instead of just days or weeks. This gives DevOps teams access to long-term analysis to make better informed capacity planning and resource usage decisions.
Out-of-the-Box Kubernetes Dashboards: Sysdig reduces complexity and time to production with out-of-the-box Kubernetes dashboards. By bringing together platform monitoring and workload monitoring, DevOps teams can resolve issues faster.
“Prometheus brings tremendous value to developers which is why we standardized our monitoring approach on the open source project,” said Payal Chakravarty, vice president, product management at Sysdig. “There are, however, scaling challenges for the enterprise. By extending Prometheus monitoring, we’re able to help enterprises to use the Prometheus monitoring approach they love, while also giving them the scale, workflows, controls, and insights they need to maximize performance and availability.”
The Sysdig Approach
To date, Sysdig is the only security company to support a secure DevOps approach by integrating monitoring and security into a single platform. Cloud teams can embed security, maximize availability, and ensure compliance. By integrating security into the DevOps process, teams can realize the business goals in their transition to cloud native. Sysdig is a strong advocate for open source technologies, including three open source technologies created by the company, sysdig, Sysdig Inspect, and Falco, an open source cloud-native runtime security project. Currently, Falco is an incubation-level hosted project in the CNCF.
Availability
The features announced today are available to Sysdig customers now. Cloud scale will be available at the end of April.
About Sysdig
Sysdig enables companies to confidently run cloud-native workloads in production. With the Sysdig Secure DevOps Platform, cloud teams embed security, validate compliance and maximize performance and availability. The Sysdig platform is open by design, with the scale, performance, and usability enterprises demand. The largest companies rely on Sysdig for cloud-native security and visibility. Learn more at www.sysdig.com.
Kubernetes and Docker are two of the most commonly heard buzzwords in modern DevOps conversations. Docker is a tool that enables you to containerize and run your applications, and Kubernetes provides you with a platform to orchestrate or manage these containers—since managing thousands of containers manually using the Docker CLI would be a practical nightmare.
However, simply running thousands of containers and managing them through Kubernetes is not enough. You have to observe and analyze them properly to ensure that your services are up and running optimally. This process is called Site Reliability Engineering (SRE), a term initiated and popularized by Google. Observability and analysis are a major element of SRE. It can be subdivided into the following three areas:
Monitoring allows you to extract numerical metrics from your applications and resources that can later be visualized and analyzed to present the current state of your resources. Once the metrics are extracted, they can be used to set up alert rules, facilitate profiling and debugging, and make better SRE decisions.
Logging enables developers to debug their containers in case of a failure. Containers are short-lived, and so are logs. Kubernetes and Docker do provide a native way of browsing container logs, but it is very limited in its functionality. As a result, a centralized log plane is a must in any container-oriented environment.
Tracing allows you to debug services running on a network and follow a request trail until the source of a problem can be determined. In a microservices architecture, when multiple services/containers send requests to each other to perform one business task, a proper tracing solution is necessary.
This article will list and describe the most effective open source tools for monitoring and analyzing services running as containers.
Prometheus
Prometheus is the first tool that comes to mind when discussing open source monitoring solutions. It is very popular in the development community, and it is a graduate of the CNCF project, which focuses on the monitoring side of SRE. Originally created and open sourced by SoundCloud, Prometheus simplifies the process of pulling numerical metrics based on a time series from a given metrics endpoint. It was built to monitor highly dynamic container environments.
Prometheus is subdivided into three elements: Prometheus server, Alertmanager and exporters. Exporters are stand-alone, independent processes/containers that can be run on your target resource to generate and export metrics via a metrics API. The Prometheus server then takes care of service discovery as well as pulling metrics from the exporters to be stored in the Prometheus DB and later used for visualization or alerting. Alertmanager is responsible for setting up alert rules, analyzing the data in the Prometheus DB and sending alert messages to multiple receivers if a certain rule is triggered. There are a huge number of exporters, listed here, which are both officially supported by Prometheus and maintained by the community.
Prometheus has become the industry standard for monitoring cloud-native architectures. While it is known for its simplicity with service discovery, its ease of use, its alerting capacity and its integration with Kubernetes, its polling architecture is not ideal. Currently, the metrics endpoint has to be reachable by the Prometheus server. However, there is a pushgateway implemented in Prometheus that enables metric pushing rather than polling. Another downside of Prometheus is that it doesn’t scale well. This problem can be fixed in the Thanos adaptation of Prometheus.
Related tools and technologies: Grafana, Cortex, Thanos, Prometheus Exporters, Alert Manager, Istio, Prometheus Operator.
Grafana is an open source metric analytics and visualization suite. It allows you to create custom dashboards using data taken from multiple sources, such as Prometheus, Elasticsearch, MySQL, Postgres and Redis. Furthermore, Grafana has its own alerting system and a role-based access control (RBAC) system for software. As a data visualization tool, Grafana is famous among Prometheus users for enabling them to effectively visualize the metrics stored in Prometheus. There’s a wide array of official and community-built custom dashboards for various data sources in Grafana, allowing users to easily set up dashboards (found at this link) and get on with monitoring. Grafana offers another associated product called Loki, which aggregates logs in Kubernetes and integrates well with the Grafana UI.
Related tools and technologies: Loki, Prometheus.
Figure 2: Kubernetes Resources Dashboard in Grafana. Source: Replex.
Elastic Stack
Elastic Stack is a group of open source products from Elastic designed to help users search, analyze, and visualize data from any type of source, in any format, in real time. This product was previously recognized as the ELK stack, where each letter of the acronym stood for one of the company’s main products: Elasticsearch, Logstash and Kibana. Elastic Stack provides both monitoring and logging solutions with the help of its big data database, Elasticsearch.
In order to aggregate logs, people tend to use Elasticsearch for storage, Logstash or Fluentd for log streaming, and Kibana for visualization. Fluentd is not part of the Elastic Stack, but it is widely used with Kubernetes to stream logs in place of Logstash, the tool provided by Elastic Stack. Similarly, Metricbeat is used to scrape metrics and set up visualizations on Kibana. The enterprise version of Elastic Stack ships with X-Pack, a set of additional tools that enables reporting, alerting and role-based access control (RBAC), among other features. By default, the Elastic Stack GUI, Kibana, does not support RBAC. You have to use the previously mentioned enterprise version of Elastic Stack to enable it.
Related tools and technologies: X-pack, Metricbeat, Logstash, Kibana.
Figure 3: Discover View in Elasticsearch. Source: XpresServers.
Sensu Go
Sensu Go is a telemetry and service health checking solution for multi-cloud monitoring at scale. It allows you to gain visibility into servers, containers, services, applications, functions and connected devices across any public or private cloud. Sensu can be run side-by-side with Prometheus to get the best out of both solutions, or it can be run natively without Prometheus. Sensu works best alongside Prometheus, since exporting application level metrics to Prometheus requires loading the Prometheus SDK to your application codebase and exposing a metrics endpoint. The endpoint is then scraped and stored in the Prometheus Server. This may sound like a lot of work—and, sometimes, it is. Sensu avoids this complexity by using a sidecar concept. A Sensu agent is deployed alongside your application. The agent constantly collects and exposes metrics to the Prometheus server without your having to change the application codebase.
Sensu works without Prometheus too. It can operate natively in Kubernetes, where it has its own server to store and visualize metric data exposed by the previously mentioned Sensu agent.
Sysdig has two open source products: Sysdig Inspect and Falco. Here, we’ll focus on Inspect, which monitors and captures the container processes running in your system and allows you to drill into those processes for post-incident forensics. This enables you to analyze your application performance, troubleshoot errors and monitor any processors that could be misbehaving. Furthermore, if your system is breached, Sysdig allows you to understand how the breach occurred and what data was taken in the process. Sysdig Inspect is a very powerful tool that focuses on the performance tuning and security investigation of your system.
Related tools and technologies: Grafana, Sysdig, Sysdig Falco.
Jaeger is an end-to-end distributed tracing solution that was open sourced by Uber Engineering. It allows you to monitor and troubleshoot transactions in complex distributed systems. In modern microservice architectures, the majority of operational problems fall under the umbrellas of networking and observability. When a service failure occurs, you have no idea how the requests have gone from service to service over the network to complete a single business transaction. This makes debugging extremely difficult. Currently incubating under CNCF, Jaeger uses tracing to enable root cause analysis, performance and latency optimization, and distributed transaction monitoring. Jaeger works out of the box with Istio, a popular service mesh implementation open sourced by Google.
Related tools and technologies: Prometheus, Jaeger, Zipkin, Istio.
These tools are widely used in the tech industry, and they all have their benefits. Most of these solutions, however, require skilled implementation and ongoing manual maintenance that can be a burden for DevOps teams and a distraction from the business. There’s no one solution that can cater to all of your requirements, since each tool focuses on one or two specific aspects of observability and analysis. By mixing these tools together, you can derive a unique solution for your individual business needs.
For ease of comparison, the chart below outlines the features offered by each of the tools discussed in this article.
Whether migrating from a monolithic architecture or building a distributed system from ground zero, there are many benefits to leverage from a microservices architecture–faster software deployment cycles, enhanced scalability, improved isolation of risk. However, distributed systems are complex and as such, accompanied by many challenges, particularly when it comes to the scalability of metrics.
The Importance of Observability in Distributed Systems
In order to realize the benefits of a distributed system, a strategy of data-driven optimization is essential. The paradox here is visibility simplifies complexity, while the complexity of visibility is dramatically increased in distributed systems.
As New Relic points out in their eBook Cloud Native Is the New Normal, traditional monitoring approaches need to be adapted to meet the demands of decentralized architectures, including:
Overcoming the loss of end-to-end monitoring capabilities by learning how to connect the dots across a complex network of environments.
Developing tactics to quickly drill down into issues across interconnected parts to reduce mean time to resolution (MTTR).
Introducing proactive reliability strategies that focus on measurement first, followed by improvement.
Finding the Right Balance Between Monitoring Nothing and Monitoring Everything
Most application engineers leverage some sort of metrics tooling such as Grafana, Prometheus or Graphite to track vitals for their system health. While monitoring is essential, there is such a thing as bloat when it comes to metrics ingestion; and this overload translates to scalability challenges that affect performance, cost and reliability.
So, how do you know what to monitor? In order to derive the most valuable insights from your system, you must first understand and identify the components, and more specifically which attributes within those components drive key metrics. Knowing this requires an intimate familiarity with how all the pieces work together in your distributed system.
Google’s Site Reliability Engineering book provides a framework for determining what to monitor in distributed systems. They break signals down into four different categories:
Latency: Understand resource requirements and identify bottlenecks.
Traffic: Monitor system response to varying levels of load; most useful when paired with other indicators.
Errors: Track frequency and nature of interruptions in request/response flow.
Saturation: Surface capacity-related issues.
Even when you’ve identified the most important metrics to track, scalability is still a challenge that must be addressed, particularly when dealing with applications that handle massive volumes of data across a complex application architecture.
M3: Uber’s Open Source Large-Scale Metrics Platform
A solution directly addressing the challenges of distributed metrics at scale is M3, an open source project developed by Uber’s engineering team.
Before using M3, the Uber team sent metrics to a Graphite stack with storage handled using the Whisper file format in a shared Carbon cluster. From there, they created Grafana dashboards to visualize the data and used Nagios for alerting based on Graphite threshold checks via source-controlled scripts. As the volume of metrics continued to expand, manual processes to scale the solution became unsustainable and repeat failures resulting in permanent data loss led them to build a more fault-tolerant, scalable system.
M3 is focused on providing a reliable storage solution for large-scale metrics over long retention periods, solving inherent single node-associated limitations with Prometheus by offering a multi-tenant store for Prometheus metrics. A key component of this solution is M3DB, the scalable storage backend for M3.
M3DB, built in Go, is a distributed time series store and reverse index with configurable out-of-order writes. By enabling the storage of real-time metrics over long periods of retention, M3DB can replace a Prometheus cluster. In developing the M3DB solution, the Uber team essentially deconstructed Prometheus into microservices to enable the scaling of each component individually. By taking this approach, M3DB is able to offer better reliability, efficiency and performance.
At a minimum, M3DB can be leveraged as remote storage for Prometheus (or used to replace any other remote storage solution). There are, however, other features the solution offers, including an external aggregation engine and a separate query engine.
The M3DB project is still under development with a growing community of contributors.
To learn more about containerized infrastructure and cloud native technologies, consider coming to KubeCon + CloudNativeCon NA, November 18-21 in San Diego.