Tag: Prometheus

  • Optimizing Prometheus Implementations With Managed Services

    Optimizing Prometheus Implementations With Managed Services

    Prometheus is a leading metrics-based open source monitoring solution and time series database used across the IT community to collect metrics from systems, applications and services. According to the 2021 Cloud Native Survey from the Cloud Native Computing Foundation (CNCF), the use of Prometheus in production has reached 65%, an increase of 43% year-over-year.

    “As cloud-native stacks have grown and matured, observability has become crucial for visibility into application metrics, performance, alerting, and insights,” said Chris Aniszczyk, CTO of CNCF. “Prometheus is a key element of this, enabling organizations to build a foundation of observability.”

    If you are using Prometheus, it is probably because of its many advantages including reliability, easy initial implementation and its open source nature. However, in addition to these benefits, Prometheus also brings several challenges if you are deploying and maintaining the solution on your own.

    Facing the Four Main Prometheus Challenges

    Prometheus users face four primary challenges that can be alleviated by the right service provider:

    Challenge One: Support

    Prometheus users face the dilemma posed by any open source tool: There is no vendor behind the solution to deliver technical support. It is easy to take tech support for granted, but when you are working with a technology that is not supported, even a small issue can become a substantial problem. A commercially-backed product can provide a critical level of expertise you do not have in-house, and take on responsibility for keeping the system up and running.

    Challenge Two: Maintenance

    The greatest challenge you’ll likely face with Prometheus is the amount of time your team must spend configuring and maintaining the system. 

    Just one example of how Prometheus drains your resources is the use of third-party exporters to expose metrics in the Prometheus format. These integrations are designed by members of the open source community an do not come with any support; upgrades are hit-or-miss.

    Exporters are difficult to maintain. First, there are often multiple exporter options and choosing the right one for each of your services is time-consuming. Second, you can easily have hundreds of different services running in your environment and your team can spend hours every day making sure the exporters are working properly.  

    Another maintenance issue involves PromQL, the Prometheus query language. PromQL is a custom query language, and it is very complex and difficult to learn. Having to rely on your one PromQL expert for all Prometheus queries across the organization is simply not practical or sustainable.

    With all these maintenance requirements, you will have some team members spending all their time managing and maintaining a Prometheus environment, eating away at resources that could be used to focus on business needs and innovate new applications.

    Challenge Three: Scalability

    Users tend to deploy Prometheus in silos, with a separate server for each cluster. Over time, you may have tens or even hundreds of Prometheus servers in your environment that you are not aware of. This leads to scalability issues regarding consistency, maintainability and a global view of your metrics.

    In addition, storage is a major hindrance to scaling Prometheus, because the system typically stores metrics for about two weeks. If you need to analyze metrics older than a couple of weeks, you run into a serious problem. 

    Challenge Four: Correlating Data

    Data does not have much value if you cannot correlate it and, unfortunately, Prometheus does not provide correlation for metrics to other elements in your environment like processes or cloud regions. This makes it difficult to pinpoint the source or impact of a problem. 

    Options for Solving Prometheus Challenges

    Options are available to help you with Prometheus but most do not solve the four major issues outlined above. The following are your options:

    APM: APM vendors all have some level of support for Prometheus, but this is an add-on to their platform. They offer an ingest tool that can transform Prometheus data into a format you can query natively within the APM platform. In reality, they are not helping you utilize Prometheus but instead are forcing you to work within the constraints of their system.

    Cloud tools: Some cloud hyperscalers offer solutions to support Prometheus. These tools can help with deployment and infrastructure maintenance, but you are still stuck doing all the other configuration and maintenance work. 

    Managed service: The preferred option is a Prometheus managed service, which can alleviate all four of the main challenges posed by open source Prometheus. The right optimized managed service provider delivers support, maintenance, long-term storage and data correlation.

    Must-Have Capabilities for Your Prometheus Managed Service Provider

    The following are essential capabilities you should look for when choosing a Prometheus managed service provider:

    Prometheus compatibility: You need an optimized managed service provider whose platform is designed to be natively compatible with Prometheus, consuming data in the Prometheus format and allowing you to run PromQL queries on the data.

    Simplified PromQL: To eliminate the reliance on PromQL experts for every query, a managed service provider should simplify the use of PromQL, without breaking compatibility.

    Exporter management: The right optimized managed service provider will be able to streamline the selection, deployment and management of exporters, saving you a significant amount of time and effort.

    Automated discovery: Tracking and optimizing all your services can be challenging. For this reason, a Prometheus-managed service should be able to automatically discover the services running in your environment and help guide you with configuration.

    Metric Storage: One of the shortcomings of Prometheus is the lack of long-term storage. Consequently, a Prometheus managed service provider should provide a database for long-term storage of metrics, so you can perform comparative analyses of the data, from month to month and even year-to-year.

    Prometheus compatibility: If you already use open source Prometheus, your teams are used to using things like PromQL and Grafana dashboards. You should select a managed service provider that is Prometheus-compatible so your team can use the same dashboards and queries they have always used to view the data.  

    Conclusion: Optimized Valuable Tool

    Prometheus is not a standalone solution. But it is an optimized valuable tool to collect metrics for performance analysis and it is appreciated by your architects, developers and IT Ops pros. While Prometheus may have some limitations, it is worth finding a solution to these issues; that solution is a managed Prometheus service. The right managed service provider can give you the best of both worlds—all the benefits of Prometheus without the time, resources and expense needed to run it effectively.

  • Grafana Labs Adds Visual Tools to Simplify Prometheus Queries

    Grafana Labs Adds Visual Tools to Simplify Prometheus Queries

    At its GrafanaCONline event, Grafana Labs today announced an update to the open source Grafana dashboard. The update adds visual query tools to make it easier for IT professionals of any skill level to launch queries against the Prometheus monitoring platform or the company’s Grafana Loki log aggregations framework.

    In addition, Grafana said the open source edition of Grafana OnCall, a scheduling and paging application, is now also available as open source software that can be used in on-premises IT environments. Previously, Grafana OnCall was only available as part of the managed Grafana Cloud service.

    Archana Kesavan, director of product marketing for Grafana Labs, said version 9.0 of the core Grafana platform makes Prometheus monitoring more accessible. Prometheus is being advanced under the auspices of the Cloud Native Computing Foundation (CNCF). It is most widely used in Kubernetes environments, but can also be used with monolithic applications. The latest version of Grafana adds support for an exemplars overlay for traces and Prometheus sparse histograms.

    Other capabilities added with this release include a dashboard preview and title search capability, support for envelope encryption by default, an expanded navigation bar and a revamped heatmap panel that renders more quickly than its predecessor.
    ‘

    Finally, the alert system that Grafana Labs first introduced as an option is now a default setting.

    Kesavan said in addition to making it easier to launch queries, the Grafana Labs approach also limits the ability of a poorly constructed query to impact clusters running Prometheus.

    In general, the adoption of Prometheus has risen alongside Kubernetes. At least initially, DevOps teams that adopt Kubernetes often employ Prometheus to monitor the platform. Less clear is the degree to which IT teams will continue to rely on Prometheus once cloud-native applications are deployed in a production environment. Many IT teams already have a monitoring platform they employ that they choose to extend to Kubernetes environments. Conversely, however, some organizations are opting to replace legacy tools with the Prometheus monitoring platform to monitor both Kubernetes environments and legacy monolithic applications.

    At the very least, Prometheus has established a de facto standard for collecting monitoring data from Kubernetes environments that can be queried by a wide variety of tools.

    One way or another there will soon be fleets of Kubernetes clusters deployed across the extended enterprise that will need to be monitored. DevOps teams will naturally need to decide for themselves how best to monitor those clusters and, ultimately, observe them in a way that enables queries to be launched and issues surfaced before they become a major problem.

    In the meantime, DevOps teams might want to consider consolidating many of the monitoring tools they use today as part of an effort to streamline operations. Rather than having to correlate events across a dozen tools to determine the root cause of an issue, the goal should be to have enough tools to ensure verification without spending hours sorting through conflicting reports.

  • Prometheus Associate Certification will Demonstrate Ability to Monitor Infrastructure

    New associate certification exam from CNCF and The Linux Foundation will test foundational knowledge and skills using Prometheus, the open source systems monitoring and alerting toolkit

    Valencia, SPAIN, KubeCon + CloudNativeCon Europe – May 18, 2022 – The Cloud Native Computing Foundation® (CNCF®), which builds sustainable ecosystems for cloud native software, and The Linux Foundation, the nonprofit organization enabling mass innovation through open source, today announced the new Prometheus Certified Associate (PCA) exam. The PCA is a pre-professional certification designed for engineers or application developers with special interests in observability and monitoring within the Prometheus ecosystem.

    The PCA is modeled after Kubernetes certifications such as KCNA, CKA, or CKAD and is intended for candidates who have passed these certifications or have completed Prometheus-specific training or Cloud Engineer bootcamps. The exam is now in Beta testing and will be generally available later in 2022. 

    According to CNCF’s 2021 Cloud Native Survey, the use of Prometheus in production has reached 65%, an increase of 43% year-over-year. Production users include organizations like Adidas, Slack, JPMorgan Chase, Verizon, and Uber. Prometheus was the second project to join CNCF in 2016 and the second project to graduate in 2018, following only Kubernetes. 

    “As cloud native stacks have grown and matured, observability has become crucial for visibility into application metrics, performance, alerting and insights,” said Chris Aniszczyk, CTO of CNCF. “Prometheus is a key element of this, enabling organizations to build a foundation of observability. The PCA exam will allow developers to demonstrate their proficiency in Prometheus ecosystem and cloud native observability concepts.”

    PCA will consist of a multiple-choice, online certification exam testing entry-level skills and knowledge around best practices for monitoring cloud native applications and infrastructure and the ability to improve application performance through observability data. Successful candidates will be able to recognize when something is wrong with an implementation, monitor and gain insight into performance, debug issues, and feed data into other systems, including QA, security, and automation. The existing “Monitoring Systems and Services with Prometheus” training course can be helpful for those new to Prometheus.

    “There is an ongoing talent shortage in the cloud space, and the only way to address it is to get more individuals trained and certified in these emerging technologies,” said Clyde Seepersad, SVP, and general manager of training & certification at The Linux Foundation. “We have seen tremendous interest in Prometheus training as adoption of this impactful technology has increased, which is a fantastic starting point. This new certification will allow individuals skilled in this technology to verify their abilities to employers, helping advance their careers while beginning to address this talent gap.”

    The exam is being developed in partnership with Certiverse. As demonstrated with The Linux Foundation Certified IT Associate (LFCA) and Kubernetes and Cloud Native Associate (KCNA) exams, the company’s online exam development platform brings high-quality certifications to market with the speed required to keep IT content current and relevant.

    More information about the exam and topics to be covered in it is available here. Those interested in enrolling in the Beta may do so for free here. Additional details on exam availability will be announced in the coming months. 

    About Cloud Native Computing Foundation

    Cloud native computing empowers organizations to build and run scalable applications with an open source software stack in public, private, and hybrid clouds. The Cloud Native Computing Foundation (CNCF) hosts critical components of the global technology infrastructure, including Kubernetes, Prometheus, and Envoy. CNCF brings together the industry’s top developers, end users, and vendors, and runs the largest open source developer conferences in the world. Supported by more than 500 members, including the world’s largest cloud computing and software companies, as well as over 200 innovative startups, CNCF is part of the nonprofit Linux Foundation. For more information, please visit www.cncf.io.

    About the Linux Foundation

    Founded in 2000, the Linux Foundation is supported by more than 1,000 members and is the world’s leading home for collaboration on open source software, open standards, open data, and open hardware. Linux Foundation’s projects are critical to the world’s infrastructure including Linux, Kubernetes, Node.js, and more. The Linux Foundation’s methodology focuses on leveraging best practices and addressing the needs of contributors, users and solution providers to create sustainable models for open collaboration. For more information, please visit us at linuxfoundation.org.

    The Linux Foundation has registered trademarks and uses trademarks. For a list of trademarks of The Linux Foundation, please see its trademark usage page: www.linuxfoundation.org/trademark-usage. Linux is a registered trademark of Linus Torvalds.

    # # #

    Media Contact:
    Katie Meinders
    The Linux Foundation
    PR@CNCF.io

  • GitLab Revamps Observability Strategy After Acquiring Opstrace

    GitLab Revamps Observability Strategy After Acquiring Opstrace

    GitLab plans to make observability a more integrated element of its continuous integration/continuous delivery (CI/CD) platform after acquiring Opstrace.

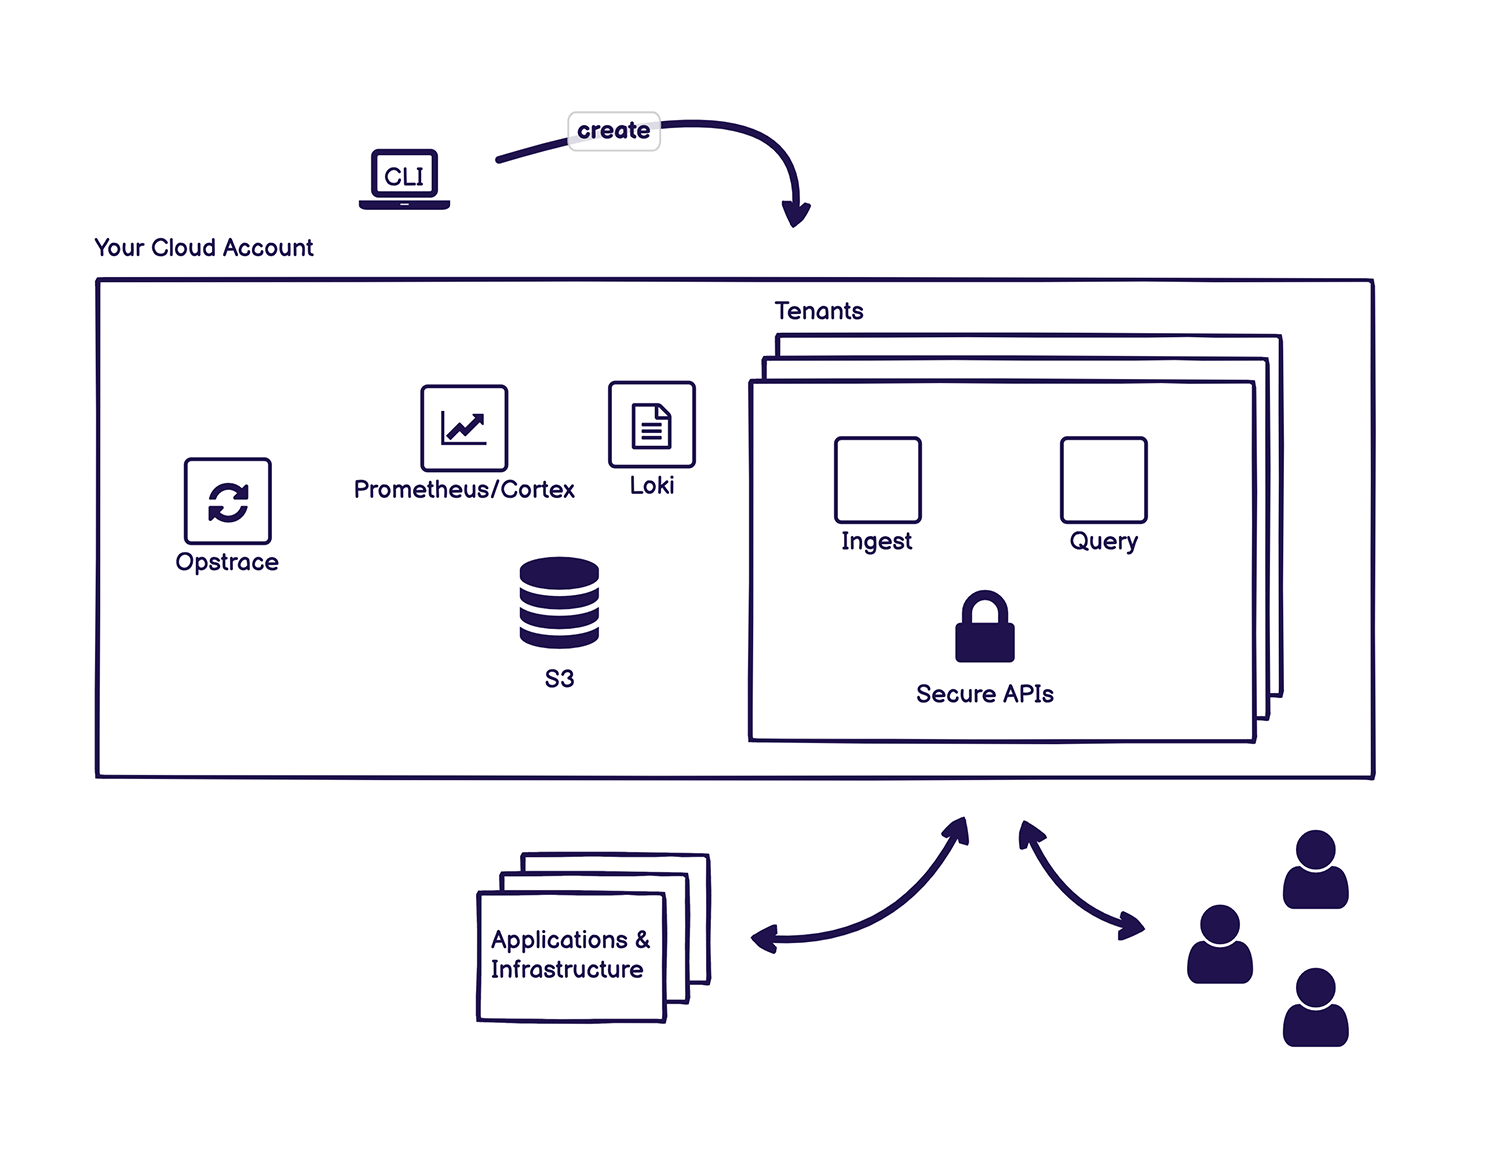
    Opstrace’s open source project exposes a horizontally scalable application programming interface (API) created by Cortex for Prometheus, an open source monitoring platform being advanced under the auspices of the Cloud Native Computing Foundation (CNCF). It then makes use of a Loki API to collect log data.

    DevOps teams can also point an existing instance of Prometheus to Opstrace or any instance of Fluentd or Promtail software they are using to collect log data, with support for a wide variety of other APIs, such as the Datadog agent, planned. A command line interface (CLI) is provided to set an instance of Opstrace that creates a controller through which the collecting of log data is managed.

    Kenny Johnston, senior director for product management for GitLab, said as part of an ongoing effort to make observability more accessible, GitLab plans to integrate Opstrace by default with GitLab Monitor for organizations that use either the self-managed version of GitLab or the software-as-a-service (SaaS) platform.

    Opstrace currently collects logs and metrics and support for distributed traces is planned. The goal is to extend the overall scope of observability capabilities that GitLab already provides within its CI/CD platform, noted Johnston. The goal is to make it simpler for DevOps teams to employ observability capabilities and interrogate data to optimize workflows without acquiring a separate observability platform, he added.

    GitLab is betting that, as Prometheus continues to gain traction, more DevOps teams will prefer to extend its reach into the realm of observability rather than having to manage a separate platform.

    Although observability has always been a core tenet of DevOps best practices, achieving it has proven to be a challenge. At best, most organizations can continuously monitor IT environments based on predefined metrics that identify when a specific platform or application is performing within expectations. Observability combines metrics, logs and traces—a specialized form of logging—to instrument applications in a way that makes it simpler to troubleshot issues without having to rely solely on a limited set of pre-defined metrics that have been created to monitor a specific process or function.

    The rate at which DevOps teams will embrace observability will naturally vary. In 2022, the biggest obstacle might not be the technology as much as it is simply understanding what queries can help DevOps teams better understand the root cause of an IT issue before there is a major disruption. In the long term, it’s expected that machine learning algorithms will leverage the data collected by observability platforms to automatically identify issues that might lead to a disruption long before it actually occurs.

    One way or another, the ability to discern events even within the most complex IT environment is steadily improving. Whether that’s accomplished as an extension of monitoring or by embracing true observability may not be all that relevant—as long as the ultimate goal is achieved.

  • Best of 2021 – 11 Open Source DevOps Tools We Love For 2021

    Best of 2021 – 11 Open Source DevOps Tools We Love For 2021

    As we close out 2021, we at devopsy.kinsta.cloud wanted to highlight the most popular articles of the year. Following is the eighth in our series of the Best of 2021.

    DevOps isn’t just a cultural shift — it requires great tools to come to fruition. Below, we’ve pulled together a list of some of the most well-loved DevOps tools available today. But, throwing loads of money into fancy SaaS solutions can quickly gobble up the cloud budget. These DevOps tools all are open source, and enable everything from container builds and orchestration to microservices networking, configuration management, CI/CD automation, full-stack monitoring and more. Here are some of our favorite open source DevOps tools for 2021.

    1. Kubernetes

    With the ubiquity of microservices and container-based software, it’s no surprise that Kubernetes tops this year’s list of open source DevOps tools. Kubernetes, adoption of which rose by 48% in 2020, is used to orchestrate containers. Instead of releasing microservices manually, Kubernetes can automate deployment, maintenance and scaling of groups of containers in production. Kubernetes, sometimes written as K8s, is hosted by the Cloud-Native Computing Foundation (CNCF).

    2. Docker

    Docker, the software, is a free and open source platform used to build, ship and run an application as a lightweight container. Containers package up the binaries, libraries, configuration files and dependencies required for a program to run. Over the past decade, containers have played a key role in agile development, and Docker containers led the revolution. At its core is the Docker Engine. Docker Hub is also an excellent resource for finding and sharing prepackaged functions as containers. Also, to plug container vulnerabilities, it may be helpful to use open source container auditing tools like Docker Bench or Anchore.

    3. Istio

    Microservices are a handy development style, yet they bring new development and architecture concerns. Namely, how do we apply networking policies like security, encryption, observability and telemetry elements consistently across all our services? Well, service mesh is one answer. Service mesh places a sidecar proxy next to each container and abstracts these networking capabilities to a control plane. Istio is one such open source service mesh that has seen widespread adoption. Istio is built on Envoy, opening it up to plugins and extensibility options. We should also mention Linkerd and Kuma as viable open source service mesh alternatives.

    4. GitHub Actions

    GitHub is arguably the most popular source control and software collaboration platform on the planet. The GitHub platform itself, based on Git, has seen some significant updates in the past few years. Most notable is the GitHub Actions capability. GitHub Actions enable software packages hosted on GitHub to accept inputs and trigger other processes. This could help automate some cool DevOps workflows within GitHub, such as code reviews, branch management or CI/CD processes — the combinations of possibilities here are endless. GitHub Actions are, essentially, YAML files hosted in GitHub repositories that leverage GitHub webhooks. Though this is more of a feature than an open-source tool, we feel it’s important to include here. Actions is free for public repositories with a limit of 100 actions.

    5. Jenkins

    A big part of the DevOps philosophy is finding ways to automate and deploy new iterations more efficiently. Part of this goal is creating a streamlined continuous integration and continuous delivery (CI/CD) pipeline. Jenkins is an open source automation server with hundreds of plugins to automate the building, deployment and testing of software projects. Although GitHub Actions could theoretically replace a CI server in the future, CI tools like Jenkins, CircleCI, TravisCI and GitLab Community Edition still are preferred by many DevOps teams.

    6. Prometheus

    Metrics and alerting systems are crucial for site reliability engineers to visualize applications and react to issues. Prometheus, a graduated CNCF project, is a well-loved open source monitoring solution. A Prometheus server collects time-series metrics by scraping HTTP endpoints and generates a system to interact with this data, offering deep querying, visualization, storage and other capabilities. Check out this Awesome Prometheus list for Prometheus introductions and additional resources.

    7. Ansible

    Ansible is all about automation. Ansible, an open source project sponsored by Red Hat, can be used to automate things like cloud provisioning, networking, deployment, configuration management and other tasks. Ansible has a simple yet effective architecture that is relatively easy to assemble — all you need is a text editor and command line. You describe your infrastructure in a text document and organize your desired states in a playbook. For an example in practice, see how OpenIO uses Ansible. “Ansible is our standard tool not only to deploy the OpenIO core, but also our WebUI, OIO-FS and all upcoming options,” writes Cédric Delgehier, Ops at OpenIO.

    8. Chef

    Chef is another infrastructure-as-code (IaC) solution for automating your configuration management. Chef uses Ruby to automate server configurations and works well with all major cloud service providers (CSPs). This can be very useful when creating and provisioning large quantities of machines. Like other automation tools on this list, the user describes their components and their states in a declarative format. In Chef, these are known as “recipes,” which can be grouped together into “cookbooks.” You can’t diss Chef for not being on-theme!

    9. Terraform

    Terraform is another IaC tool that can be used for initiation of building, versioning and further automation using configuration files. “Terraform is a tool for building, changing and versioning infrastructure safely and efficiently,” as it is described on GitHub. Terraform follows an “execution plan” that a user creates with high-level syntax. One unique aspect of Terraform is its emphasis on versioning — this allows you to version the blueprint of your service just as you would your software.

    10. JAMStack

    As I’ve covered before, JAMStack combines JavaScript, APIs and markdown for constructing web-based applications. While more of a “headless development” methodology than a single open source tool, JAMStack projects are often built using open source components. For example, JAMStack often leverages open source headless content management systems such as Ghost, Strapi and/or Netlify CMS.

    11. ELK Stack

    ELK Stack is the union of three open source projects maintained by Elastic: Elasticsearch, Logstash and Kibana. With these three components, developers can take in and log data from any source and create helpful visualizations. This centralized logging is enabled with a NoSQL database for storage with Elasticsearch, processing and data collection with Logstash and visualization with Kibana. Increased visibility is vital for data analysis and helps identify errors to reduce mean time to recovery (MTTR).

    Rounding Out The DevOps Toolchain for 2021

    Programming isn’t only about shipping quality code, it’s about efficient execution. This drive to improve operations across the board is truly putting Ops into everything. With awesome open source DevOps tooling, it means more and more architects can adopt a DevOps approach within their deployment models.

    DevOps as a practice, as well as its underlying technology, is always evolving. In 2021, a lot of effort is being placed on wrangling the effects of introducing a microservices development style. We’ve noticed the maturation of container orchestrators and service mesh, as a result. Blueprinting infrastructure-as-code and creating automated, repeatable configurations is another must-have for implementing automated build and release pipelines. Not to mention, many no-code and low-code platforms are opening up DevOps capabilities to non-programmers, albeit from a proprietary perspective.

    It’s also helpful to note that some popular open source DevOps tools have been acquired — like Docker and Chef — blurring the lines between their business and their open source roots. When it comes to open source tools, it’s a good practice to adopt vendor-neutral tools with solid community support representing diverse stakeholders. This will help future-proof your project. Even though open source is “free,” users must ensure the benefits outweigh the time-to-onboard as well as the operational overhead of self-hosting.

    DevOps tools are beneficial to automate software deployment. Here, we’ve attempted to list some of the most exciting tools to help automate that process. Of course, many new tools are emerging in the DevOps space, and we have hardly scratched the surface. Do you have a favorite DevOps tool that’s not mentioned above? Let us know in the comments below!