Tag: open source

  • Best of 2018: Log Monitoring and Analysis:  Comparing ELK, Splunk and Graylog

    Best of 2018: Log Monitoring and Analysis: Comparing ELK, Splunk and Graylog

    As we close out 2018, we at devopsy.kinsta.cloud wanted to highlight the five most popular articles of the year. Following is the fifth in our weeklong series of the Best of 2018.


    As organizations face outages and various security threats, monitoring an entire application platform is essential to understand the source of threat or where the outage occurred, as well as to verify events, logs and traces to understand system behavior at that point in time and take predictive and corrective actions. Monitoring the logs and logs analysis are important for any IT operations teams to identify intrusion attempts and misconfigurations, track application performance, improve customer satisfaction, strengthen security against cyberattacks, perform root cause analysis and analyze system behavior, performance, measures and metrics based on the logs analysis.

    According to a Gartner report, the market for monitoring tools and APM tools is expected to grow to $4.98 billion by 2019, and log monitoring and analytics will become a de facto part of AI Ops. Log analysis tools are emerging as a low-cost solution for monitoring both application and infrastructure (hardware and network).

    There are mix of commercial and open source tools available as the log monitoring analysis tools market has matured. Some of the key features of log monitoring tools include powerful search capabilities, real-time visibility with dashboards, historical analytics, reports, alerts notifications, thresholds and trigger alerts, measurements and metrics with graphs, application performance monitoring and profiling and tracing events. This article focuses mainly on the differences in log monitoring tools ELK, Splunk and Graylog.

    ELK, Splunk and Graylog

    Elastic has put together arguably the most popular log management platform for both open source and commercial (cloud and enterprise) log monitoring tools. The Elastic Stack—more commonly known as ELK Stack—combines Elasticsearch, Logstash and Kibana. Elasticsearch is a modern search and analytics engine based on Apache Lucene, while Logstash provides data processing and enrichment. Kibana offers logs discovery and visualization.

    Splunk is a platform for searching, analyzing and visualizing the machine-generated data gathered from the websites, applications, sensors, devices etc. covering the entire infrastructure landscape. It communicates with different log files and stores files data in the form of events into local indexes. It provides the easiest way of search capabilities and has wide array of options to collect logs from multiple sources. Splunk is available in both SaaS and enterprise editions.

    Graylog offers open source log monitoring tools providing capabilities similar to ELK and Splunk. Graylog performs centralized log monitoring; where Graylog is used for data processing and Elasticsearch, MongoDB used for search and storage. It provides log archival and drill-down of metrics and measurements.

    The below table provides the comparison analysis based on the open source/free trial editions of ELK, Splunk and Graylog.

    Top 10 Companies using log monitoring tools (ELK Stack, Splunk, Graylog). Information source collected from ELK, Splunk and Graylog websites.


    Features Comparison

    Features Elastic Stack Splunk Graylog
    General
    License/Edition Available Open source, Commercial

    Cloud: based on the cluster (memory, storage, data center region)

    Enterprise: pricing based on / instance

    Free Trail: Available for 14 days

    Commercial

    Free: 500MB indexing / day

    Splunk Cloud: Pricing based on ingested data to cloud / day & Free Trial of 15 days with 5GB data

    available for search & analysis

    Splunk Enterprise: Pricing based on ingested data


    Open Source: Based on daily volume, price per month

    Enterprise: Free for Under 5 GB/day

    Implementation Language & Logging Format Java

    JSON

    C++, Python

    JSON,.CSV, Text file

    Java

    GLEF-Graylog Extended Log Format

    Community Support

    Enterprise Support

    Available: Well Documented

    Available 24* 7 Support


    Available: Well Documented

    Available: Direct access to the Customer Support Team

    Available: Well Documented

    Available : Unlimited Support from the Graylog Engineers

    Supported Server Platforms All OS-x, Window, Red hat Linux,OS Solaris and Windows Linux ,Ubuntu, Centos, Windows
    Ease of Configuration Need to set up Elasticsearch, Logstash, Kibana, beats with cluster configuration and medium complex to setup. Single platform with server and forwarder from clients, with less complexity to set up. Need to set up Graylog – Graylog web server, Elasticsearch, MongoDB and medium complex to set up.


    Basic Components Involved Elasticsearch – Search and storage

    Logstash – data processing

    Kibana – visualization

    Beats – logs collector and shipper

     Splunk Server

    Splunk Forwarder

    Graylog – Data processing and web interface

    Elasticsearch – log storage

    MongoDB – Configuration data storage

    Data
    Data Collection Beats, Logstash, Elasticsearch Ingest nodes


    Using app-add-ons and Splunk forwarders


    GELF TCP/UDP

    Message Inputs & Content Packs (inputs, extractors, outputs streams, dashboard configuration)

    Graylog Side car


    Data Formats Common Log files format

    Ex: nginx, tomcat logs common formats.

    Accepts any data type including .csv, JSON, log  files , xml, etc. Common log files formats. Ex: nginx [ error_logs, access_logs]

    Syslogs, rsyslogs, GLEF format

    Additional Data Inputs HTTP,TCP, Scripted inputs, Syslog input HTTP, TCP, Syslog input, various Log stash plugin


     GLEF Kafka, GLEF HTTP, Beats, Message Inputs, rsyslog and syslog-ng
    Data Base & Database Schema Creation With Fields Elastic search – document oriented DB

    Schema defined in the specific beats plugins / log forwarders.

    Splunk uses built-in data structure, and stores the indexes to disk.


    Elasticsearch – to store the logs

    MongoDB – storing metadata and dead letter queue messages

    Schema defined in the specific content packs

    Data Correlation

    & Aggregation

    Done through Aggregate filter and logstash correlation event filters Done through index event correlate commands

    Decorators.

    Done through aggregate filters, decorators.
    Centralized Logging Support Available with log shippers Available with Splunk Enterprise Forwarder, Universal Forwarder Available with Logs collector Graylog sidecar, RSyslog.
    Data Import / Export Import / Export data from various sources like Influx DB Export / Import can be done through Splunk DB Connect to relational databases GELF output plugin

    REST API

    Data Transport Kafka, RabbitMQ, Redis Persistent Queue

    Processing Pipeline Components

    Apache Kafka, RabbitMQ (AMPQ)
    Data Collection Intervals Real time Stream and in Batches Real time Stream and in Batches Real time Stream and in Batches
    Search      
    Search Capabilities Provides a highly scalable full-text search and analysis engine with Elastic search Offer dynamic data exploration to extract everything as it having its ow search language. Full-text based search on Real-time UDP/GELF logging with Intuitive Search interface
    Search Language Query DSL (Lucene) SPL (Splunk Processing Language) Very close to the Lucene Syntax
    Protocol  Used For Read / Write operations REST API, HTTP API  REST API, HTTP API HTTP API, REST API
    Log Filter

    Search filtering

    Grok Filter Plugin


    Search filter with fields levels, saved searches, graphs, etc.

    Filter logs applying transforms to events Uses Drools rules, extractors, fields filter

    Blacklisting,


    Visualization      
    Reporting

    Historical Data Management


    Available in X-Pack component

    Quickly generate reports of any kibana visualization or dashboard and any raw data.


    Each report is print-optimized, customizable and PDF-formatted


    Built-in feature

    Reports are created for saved search, visualization or dashboard, set up schedule report, configure the priority of schedule report with support on  Historical and streaming data


    No built-in reporting capability

    REST API can be used to generate own reports on the history data and streaming data.


    Alerting Supported through X-pack / watcher configurations can be created

    Integrations available to send alerts to AIOps tools

    Built-in feature, support real time or scheduled alerting

    Integrations available to send alerts to AIOps tools

    Built-in feature

    Alerts raised based on stream

    Integrations available to send alerts to AIOps tools

    Monitoring
    Server, Device Logs Monitoring Uses Metricbeat, Filebeats for capturing server-related logs Using Splunk Insight For Infrastructure Uses Graylog Beat , NXlog
    Network Logs Monitoring Captures network logs through Packetbeat Uses Splunk MINT to capture network logs  Uses SNMP & netflow Plugin
    Cloud Logs Monitoring Using Logstash, Filebeat, modules Configurable via add-ons in Splunk, for different clouds


    Plugins available to pull logs from cloud.
    Containers Log Monitoring Using Logstash, File Beat & Metric Beat, Logstash processors for Docker logs Splunk logging driver for Docker Uses Filebeat & Native Graylog (GELF logging driver) Integration
    Kubernetes Orchestration Monitoring Using Fluentd, metric beat to ingest logs from Kubernetes Using collector built for Kubernetes Using Filebeat collector sidecar
    DB Log Monitoring Enabled through Filebeat modules, Logstash Enabled through Splunk add-ons for different databases and Splunk DB connect Enabled through Add-on plugins and GLEF libraries for different databases including mysql, mongodb, etc.
    End User Transactions Monitoring, Application Performance Monitoring Enabled through APM and different beats, Logstash correlation, X-Pack components. Enabled through Splunk App for Synthetic monitoring, Splunk ITSI Modules, Splunk MINT SDK. Application logs and add-ons from marketplace.
    Analytics

    (Causal Analysis,  Anomaly detection, etc)

    Supports Machine Learning via X-Pack. Splunk IT Service Intelligence Modules provides machine learning algorithms for anomalies, etc. No out-of-box machine learning support
    Others
    Customization / Extensibility Can create customized dashboards with Kibana controls and search queries.


    Custom Metricsets and Plugins


    Custom rules can be created to define thresholds and alerts


    Can extend / integrate with other tools via webhooks / plugins and programmatic access via REST HTTP/JSON API


    Hosted Elastic Stack provides out-of-box user management features, via X-Pack.


    Flexible to add/ edit new components and views to Splunk dashboards using SplunkJs stack and Javascripts.


    Can create custom metrics indexes and collect data using statsD, collectD.


    Can extend / integrate with other tools via webhooks / plugins and programmatic access via REST HTTP/JSON API with 1000+ add-ons.


    Out-of-box user management.

    Slunk Enterprise Security


    Flexible to add Custom dashboards based on stream using widgets, graphs, CLI stream dashboards.


    Can create custom index models, custom extractors with metrics needed using REST API, content packs.


    Provides few out-of-box alerting with default conditions with custom alerts defined on the streams and conditions.


    Plugins are available in Graylog, to integrate with other tools


    Provides user-management, LDAP and other authentication mechanisms (single-sign on/two-factor) integrations.


    Scalability Supports scalability(horizontal) and high availability with master / slaves cluster. Scalable with distributed deployment of Splunk Enterprise components for data input, indexing and search. Scalable with multiple nodes on ES, MongoDB, Graylog server, along with any queues (Kafka / RabbitMQ).
    Backup / Restore Can take snapshots backup of indexes to any external repository such as S3, Azure, etc.

    Retention on ES through Elasticsearch curator.

    Supports backup of configuration, indexes, warm db buckets based on policies. Archival Plugin available in Graylog Enterprise, to back up indexes and restore to new cluster, via web UI, Rest API


    Log monitoring is very essential as part of full stack monitoring, which can provide better insights for faster troubleshooting. The choice of log monitoring tools will depend on your requirements, infrastructure, price and monitoring and maintenance needs. Elasticstack, Splunk and Graylog have enterprise-ready platforms and solutions for log monitoring, and all are widely used across multiple enterprises and domains.


    — Ritu Bhargava

  • Best of 2018: 11 Popular Open Source DevOps Tools Worth Knowing

    Best of 2018: 11 Popular Open Source DevOps Tools Worth Knowing

    As we close out 2018, we at devopsy.kinsta.cloud wanted to highlight the five most popular articles of the year. Following is the fourth in our weeklong series of the Best of 2018.


    Companies implementing the best practices of DevOps have demonstrated that they are more effective and flexible in implementing as well as designing IT tools and practices, resulting in higher revenue generation at a lower cost. For traditional organizations looking to embrace new inventions such as bitcoin wallet, the adoption of DevOps tools provides consistency, quality and efficiency.

    Open source DevOps tools are used as a way to streamline the process of development and deployment. The benefit of using open source software is that it is built with enhanced collaboration which can drive innovation and enhance flexibility in handling transforming markets and needs. Visibility into the code helps enhance overall quality and security, and also helps companies prevent vendor lock-in from proprietary vendors.

    Open Source DevOps Tools to Know

    If you are looking to accelerate an already existing program or just getting started with DevOps, below are 11 open source DevOps tools worth considering.

    Behat

    Behat is a php framework for auto testing the expectations laid by your business. It is a behavior-driven, open source development framework for php. This tool supports you in providing software that matters via test automation, deliberate discovery, and continuous communication.

    Watir

    Watir is a web application cross-platform open source testing tool. It is the most flexible and reliable tool of Ruby libraries for automating the web browsers. Just like a human being, this tool communicates with the browser so it validates text, fills out forms and clicks links.

    Supergiant

    Built on top of Kubernetes, Supergiant is an open source platform for container management. It is utilized for Kubernetes deployment on multiple clouds in a matter of minutes. The Supergiant API is used for streamlining production deployment. With the help of the packing algorithm of Supergiant, hardware costs can be lowered and the hardware you require with computed efficiency can only be utilized.

    Ansible

    Ansible automates various common tasks related to IT operations such as application deployment, configuration management and cloud provisioning. It is owned by Red Hat. It integrates with numerous other famous tools for DevOps, including Jenkins, JIRA, Git and many others. The free open source version of Ansible is available on GitHub. Red Hat offers three paid versions—premium, standard and self-support—with prices that differ depending on the required level of support and number of nodes in production.

    Nagios

    Infrastructure monitoring is an area that has numerous solutions, from Zabbix to Nagios to various other open source tools. In spite of the fact that there are much newer tools in the market today, Nagios is a well-established monitoring solution that is highly efficient due to the large contributor community creating plugins for it. Nagios has the capability to deliver results in different visual reports and representations.

    SaltStack

    SaltStack is the paid enterprise version of Salt. Salt is a highly flexible, powerful and intelligent open source software for event-driven orchestration, cloud control, configuration automation and remote execution. It helps DevOps companies by orchestrating the effective movement of code into production and keeping the complex infrastructures tuned for optimal application delivery and business service. Saltstack orchestrates the value chain of DevOps and helps to deploy as well as configure dynamic applications.

    Chef

    Chef makes it possible to manage both traditional and cloud environments with one single tool. While maintaining high availability, Chef promises to accelerate cloud adoption. The chef development kit provides you with the tools you need to develop as well as test your infrastructure automation code from your workstation locally prior to deploying changes into production. On the Chef site, many technical resources and a lot of documentation is available including various resources designed to help organizations transition to DevOps and scale their implementations of DevOps.

    Docker

    You can expect portability with Docker, which is transforming IT environments. The portability is made possible via its special containerization technology, quite often found in self-contained units. It packages everything than an application is required to run: libraries, system tools, runtime, etc. Due to this, the applications can function the same way irrespective of their deployment location. A part of Docker known as Docker Engine is a tool responsible for creation and running of Docker containers. Another part of Docker known as the Docker Hub is a service application based on cloud encompassing the concept of application-sharing and workflow automation.

    Git

    Git has become incredibly popular in the recent years for managing the source code. It has become famous, especially as a site, for hosting open source projects. Because of the ease with which it handles merging and branching, it stands out from other version control management. Many DevOps teams utilize it for managing the source code of their applications. It has great pull request and forking features. It also consists of plugins that can link with Jenkins to facilitate deployment and integration.

    Hudson

    Hudson is a tool for managing and monitoring continuous testing and integration. The key features of Hudson include support for various systems for management of source code, application servers, code analysis tools, testing frameworks, build tools, real-time notifications of test failures, change set support and easy process for installation and configuration. A huge library of plugins is present that further extend its capabilities.

    Puppet

    No matter where it runs, Puppet promises a standard way of operating and delivering software. Puppet automates deployment to boost auditability, reliability and agility. The products of Puppet provide continuous automation and delivery across the complete software delivery life cycle. The latest version of Puppet features Node Manager and Puppet Apps, which help handle large number of dynamic, variable systems.

    Conclusion

    The world of DevOps is full of unique and outstanding open source tools. The above mentioned popular DevOps tools can help effectively bridge the gap between development and production environments when compared previously. You can opt for the tool that suits your business needs and can instantly observe the difference in your business operations. And not only do these different DevOps tools function well individually, they also play well together.

    If you’re looking to build out your toolset, consider open source DevOps tools in addition to proprietary software.

    — savaramravindra

  • Best of 2018: 5 Best Node.js Frameworks to Know

    Best of 2018: 5 Best Node.js Frameworks to Know

    As we close out 2018, we at devopsy.kinsta.cloud wanted to highlight the five most popular articles of the year. Following is the third in our weeklong series of the Best of 2018.


    When it comes to development platforms, the choices are wide and varied. It can be a difficult task choosing the right framework for your app, even for developers. For non-developers, the task can seem insurmountable. That’s why it’s important for app dev companies to educate their clients on the best development platform to fit the needs of their app. For most, it’s a matter of explaining the benefits and drawbacks of the many options.

    The Node.js environment, for example, has a number of different frameworks, each suited for a particular purpose. While developers need to know the technical details of each framework, clients really only need to know the factors that will impact their app.

    A Quick Node.js Explainer

    In the professional circles, much is spoken about Node.js and best Node.js frameworks as of the way to facilitate web apps development.

    What the client should know about Node.js: this is a special runtime environment used by the developers to create web apps. Its front-end (client-side) and the back-end (server-side) both can be coded using the same language: JavaScript.  Previously, those were two different areas to be dealt with different programming languages and by different developers, correspondingly.

    What to Know About Node.js

    Node.js is especially good for developing real-time apps intended for simultaneous connection of multiple users. However, it is not recommended for apps intended for complex computations.

    Some of the big names you know—Netflix, Trello, PayPal, LinkedIn, Walmart, Uber, Groupon, eBay, NASA—all use Node.js for their apps.

    Node.js offers myriad benefits to companies, including:

    • JavaScript belongs to one of the most popular programming languages—according to GitHub statistics, as of Q3 2017 JavaScript is the top programming language, with 22.5 percent of pull requests. That means will be no difficulty in finding an experienced developer;
    • Node.js’ popularity implies numerous ready-made solutions and contributions that can be used by developers for their apps;
    • Node.js gives the developers much freedom and space for creating a specific app;
    • Since the front-end and back-end are coded in the same language, only one programmer is needed;
    • Because of these factors mentioned above, development and deployment time is shortened and the app can reach the market in a short time;
    • Less search time, fewer developers and faster development mean lower costs.

    Who is behind Node.js?

    Node.js appeared in 2009 and now enjoys the support of the active and fast developing community. As of today, there are 8 million instances of Node.js, with more than 1,500 contributors and 39,672 stars on GitHub. Mark R. Hinkle, executive director of the Node.js Foundation, said his organization plans to Grow, Engage and Educate. So, the future app will have good prospects in terms of maintainability and eventual extension.

    Node.js Frameworks Worth Considering

    Express.js (35,310 Stars on GitHub)

    The classic of Node.js. appeared in 2010 and served as a basis for a long list of popular Node.js frameworks. It is considered to be minimalistic and simple. Express is not opinionated and offers the developers much freedom, as they can use various modules to build the app. Due to its flexible nature, it is best-suited for large-scale apps that are planned to be customized and extended and need long-term support.

    What should the client know about Express.js? Fast, simple, flexible

    Sails.js (18,088 Stars on GitHub)

    This framework used Express as a basis but is a complete product that can be applied as it is with the available functionality. It is suitable for fast launches. Sails is especially good for developing and setting the real-time apps requiring quick answers and is compatible with any front end.

    What should the client know about Sails.js? Complete, quick to develop, good for real-time apps

    Meteor (38,755 Stars on GitHub)

    This is a full-package popular Node.js framework that allows building real-time scalable web apps. It handles apps for any device (web, iOS, Android). With Meteor, developers can accomplish more job with less code. It suits as a perfect tool to start a project for all major platforms.

    What should the client know about Meteor.js? Full-stack, time-saving, universal

    Loopback (8,000 Stars on GitHub)

    This is a highly extensible modular framework. Loopback is specifically intended for quick and easy creating of API. It allows running the apps on-premises or in the cloud. Loopback works well for writing user’s authentication and authorization.

    What should the client know about Loopback.js? Easy and quick to develop as offers much out of box, suits for complex integrations.

    Hapi (8,701 Stars on GitHub)

    The framework appeared in 2011 and also is based on Express. It has since grown into the separate framework with a different approach: to provide as much as possible use cases out of the box. It is intended for large teams and large projects and will be too complicated for a simple app.

    What should the client know about Hapi.js? Configuration over code, reliable, time-saving due to focus on writing reusable app logic, large projects

    Bonus Framework: Koa.js (18,495 Stars on GitHub)

    This is a new-generation framework. Koa is created as lighter and more flexible version of Express. It suits both for large and small projects and provides for further customization and extension.

    What should the client know about Koa.js? Fast development, reliable app foundation, flexible

    Conclusion

    The list above should serve you in helping your clients decide which framework is best-suited for their project. Be sure to explain each framework in the simplest terms to ensure your customers understand the benefits and drawbacks of each. They will appreciate it.

    What frameworks would you add to the list? Please add them to the comments below!

    — Olga Nasonova

  • Best of 2018: 5 Open Source SIEM Tools Worth Checking Out

    Best of 2018: 5 Open Source SIEM Tools Worth Checking Out

    As we close out 2018, we at devopsy.kinsta.cloud wanted to highlight the five most popular articles of the year. Following is the second in our weeklong series of the Best of 2018.


    Security information and event management (SIEM) is the cornerstone of IT security. All other network solutions are merely data flows that feed into an organization’s SIEM. Not all SIEMs are created equal, and their capabilities can vary wildly. Choosing the right one for your needs can mean the difference between detecting a security weakness and becoming just another statistic.

    A SIEM solution is a combination of a security event management (SEM) system and a security information management (SIM) system. SEMs monitor servers and networks in real time, while SIMs store the data.

    Both SEMs and SIMs provide analysis. SEMs focus on real-time event correlation, alerting and those fancy network operations center (NOC) “something has gone wrong” dashboards that one may come across in the movies. SIMs focus on bulk data computational analysis (BDCA) of large quantities of logs.

    In other words, a SEM is designed to tell you when something is going down as it happens, and SIMs are designed to spot the subtle attacks that SEMs don’t catch. Merging the two into a SIEM solution seems like a natural fit.


    Related Content:

    The Value of Commercial Open Source

    How Developers Can Take a More Proactive Approach to Security


    SIEM stacks usually consist of at least three components for data collection, data storage and data analysis. The data in question is frequently log files, but can also be netflow traffic or other real-time data feeds.

    There are a number of SIEM tools on the market, both open source and commercial. With the rise of DevOps, containers and other modern application development methods, the open source solutions are seeing a resurgence of interest. Let’s take a look at some of the top open source SIEM tools out there.

    OSSEC

    OSSEC is a popular host-based intrusion detection system (IDS) that works with Linux, Windows, MacOS and Solaris, as well as OpenBSD and FreeBSD. OSSEC is composed of two components: the host agent (responsible for collecting the logs) and the main OSSEC application (responsible for processing the logs.)

    There is also a now-deprecated GUI, but since other open source solutions do a better job of data visualization, the OSSEC project recommends using those solutions instead. Popular open-source data visualization tools include Kibana and Grafana.

    OSSEC directly monitors a number of parameters on a host. This includes log files, file integrity, rootkit detection and Windows registry monitoring. OSSEC also can perform log analysis from other network services, including most of the popular open source FTP, mail, DNS, database, web, firewall and network-based IDS solutions. OSSEC can also analyze logs from a number of commercial network services and security solutions.

    OSSEC has a number of alerting options and can be used as part of automated intrusion detection or active response solutions. OSSEC has a primitive log storage engine. By default, log messages from host agents are not retained. Once analyzed, OSSEC deletes these logs unless the <logall> option is included in the OSSEC manager’s ossec.conf file. If this option is enabled, OSSEC stores the incoming logs from agents in a text file that is rotated daily.

    Whether OSSEC counts as a “full” or “proper” SIEM is the source of numerous internet debates. OSSEC does the hard work of a SIEM: It collects data and analyzes it. OSSEC is at the core of a number of other SIEM solutions, and part of any number of application stacks that pair OSSEC with a more advanced long-term log retention system and advanced visualization capabilities.

    Snort

    Snort is a popular network-based IDS. Network-based IDS systems differ from host-based IDS systems in exactly the way one might expect—while a host-based IDS lives on an individual server or endpoint, network-based IDS systems live further out on the network, and scan all traffic that they can see.

    Snort’s purpose is to sniff, log and perform real-time analysis on network flows. It can display a real-time stream of packets to a console, dump packets to a log file or perform analysis.

    Snort relies on output plugins to determine how and where it will store the information it generates. Snort can store this information in a flat text file, output to a database, a Unix Socket, a pager or cell phone and any number of other destinations.

    Snort has a number of filtering and pattern matching options. This means that snort doesn’t have to display, log or analyze all packets traversing a network link. It can restrict itself to information pertaining to a specific host or matching specific patterns—something that is of increasing utility as network throughput of 100Gbps on individual network links becomes more common.

    Configuring Snort requires careful planning. Dumping 100Gbps worth of packets to a flat text file isn’t the best plan, and most organizations aren’t exactly going to be able to afford to ship that kind of data off to a public cloud-based log repository, either. Judicious use of Snort’s filtering and analysis capabilities combined with output plugins are required to make Snort practicably useful.

    With a narrowly configured set of alerts, Snort’s ability to send alerts directly to a cell phone becomes meaningful. A broader set of filters could be used to pass data to a long-term storage repository for more in depth analysis by another tool.

    Like OSSEC, Snort relies on third-party solutions in order to perform visualizations. As one of the earliest network-based intrusion detection solutions available, there are a number of solutions (both open source and commercial) that exist only to visualize Snort data, making the lack of a built-in visualization system somewhat irrelevant.

    Like OSSEC, Snort’s qualification as a SIEM solution is somewhat debatable. Snort collects data and analyses it, and is a core component to more complete SIEM solutions. Snort is also part of any number of application stacks which add log retention and advanced visualization capabilities.

    It is not unusual to see Snort and OSSEC working together to each fill different niches in the grand scheme of data center SIEM needs. It is also perfectly normal to see them deployed independently, especially as part of cloud-native applications, where monitoring needs can be narrower.

    Suricata is a competing open source network-based IDS that is frequently used in place of Snort.

    ELK

    The ELK stack is arguably the most popular open source SIEM tool available, though, like OSSEC and Snort, there is room for debate about whether the ELK stack even qualifies as a SIEM on its own.

    The ELK stack consists of the open source products Elasticsearch, Logstash and Kibana. Logstash is a receiver for log data from virtually any source. It can filter, process, correlate and generally enhance any log data that it encounters.

    Elasticsearch is the storage engine, and is one of the best solutions in its field currently available. Kibana is the visualization portion of the equation, and it is hands down one of the best visualization system the open source community has yet produced.

    Logstash, a part of the ELK stack, uses input plugins to collect logs; however, it also can accept input from more purpose-built solutions such as OSSEC or Snort. Combined, the ELK Stack’s log processing, storage and visualization capabilities are functionally unmatched. The solution is powerful, but that power comes at the price of complexity and a high TCO. Cloud offerings such such as Logz.io offer a hosted ELK alternative.

    The ELK stack forms the core of a growing number of commercial SIEM offerings. These solutions bring expertise in standing up, configuring and managing the applications in the stack. They also may offer canned or easier-to-design filters for Logstash than are available in the native open source solution. Both approaches offer significant added value.

    Prelude

    Prelude is a SIEM framework that unifies various other open source tools. It is the open source version of the commercial tool by the same name. Prelude aims to fill the roles that tools such as OSSEC and Snort leave out.

    Prelude accepts logs and events from multiple sources and stores them all in a single location using the Intrusion Detection Message Exchange Format (IDMEF). It provides filtering, correlation, alerting, analysis and visualization capabilities. The open source version of Prelude is significantly limited when compared to the commercial offering in all of these capabilities.

    OSSIM

    If ELK isn’t the most popular SIEM, then OSSIM likely wins the crown. The open source version of Alien Vault’s Unified Security Management offering, OSSIM is a framework like Prelude. OSSIM combines its native log storage and correlation capabilities with numerous open source projects to build a complete SIEM.

    The open source projects included in OSSIM include FProbe, Munin, Nagios, NFSen/NFDump, OpenVAS, OSSEC, PRADS, Snort, Suricata and TCPTrack. The inclusion of OpenVAS is of particular interest, as OpenVAS is used both for vulnerability assessment by correlating IDS logs with vulnerability scanner results.

    Like Prelude, the open source OSSIM is not as feature-rich as its commercial sibling. Both solutions work fine for small deployments, but experience significant performance issues at scale, ultimately driving organizations towards the commercial offerings. Log management capabilities in the open source version of OSSIM, for example, are virtually nonexistent.

    Conclusion

    A complete SIEM solution includes the ability to collect information from various data sources, store the data long term, perform analysis on that data and visualize it in useful ways. There are no clear open source winners that deliver all capabilities.

    When selecting an open source SIEM you are either going to have to use feature and performance limited solution designed to drive organizations into the arms of a commercial solution, or you are going to have to combine multiple open source projects to achieve your goals.

    Consider the ELK stack as an example. On its own, the ELK Stack can be a high-quality SIEM solution. Its input filters include public cloud infrastructure monitoring capabilities the other open source solutions can’t match.

    That said, the more dedicated collection and analysis tools, such as OSSEC and Snort, can be far more powerful when dealing with on-premises solutions. These solutions can be combined. OSSEC and Snort can feed the ELK Stack, creating a more complete solution that meets the needs of the majority of organizations.

    Open source SIEM solutions—in whole or in part—are versatile and powerful. They require experience, expertise, and above all time to deploy properly. It is for this reason that commercial offerings dominate the SIEM landscape, even when open source tools lie at the core of those commercial offerings.

    Having 80 percent of your SIEM solution handled for you is better than having to do all of it yourself. Commercial solutions handle installation, basic configuration and provide filters, correlation configurations and visualisation designs for the most common use cases. Don’t underestimate the value of these commercial features: There are a seemingly unlimited number of things to monitor in today’s data centers, and none of us have time to manually configure applications to watch them all.

    — Daniel Berman

  • How Secure is Open Source for DevOps? 5 Considerations

    How Secure is Open Source for DevOps? 5 Considerations

    Open source libraries and frameworks have important roles to play in a DevOps culture that emphasizes shorter development life cycles, collaboration and innovation. However, it’s vital not to neglect the security of these open source components.

    This article discusses the use of open source in DevOps and gives you five things to consider in terms of the security of any open source project your teams might want to use in your software builds.

    Open Source and DevOps Overview

    Proprietary applications, many of which are developed within organizations that have adopted a DevOps approach, feature an average of 257 open source components per application. Furthermore, the average percentage of codebases that are open source within proprietary apps stands at 57 percent. It’s clear that open source fits well with DevOps in how it can help deliver quality software that can be rapidly updated and improved.

    In addition to the increasingly popular use of open source libraries and frameworks to deliver ready-made software components, quite a number of tools used in DevOps are actually open source. Examples of open source DevOps tools include Docker and Kubernetes.

    It’s crucial that development teams focus on security when using open source code, components and tools. Several of the most high-profile IT security and software breaches of recent times have resulted from vulnerabilities in open source components.

    To adequately combine security, open source and DevOps, there is a pressing need to shift left and secure the software development life cycle (SDLC), starting from the earliest stages of development.

    DevOps Open Source Security Considerations

    The Need For Security Automation

    An important driving force in achieving the aims of DevOps is to automate as much as possible. DevOps automation strategies include the use of technologies such as virtual machines and containerization to repackage applications into reusable blocks, many of which contain open source code. This high level of automation dramatically shortens the SDLC.

    However, because of this automation and the pace at which code changes and updates occur, security teams are easily left behind, and they might miss out on identifying open source vulnerabilities. InfoSec teams need to figure out ways of automating several of the most important security procedures, such as configuration checks, code analysis and vulnerability scanning. By introducing greater automation into security checks, it’s less likely that DevOps practices will lead to releasing software containing vulnerable open source components. Faster time to market combined with high-quality, secure code is the ultimate goal.

    Securing Open Source Using Open Source Tools

    Given that open source code forms the majority of the footprint of modern proprietary codebases, it makes sense to focus on the security of these libraries and frameworks first. Somewhat ironically, open source tools provide a good way to improve open source security in DevOps.

    For example, teams can use open source software management programs such as JFrog Artifactory to create binary local repositories of open source software libraries and code. These repositories give teams a single place from which they can use the latest versions of open source code that they have deemed to be secure.

    OWASP dependency-check is another useful open source tool for security teams that checks which components an application uses and whether such components contain known vulnerabilities.

    Incorporate Open Source Code-Checking Tools Into Development

    Part of the idea of shifting security to the left involves developers overcoming the inherent tendency to focus solely on application functionality without considering security. While training materials exist that teach the basics of secure apps, developers might find the material somewhat esoteric, particularly if it’s targeted toward InfoSec teams.

    One way to overcome developer resistance and shift security to the left is to integrate some open source code-checking tools into development environments. Tools such as Brakeman or Rubocop are freely available, and they can rapidly check code for common vulnerabilities.

    Hackers Targeting Open Source

    One of the difficulties with the increased use of open source is that hackers and cybercriminals are always aware of components that contain vulnerabilities. The hackers can then use this knowledge to specifically target companies developing software using those components.

    Cybercriminals know that DevOps emphasizes faster time to market, and they are always lurking to find those organizations that have become lax in their IT security checks. The Equifax data breach happened precisely because the company used a vulnerable version of the open source Apache Struts framework. The Equifax case exemplifies the potential danger of open source components in organizations where DevOps and InfoSec are out of sync.

    The Need for Policy and Governance 

    For DevOps and open source to work together to deliver secure software, there is a real need to create dedicated open source policies by DevOps organizations. When developers are given free rein to use open source libraries and frameworks without monitoring or documentation, vulnerabilities creep into applications and future trouble awaits.

    The first step is for organizations to recognize their reliance on open source before forming a governance policy that stipulates how to manage open source inventories to reduce security risks.

    Wrap Up

    Going forward, it’s clear that the open source model offers many advantages to DevOps teams in terms of achieving their goals.  Additionally, several open source tools can even enhance the security of the applications developed in DevOps. However, it’s prudent to understand the security concerns that lie at the heart of open source and shift security left so that any vulnerabilities can be found as early as possible in the SDLC.

    — Limor Wainstein

  • How DevSecOps Can Help Avoid Catastrophic Breaches

    How DevSecOps Can Help Avoid Catastrophic Breaches

    Earlier this year, Tesla’s Cloud was hijacked and used to mine cryptocurrency, exploiting a vulnerability in the company’s Kubernetes cluster. A mountain of FedEx data was recently exposed, affecting 119,000 individuals. The Equifax breach garnered international attention after an estimated 145.5 million Americans were jeopardized. In other news, we’ve reported on how the Vine Docker registry fiasco was hacked, leaving an embarrassing PR trail in its wake.

    What is common across all these scenarios? They arguably could have been avoided with basic safeguards underpinned by a healthy dose of DecSecOps. In hindsight, let’s see what specific strategies developers can adopt to avoid such horrendous leaks.

    Basic DevSecOps Can Prevent Vulnerabilities

    DevSecOps is described as placing security at the forefront of every action. Within the world of cloud tooling, this means instilling protection at every point of the build life cycle. You would think this equates to advanced container and orchestration security, powerful access management and establishing hardened oversight for internal applications, right? Actually, many modern exploits simply involve a lack of basic password protection.

    Case Study No. 1: Tesla Cloud Cryptojacking

    In mid–2018, Tesla’s Amazon servers were hijacked by malware and used to mine cryptocurrency for rogue agents. Similar cryptojacking has transpired at Gemalto, Aviva and others. According to RedLock’s report, the hackers infiltrated the Kubernetes console, which was not password-protected. In one pod, they found access credentials to Tesla’s AWS environment. The breach exposed sensitive telemetry data, though was limited to “internally used engineering test cars only,” according to Tesla.

    How to Prevent

    Password protection for Kubernetes administrative consoles is a readily apparent lesson here. All cloud accounts, even if used internally, must be better-equipped and access credentials sequestered. Surely, instilling a “security by design” mentality can help limit the number of such consoles left accessible.

    Case Study No. 2: Vine Registry Breach

    In 2016 a white hacker by the alias avicoder was able to infiltrate Vine, the video-sharing social network. The hacker used tools to discover subdomains and behind one—https://docker.vineapp.com—found an open Docker private registry that housed the Vine source code. Such a vulnerability could have been used to collect user details or inject malware for malicious purposes. Thankfully, no users were compromised, and the Twitter Bug bounty program awarded avicoder a handsome sum for the discovery.

    How to Prevent

    In this particular incident, there was nothing at fault with Docker or Docker containers. The service (which was meant to be private) was simply left public and devoid of access controls. The lesson is that URLs on the world wide web are just that—publicly exposed to the world. It does not matter if no documentation links to them; such subdomains are easy to discover with crawlers and will be exploited if found.

    Case Study No. 3: Equifax Exploits

    In the Equifax breach, millions of customer records were stolen. The Equifax report notes that hackers exploited a “website application vulnerability.” Further reports detailed that the 2017 breach utilized flaws in Apache Struts, likely through a zero-day exploit, according to the Apache Struts Project Management Committee.

    How to Prevent

    Some note that the deserialization of untrusted data inherent in Apache Struts applications leaves some major vulnerabilities and potentially malicious code execution.

    Containers, due to their short lifespan, are not persistent, therefore making consistent hacking harder. They can also isolate functionalities so as to decrease attack vector. Regarding the Equifax breach, Aquasec speculates that container usage could have lessened the impact:

    “… it’s likely that such a breach would have been more difficult with containers, and that if successful, it would have been less persistent, not as widespread, and mitigated sooner.”

    Some view containers as a formidable force if armed with behavioral analysis and firewalls for network connections. Still, others note flaws in assuming containers are safer.

    Regardless of architecture, In DevSecOps, security for customer data isn’t drafted into the background; rather, it is imbued into the entire tooling process and holds equal footing within each build.

    Instilling a DevSecOps Culture

    Instead of a build-now, secure-later attitude, DevSecOps seeks to elevate security into every decision. With each build, security is melded with greater forethought regarding the repercussions for how data is treated.

    Admin consoles for Kubernetes clusters must be armed and password-protected, and the same goes for private GitHub repositories or Docker registries. Any traversal of data through cloud SaaS services must have authorization in place. A most obvious lesson is to password protect those “hidden” registries with discoverable URLs.

    Bounty programs for white hackers continue to lead to successful bug detection. At least for these institutions, there is less evidence of compromised user data and remediation is quickened.

    Much of this can be distilled by due diligence and through breeding a culture of security. While that’s a little fluffy for some, it apparently still requires repeating for institutions that continually de-privilege these basic safeguards.

    — Bill Doerrfeld

  • Using Netflix’s HubCommander to Automate GitHub Organizations

    Using Netflix’s HubCommander to Automate GitHub Organizations

    Netflix owes a great deal of its exponential growth to its phenomenal tech stack. Throttling its content through a single internal API, the company was able to deliver content agnostic of device type and quickly disrupt its contemporary competitors in the consumer entertainment industry.

    We’re intrigued, then, when Netflix exposes some of its internal architecture for others to use. HubCommander is just one recent addition to Netflix’s growing collection of open source tools. It’s a ChatOps tool for GitHub management.

    We’ve previously covered an open source approach to ChatOps, tracking how to bring free operational tools into the conversation for increased transparency and efficiency. In this article, we’ll resume this research by learning how Netflix has utilized HubCommander and delve into its open source iteration to see how others might leverage it to automate its GitHub organization.

    Problems

    Managing many GitHub repositories while working in a large organization can be frustrating; especially difficult is the task of managing permission levels between various user subsets. Not only are various user permission levels difficult to trace, but there is an intrinsic security problem to address as well, especially when working with external teams.

    “One of the biggest challenges with using GitHub organizations is user management.” — Netflix

    Project managers need to administer different organizations, and GitHub requires admin privileges to manage such repository settings; if onboarding thousands of employees, editing this manually could be an extremely tedious job.

    Benefits!

    At Netflix, HubCommander standardizes its user management approach, enabling automation for GitHub repo permissions across development teams.

    “Management of many users on GitHub can be a challenge without tooling. We needed to provide enhanced security capabilities while maintaining developer agility. As such, we created HubCommander to provide these capabilities in a method optimized for Netflix.”

    HubCommander thereby provides this missing link, granting admins the ability to quickly grant privileges. Easily to embeddable into chat, the HubCommander is made with ChatOps in mind. Therefore, privileged GitHub organization management tasks can be performed from the Slack channel, “without granting administrative or owner privileges to your GitHub organization members.”

    Using HubCommander

    To use HubCommander, first, you must have Python 3.5+, Slack, a GitHub organization, and a GitHub bot user with ownership level privileges.

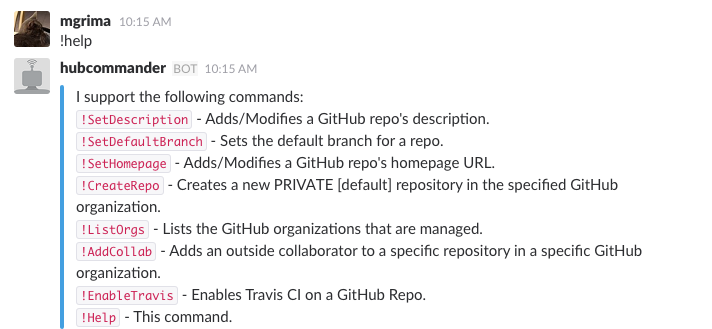
    Next, Slack channels with HubCommander installed can make the call !help to return a list of bot commands:

    Source: Netflix

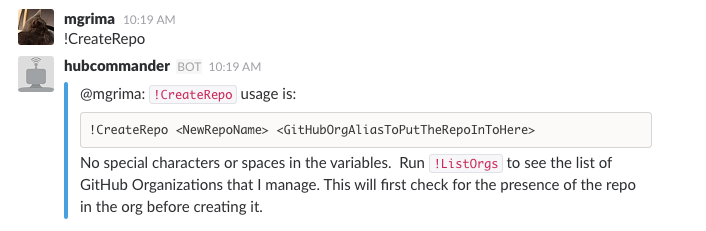
    To create a repo, for example, you can simply use the command !CreateRepo:

    Source: Netflix

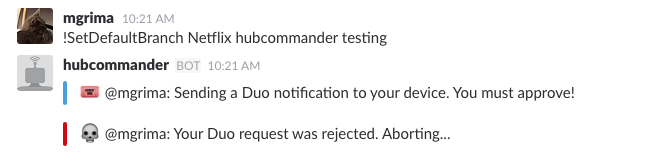
    Utilizing HubCommander also has security benefits as it reduces the number of GitHub API permissions granted per user—reducing attack vectors inherently increases security. Another point on security is HubCommander’s integration with Duo for additional authentication:

    Source: Netflix

    The total list of HubCommander features include:

    • Repository creation
    • Repository deletion
    • Repository description and website modification
    • Granting outside collaborators specific permissions to repositories
    • Repository default branch modification
    • Repository PR listing
    • Repository deploy Key listing/creation/deletion
    • Repository topics creation/deletion
    • Repository branch protection enabling/disabling
    • Enable Travis CI on a GitHub repo
    • Safeguard commands with 2FA via Duo

    Automating GitHub With ChatOps

    If your code resides in multiple Git repositories, like Netflix, having a method to configure permissions across all entities in a convenient way becomes a necessity. With a bot to perform operational tasks on GitHub repositories, Netflix is benefiting from automatic manipulation and a wider team access, adding to its agile goals:

    “The reduction in administrative overhead has significantly simplified our open source efforts.”

    Netflix operates with three development channels (a core Netflix OSS, Spinnmaker and a skunkworks project for new ideas). Thus, having a consistent permissions model across organizations can decrease friction. Also, since Netflix collaborates with third parties, such as contractors or other open source contributors, HubCommander also acts as an effective way to maintain security.

    Final Thoughts

    Netflix recognizes a growing popularity in the ChatOps approach and cites other benefits such as team transparency, a timestamp for each event and a self-service nature—all reasons for adopting a ChatOps strategy into its developer tooling.

    HubCommander appears like a good ChatOps tool for GitHub repository management. However, GitHub Actions (still in beta at the time of writing) is a new feature that will aid development workflows, offering automation for the GitHub operational duties themselves. This may spark alternative bots to be developed, especially in terms of workflows that respond to events.

    For now, with open source utilities such as HubCommander, certain GitHub duties can be quickened, stimulating a culture of more efficient management to decrease redundant tasks. While shorthand for GitHub repository management might not seem at first glance as a priority, it could scale down operational headaches tremendously.

    — Bill Doerrfeld

  • DataStax Announces DataStax Distribution of Apache Cassandra

    Continues Commitment and Engagement with Open Source Community with Industry-Leading Code Contributions, Coaching and Conference

     SANTA CLARA, Calif.–(BUSINESS WIRE)–DataStax, the leading provider of the always-on, Active Everywhere distributed hybrid cloud database built on Apache Cassandra™, today announced DataStax Distribution of Apache Cassandra (DDAC). DDAC is a new subscription offering designed for running a certified version of open source Apache Cassandra for development and production use cases that do not have the higher enterprise demands better served by DataStax Enterprise.

    The DDAC release reinforces DataStax’s engagement with the open source community. DataStax enables and supports data professionals who want to build applications on Apache Cassandra. DataStax does this by hosting frequent community events nationwide and by also hosting the premier Apache conference—DataStax Accelerate—where Cassandra practitioners, experts, and developers come to learn and share ideas.

    DataStax is now making it easier for professionals and enterprises to obtain and use the production-certified version of Apache Cassandra from DataStax.

    DDAC consists of a production-certified release of Apache Cassandra with drivers, bulk load utilities, and professional support. It combines the benefits of open source software with professional software maintenance and the expert support needed by customers who wish to deploy open source software in less critical production or development environments.

    Deploying DDAC enables enterprises to:

    • Apply premium features and performance with no lock-in while standardizing on open source software (OSS).
    • Scale environments and manage costs effectively to compete in a dynamic marketplace.
    • Streamline operations and support by removing a patchwork quilt of in-house, regional integrators or partners and third party vendors providing Apache Cassandra support and services.
    • Access the best-in-class Apache Cassandra software, support and services from the experts.

    “Many organizations are interested in using open source software when there are concerns about cost, vendor lock-in and availability of developer skills, but most organizations also want to use products that are backed by commercial support,” said Doug Henschen, Vice President and Principal Analyst, Constellation Research. “DataStax Distribution of Apache Cassandra addresses both concerns, building on open source software while leveraging the company’s experience and expertise supporting high-scale Apache Cassandra-based database deployments.”

    “We’ve put DDAC through rigorous testing to offer enterprises a production-ready release of Apache Cassandra with maintenance management and support from DataStax and our team of Apache Cassandra experts,” said Amit Chaudhry, Vice President of Product Marketing at DataStax. “We believe DataStax is the only company that has deployed the world’s best distribution of Apache Cassandra at hundreds of real-world enterprises. Our expertise, services, and support are unmatched in the industry when it comes to Cassandra.”

    DataStax Distribution of Apache Cassandra includes:

    • A certified version of Apache Cassandra that goes through the same rigorous quality assurance (QA) and certification testing process as DataStax Enterprise.
    • Business day, 8×5 support or 24×7 worldwide support.
    • DataStax Bulk Loader Utility for making data loads and migrations easy.

    “When enterprises deploy just open source Cassandra, we find that over time they run into security, support and compliance issues. DDAC solves this. Enterprises now have an option to deploy a production-certified release of Apache Cassandra with DDAC,” concluded Chaudhry.

    DDAC is available for download now at:
    https://academy.datastax.com/quick-downloads

    To learn more about DDAC, please join DataStax at DataStax Accelerate, The World’s Premier Apache Cassandra Conference, on May 21-23, 2019 in the Washington D.C. Area. To register, please visit https://www.datastax.com/events/datastax-accelerate.


  • Infosys Launches Open Source DevOps Project

    Infosys Launches Open Source DevOps Project

    Infosys has decided to make its DevOps platform—which consists of more than 2,000 prebuilt scripts and more than 150 pipelines spanning 70-plus tools involving more than 25 different classes of technologies—available as an open source project available via GitHub.

    Ravi Kumar, president and deputy COO for Infosys, said the global systems integrator has spent the last several years turning each element of its DevOps platform into a set of microservices based on containers that can now be deployed almost anywhere. That decision made it more practical for Infosys to then offer the up the entire DevOps framework it relies on to drive thousands of projects employing more than 200,000 developers as a single open source project, he said. That framework relies on an instance of the open source Jenkins continuous integration/continuous deployment (CI/CD) framework at its core.

    Each element of the Infosys DevOps platform can be consumed via a set of templates hat Infosys has developed. The goal is to reduce the amount of time any organization needs to spend developing that framework and processes required to accelerate any digital business transformation project, Kumar noted.

    To accelerate the development process, Infosys enables organizations to automate the promotion of any module without having to create any additional scripts. In addition, Infosys makes extensive use of encryption to make sure DevOps workflows are secure.

    Most recently, during the DevOps Industry Awards 2018 event, Infosys won awards for Best Overall DevOps Project in the finance, retail and communications, in addition to best automation project and most successful cultural transformation initiative.

    Kumar noted that DevOps is now integral to any digital business transformation initiative. Each organization today is required to significantly increase the rate at which applications are developed and updated to create a modern digital experience for customers, employees and business partners, he said.

    The single biggest hindrance when it comes to making the transition to DevOps within most organizations is a lack of tools and processes. Most organizations quickly become aware there is a chicken-and-egg relationship between tools and DevOps processes. Without the right set of DevOps tools, it becomes difficult to set up a DevOps process. But the tools in of themselves have no value without a set of well-defined processes in place. To enable organizations to address that issue in a holistic manner, Infosys developed the IT Process Enabler repository alongside a DevOps maturity framework.

    Most of the adoption of DevOps within most organizations has been driven by the bottom up by individual development teams resulting in adoption of DevOps that has been uneven at best. But as those individual DevOps initiatives become increasingly successful, there is now a lot of interest at the senior most levels of organizations in finding a way to drive DevOps processes across the entire organization. That requires a level of change process management that tends to proves too elusive for many organizations to achieve on their own.

    — Mike Vizard

  • IBM Acquires Red Hat to Create DevOps Behemoth

    IBM Acquires Red Hat to Create DevOps Behemoth

    In a move that has massive implications for DevOps teams across the enterprise, IBM today announced it is acquiring Red Hat in a deal valued at $34 billion.

    Red Hat will join IBM’s Hybrid Cloud group as a distinct independent unit. Red Hat will continue to be led by Jim Whitehurst and Red Hat’s current management team. Whitehurst will join IBM’s senior management team and report to IBM CEO Ginni Rometty. IBM intends to maintain Red Hat’s headquarters, facilities, brands and services practices.

    IBM expects to close the deal, which will be financed using both cash and debt, in the latter half of 2019. IBM also said the deal will be accretive within 12 months after close, as the combined entity moves to address a total market that spans application development and deployment, IT services and security and collectively exceeds $1 trillion, or more than one-fifth of the total global IT market valued at $3.7 trillion in 2018 by Gartner.

    IBM and Red Hat have had a partnership in place for 20 years, spanning everything from reselling and supporting Red Hat Enterprise Linux (RHEL) to collaboratively working on open source projects such as Kubernetes.

    IBM officials said they expect Red Hat to significantly bolster IBM’s hybrid cloud business, which already generates $19 billion a year in revenues. IBM noted that about 80 percent of application workloads have yet to move to the cloud.

    The move to acquire Red Hat comes on the heels of Red Hat acquiring CoreOS, which augments the company’s existing open source expertise with a container management platform built on top of Kubernetes.

    Once the deal is closed, IBM said the two companies will remain committed to open source software licensing, including initiatives such as Patent Promise, GPL Cooperation Commitment, the Open Invention Network and the LOT Network.

    IBM and Red Hat also plan to continue to build and enhance existing Red Hat partnerships, including those with major cloud providers Amazon Web Services, Microsoft Azure, Google Cloud, Alibaba and others that compete directly with IBM Cloud.

    It’s too early to say to what degree those cloud service providers will be open to continuing to work with Red Hat as unit of IBM. In recent months Red Hat increasingly has been positioning itself head to head against VMware, which operates as a unit of Dell Technologies. IBM also has a strong relationship with VMware that could change in the years ahead. What is clear, however, is that any deal of this magnitude usually begets others in very short order.

    — Mike Vizard