Tag: open source

  • Open Source: What IT Pros Wish the CIO Knew

    Open Source: What IT Pros Wish the CIO Knew

    Using DataOps and open source together, organizations can reimagine the way they deliver data and software-driven projects

    Real-time data is the fuel that powers today’s most critical systems and applications, as well as the digital transformation initiatives organizations need to compete effectively. For the people on the front lines building them, having the right technology alone is not always enough to succeed. To make the most of these game-changing technologies, you also need the right tools and the right strategy in place.

    If you’re not maximizing use of real-time data, you’re at risk of being disrupted by a competitor. For this reason, C-level leaders often adopt cutting-edge open source technologies that come with risks, making real-time data applications complex to build, deploy, operate and govern, and require a major investment in time and resources upfront to unlock their potential. You won’t get the most out of open source unless they can be operated and data can be accessed by a wider range of people outside engineering.

    For example, open source data technology is often lacking, and documentation is sometimes sparse at best. You may need to ask your data and platform engineers to spend weeks or even months building custom management tools before you can get to work on your first streaming application. That kind of delay can seriously impact your time to market.

    How Secure is Your Solution?

    Streaming data projects with multiple open source components can also introduce security and compliance issues into the picture. Even if you’re working with the very latest technology, open source often lacks built-in capabilities for security and compliance—especially if they are industry-specific for use cases such as health care or financial services. In fact, a recent survey by Veracode found that 70% of applications have open source security flaws, and 47% of those flawed libraries end up in code indirectly. If your project suffers from increased risk due to security and compliance issues, it can also lead to additional delays in projects, further slowing your time to market.

    In a world where the threat landscape is constantly evolving, your organization may wish to opt for a commercial offering for some types of use cases, especially if it includes the features you need to align with very specific compliance and governance needs.

    Creating a Culture of Engagement

    Arming IT professionals with the right tools and technologies they need is essential, but organizations also need to be sure they have a strategy in place to retain the best people—and keep them productive and satisfied. Fostering a workplace with the right level of engagement can provide a strong start. A recent Forbes article cited studies finding that highly engaged employees result in 21% greater profitability. On the other hand, the same article reported that 67% of employees reported feeling burned out at work—and were 2.6 times as likely to be looking for a different job.

    Open source tools are a great way to attract talented engineers because people love working with the latest technology. But as you give your IT professionals access to bleeding-edge capabilities, the complexities and time spent working with them increase. The right tooling can help manage the shortcomings of these technologies and help retain the talent you need by encouraging a positive work-life balance and lead to more successful implementations. If your engineering team isn’t spending time fighting fires and consumed by open source technology, there’s more time to focus on bigger picture issues such as a well-defined career path that keeps team members engaged and more valuable to the business in achieving its goals. With the right level of work-life balance and keeping employees involved and satisfied on the job, you can be more confident that your best engineers will become more than technologists and are strategic business partners who won’t be spending their spare time dusting off their resumes.

    Getting the Best of Commercial and Open Source

    How can you enable IT professionals with the tools they need to deliver their projects on time and on budget while empowering them with a more strategic role? Employing a DataOps approach to your initiatives can provide a strong start. Spanning many disciplines and skills across the organization, DataOps encourages an environment where people can collaborate, reduce process complexity and fully optimize the use of their data. DataOps allows teams outside of IT and engineering to operate their data directly, without being dependent on a small engineering team. It enables business stakeholders in your workforce to get closer to data and bring their own knowledge and context to data initiatives and improve business outcomes.

    For example, leading social and mobile gaming company Playtika needed to provide better visibility data streaming across Apache Kafka, its primary platform for the exchange of information between its microservices. Using a DataOps approach and platform, the company provided its analysts, product owners, operations and developers access to a fully audited GUI and CLI to explore and operate data in a compliant way without relying on data or infrastructure engineering. Providing direct access to data enables 600 developers to save 30 minutes a day as they work on delivering new features—which led to faster and more innovation when it came to developing new games.

    When utilized together with a commercial solution based on open source roots, DataOps helps you get your business and technical people on the same page, so your organization can achieve closer alignment to strategic business objectives, with data serving the business. At the same time, you can free up technical staff and developers from tasks such as tooling, and enable them to utilize open source for R&D and other innovative priorities.

    Using a collaborative DataOps strategy, your organization can reimagine the way it delivers data and software-driven projects, while also embracing new open source technologies.

  • CD Foundation Embraces Ortelius to Manage Microservices Deployments

    CD Foundation Embraces Ortelius to Manage Microservices Deployments

    The Continuous Delivery (CD) Foundation has added the open source Ortelius platform for managing the deployment of microservices as an incubation level project.

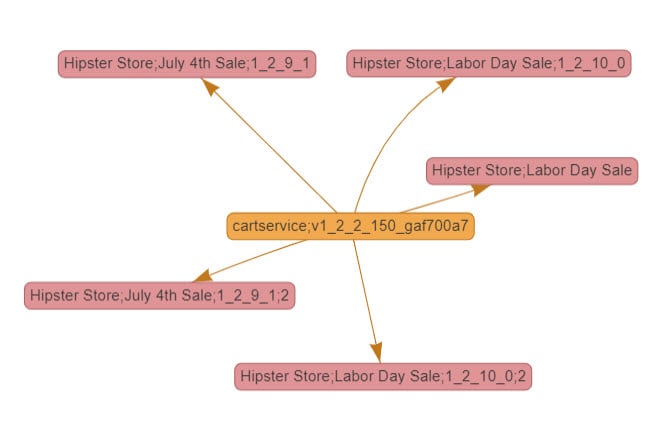
    Originally developed by DeployHub, Ortelius was created to provide a means to automate configuration at the application level. It also provides a central catalog of services that makes it easier to consume and deploy services across clusters that also tracks application versions and dependencies as updates to services are made.

    DeployHub CEO Tracy Ragan said Ortelius is now being donated to the CD Foundation, an arm of the Linux Foundation, which is working to create de facto continuous delivery standards. As such, Ortelius will benefit from contributions from other members of the consortium that includes Google, CloudBees, CircleCI, JFrog, IBM, GitLab, Netflix and DeployHub.

    The core CF Foundation projects are the open source Jenkins continuous integration/continuous delivery (CI/CD) platform; Jenkins X, an open source CI/CD solution on Kubernetes; Spinnaker, an open source CD platform; and the Tekton specification for building CI/CD components.

    Ortelius already integrates with CD orchestration tools and deployment tools such as Helm, Ansible and Spinnaker. The opportunity now is to address the entire application development life cycle of cloud-native applications using a GitOps methodology, said Ragan.

    While in theory the rise of Kubernetes should make it easier to automate CD processes across multiple platforms, Ragan noted that in practice there are still substantial differences between instances of Kubernetes that will require tools to automate the rollout of microservices across multiple clusters. Ortelius allows IT teams to logically manage groups for microservices as a single entity in much the same way IT teams manage monolithic applications as a single entity, she said.

    Ragan also noted that not all microservices are of equal value, so different approaches to managing them are required based on the number of dependencies they have and the value of the microservices to the business. As it becomes apparent IT teams will soon be managing perhaps thousands of microservices, the need for a standard approach that integrates with multiple CD platforms becomes more acute. In fact, she said, IT teams are approaching a new era when chaos engineering principles will need to be applied to the management of microservices.

    Longer-term, Ragan said Ortelius will also make it feasible to employ machine learning algorithms to provide predictive analytics that can be used to optimize the microservices environment. That capability eventually will provide a critical capability for managing microservices at scale. It may also serve to further the adoption of best CD practices that thus far have proven elusive to achieve in IT environments where each platform has unique attributes that make automating application delivery challenging regardless of what type of application is involved.

    In the meantime, IT organizations are being invited to contribute to the Ortelius project, now that it’s part of the CD Foundation. The more contributions that are made, the sooner the Ortelius platform graduates, which can’t come soon enough for many organizations that have already invested in microservices.

  • InfluxDB to Revamp Storage Engine for Time-Series Database

    InfluxDB to Revamp Storage Engine for Time-Series Database

    InfluxData has launched an open source InfluxDB IOx project that it said will become the foundation for the next generation of the company’s time-series databases.

    At the same time, the company has made InfluxDB Open Source 2.0 generally available. This version of the company’s database comes in the form of a single binary that makes it easier to secure.

    InfluxDB Open Source 2.0 also provides access to Data Explorer visualization tools as well as a lighter-weight Flux query language purpose-built for time series data.

    InfluxData CTO Paul Dix said while improvements are still being made to the existing database offering, the time has come to start working toward addressing a number of issues via a new project anchored around a storage engine that will make it possible to query petabytes of data across thousands of servers. The InfluxDB IOx project will address that issue by eliminating current restrictions on cardinality, data size and cluster size that are inherent in the current platform, he said.

    The InfluxDB IOx project is written in the Rust programming language and incorporates Apache Arrow, an open source in-memory analytics engine that incorporates a columnar data store that is being advanced under the auspices of the Apache Software Foundation (ASF). That approach will also make it possible for InfluxDB to natively support SQL along with InfluxQL and Flux query languages.

    The current plan is to make InfluxDB IOx an optional storage backend in a future point release. By the latter half of next year, InfluxData plans that InfluxDB Enterprise customers will have a commercially supported version of InfluxDB IOx and InfluxDB Enterprise. InfluxDB IOx will have its own builds and can be run separately. In effect, Dix noted, InfluxDB IOx will make it easier to separate compute and storage requirements.

    Dix said that while InfluxDB has served as the foundation that enables a wide range of monitoring tools to collect data in real-time, current cardinality limits that impact the number of tables that can be joined requires a new approach to add support for distributed tracing capabilities required to observe microservices-based applications. The IOx version will also employ object storage platforms to reduce the total cost of ownership while making it possible to address the requirements of distributed computing environments that now include a wide range of edge computing platforms, he noted.

    The decision to embrace Apache Arrow also opens the platform to end users who prefer to work with SQL and other scripting languages, he added.

    It may be a while before observability tools that leverage InfluxDB IOx find their way into DevOps tools. However, it’s clear that time-series databases will evolve to meet the requirements of cloud-native applications that will be based on large numbers of microservices spanning distributed computing environments. The only issue is to what degree the current rate of deployment of these applications might outpace the current ability of InfluxDB to keep pace.

  • Dynatrace Adds to Observability Capabilities

    Dynatrace Adds to Observability Capabilities

    Dynatrace today announced it has extended its observability capabilities via the launch of its PurePath 4 platform that adds support for the open source OpenTelemetry framework and W3C Trace Context specification for distributed tracing.

    In addition, the company is adding support for service meshes and serverless computing frameworks running on Amazon Web Services (AWS), Microsoft Azure and Google Cloud Platform.

    Alois Reitbauer, chief technology strategist for Dynatrace, said by adding support for open source tools to gather metrics, the total cost of achieving observability is being driven lower at a time when a transition to microservices-based applications is making the need to observe applications more crucial than ever.

    Dynatrace is adding support for OpenTelemetry and W3C Trace Context to a platform that has already supported distributed tracing since 2006 via its OneAgent software. Dynatrace is now becoming the latest provider of observability tools to embrace open source software to instrument applications as part of an effort to focus engineering efforts on advancing analytics capabilities.

    In the case of Dynatrace, those capabilities are driven by a Davis artificial intelligence (AI) engine embedded within the Dynatrace platform and SmartScape continuous topology mapping technology. The combination of those technologies makes it possible for Dynatrace to automatically discover changes to IT environments and surface the root cause of any issue that might arise, noted Reitbauer.

    Despite being widely available via application performance monitoring (APM) tools, distributed tracing is now coming into vogue. As application environments become more complex, there is a need to more deeply analyze events to discover the root cause of an outage or performance issue.

    The challenge has been that applying that level of instrumentation to applications has been costly. Many IT organizations have historically limited the use of APM tools to their most mission-critical monolithic applications. It’s also worth remembering that three-tier applications are easier to troubleshoot because the potential source of any issue is probably already well-known to the IT team, he added.

    Given all the dependencies that exist between microservices, however, Reitbauer said the need to understand what’s occurring within an application environment more deeply is becoming a bigger requirement.

    Observability, of course, has always been a core tenet of best DevOps practices. The level of observability depth required by DevOps teams has tended to vary widely. Increased adoption of microservices-based applications invariably will push more IT organizations toward embracing DevOps at increasing levels of sophistication and maturity.

    In the meantime, the observability wars among platform providers are intensifying. There’s no shortage of options to achieve that observability, so it will be up to each IT team to decide which platform might best suit their DevOps workflow. Dynatrace is betting that as more applications become instrumented, deciding which platform to employ will shift closer to the AI capabilities that enable issues to be resolved issue faster regardless of what type of application is deployed rather than the capabilities of the agent software employed to instrument applications.

  • Open Source Software and the Tragedy of the Commons

    Open Source Software and the Tragedy of the Commons

    With many eyes looking at code, “All bugs become shallow,” as software developer and author Eric Raymond called Linus’s Law in action. This is one of the reasons behind the popularity of open source: the volunteer communities working to improve and update the code.

    And according to a Purdue University study, Linus’s Law does, in fact, work. Open source communities regularly issue patches faster than their proprietary software counterparts. However, Linus’s Law only works when there are enough eyes on the code. And there’s no guarantee that the community behind any given open source project will continue maintaining the code.

    Of the 1,200+ codebases examined for “2020 Open Source Security and Risk Analysis” (OSSRA) report, 88% contained open source components that had had no development activity in the last two years.

    Now let’s take a trip back in time to glean a few lessons that history has offered. You see, in the early 19th century, “free lunches” were a popular saloon promotion. Patrons had to buy a beer (or drink or alcoholic drink of their choosing) to wash down whatever food the barkeep offered. And there’s the catch.

    Profits on whiskey and beer sales more than compensated the saloon for putting out the free lunch spread, which often was little more than soup, crackers and problematic pickled eggs. There’s a price for everything—whether evident or not.

    With popular open source code, this price of a free lunch has increased the pressure on those maintaining it—those who handle bug reports, feature requests, code reviews, code commits, etc., for their so-called “free” software. Increasingly, as open source grows in popularity, the price of free lunch has been developer burnout and the abandonment of their open source projects.

    It’s the tragedy of the commons in action—a resource growing so much in popularity that it can’t remain viable unless the community shifts to sustenance rather than exploitation. Witness the Twitter thread started by James M. South, creator of several popular open source solutions, who bemoaned the fact that, “#ImageSharp passed 6 million downloads this weekend and I’m a lot less happy about it than I probably should be.”

    South goes on in several follow-up tweets, “Over 5 years of development there have only been 98 collaborators, 23 of which have made more than 10 commits. … It’s not about money, it never was and never will be, it’s about sustainability.”

    Too few people—and their organizations—who rely on open source software are contributing to the projects they use. If you’re a developer and have a favorite open source component, you can contribute to its development through development, sharing your modifications, bug reporting, crowd-funding, letting the developers know how you are using it and helping others get started. That last may be the most important thing you can do for any open source project—helping build a user community large enough to sustain the project.

  • Logz.io Embraces Jaeger for Distributed Tracing

    Logz.io Embraces Jaeger for Distributed Tracing

    Logz.io announced at its online ScaleUp! 2020 conference announced today it has added support for open source Jaeger distributed tracing software to its observability platform based on a curated instance of open source Elasticsearch, Logstash and Kibana (ELK) software.

    Logz.io CTO Jonah Kowall said support for Jaeger extends the reach of the open source platform by enabling the platform to consume data generated by Jaeger agent software, which is now being deployed more widely to instrument complex distributed computing applications.

    Jaeger, which is being developed under the auspices of the Cloud Native Computing Foundation (CNCF), is finding traction among DevOps teams who are deploying microservices-based applications based on containers, which tend to have a lot of dependencies that are challenging to monitor and troubleshoot.

    A survey of more than 1,000 DevOps and software development engineers conducted by Logz.io finds 50% of respondents have half their applications or more running in containers, with 38% using service meshes and 33% employing serverless computing frameworks. The survey also finds 87% of respondents view their main observability challenges to be Kubernetes, microservices and serverless frameworks. The most common Kubernetes difficulties cited are monitoring and troubleshooting (44%), followed by security (35%), networking (34%) and cluster management (30%).

    More than a quarter of respondents (26%) said they already make use of distributed tracing, with 68% reporting they expect distributed tracing to play an important role in their observability strategy. Nearly two-thirds said they expect to implement distributed tracing in the next two years, with 91% of respondents reporting they already employ two or more observability tools. The most commonly used tools are log management and analysis (90%) and infrastructure monitoring (78%).

    Just over half of respondents (56%) also noted that more than half their infrastructure now resides in the cloud, with 42% noting that cloud now accounts for more than 75% of their infrastructure. Amazon Web Services (AWS) is the most widely used cloud (66%), followed by Microsoft Azure (12%) and Google Cloud Platform (11%).

    Kowall said that while interest in employing ELK along with visualization tools such as Grafana is rising to reduce the overall cost of observability, IT organizations are also making it clear they don’t want to integrate an ELK stack themselves. Most IT organizations would prefer to focus their efforts on building and deploying applications rather than maintaining an observability platform.

    The rise of microservices clearly is forcing the observability hand of more organizations. Most application performance management (APM) tools use has been limited to mission-critical monolithic applications because of the cost of deploying proprietary agents and platforms. Open source platforms now present an opportunity to observe both microservice and monolithic applications at a time when the overall IT environment has become much more difficult to manage.

    There is, of course, no shortage of options when it comes to achieving the observability of IT environments. The challenge now is determining how much observability is actually required and at what level of acceptable cost.

  • The Value of OpenTelemetry in Observability

    The Value of OpenTelemetry in Observability

    As infrastructure becomes more complex, the quest for better observability continues. With increased containerization, third-party applications and generally increased network complexity, it becomes difficult for organizations to track issues of stability and performance. But OpenTelemetry can be used to improve upon observability throughout a network by enhancing and consolidating reporting throughout all applications and services.

    So, what is OpenTelemetry and how can it help your organization’s processes? Here’s what you need to know.

    What is OpenTelemetry?

    OpenTelemetry is a Cloud-Native Computing Foundation (CNCF)-curated open source set of libraries, agents and components designed to increase the visibility of services. Through OpenTelemetry, organizations are able to better collect telemetric data for the purposes of debugging and management. A scalable, flexible solution, OpenTelemetry is able to adjust to organizations as they continue to grow.

    With OpenTelemetry, data is collected through:

    • Metrics
    • Distributed Traces
    • Resource Metadata
    • Logs

    The data is then sent to back-end platforms such as Jaeger or Prometheus for processing. All of this together enhances observability for the organization, making it easier for an organization to collect the data it needs to observe and mitigate issues appropriately.

    Greater levels of observability improve an organization’s reliability and reduce downtime. With better reliability, organizations are able to track down and resolve incidents much faster. Before the OpenTelemetry solution, developers might have used OpenCensus, OpenTracing or other similar products. While these products are excellent on their own, they don’t necessarily meet all the needs of modern networks.

    How Does it Work?

    OpenTelemetry works on three major observability systems: tracing, metrics and logging. For tracing, OpenTelemetry makes it easier to identify failures and performance issues by tracking requests within the system. For metrics, processes running within the system are closely tracked and reported on, with histograms, gauges and other easy-to-read graphical reporting. For logging, application-specific messages can be analyzed.

    Observability throughout a system has always relied upon tracing, metrics and logging. But it’s more difficult to complete tracing today because each action needs to go through so many layers of application and resources. When paired with vague log data, the process of tracking down a single incident can take hours, because the information isn’t always consistently siloed. OpenTelemetry (and other similar products) work to correct this by creating a consolidated system by which metrics, tracing and logging can be brought together.

    As an open source project, OpenTelemetry is available on GitHub for those who want to be a part of the community to influence and improve it. Of course, OpenCensus and OpenTracing are also open source solutions.

    So what’s the difference between OpenTelemetry, OpenCensus and OpenTracing? When should one be used over the other? And can they be used together?

    OpenTelemetry vs. OpenCensus

    Let’s take a look at OpenTelemetry versus OpenCensus. Both are used to boost observability, but they are generally mutually exclusive platforms because they each tackle the issue of observability from different angles. OpenCensus provides distributed tracing and time-series metrics from applications via a collection of libraries. Applications need to download a metrics exporter, and which one is used depends on the application microservices involved. OpenCensus will collect trace data, but OpenCensus will also collect time-series metrics. OpenTelemetry is used to connect OpenCensus and OpenTracing, providing the benefits of both. This creates a far more robust observability solution.

    OpenTelemetry vs. OpenTracing

    OpenTelemetry versus OpenTracing is similar to OpenTelemetry versus OpenCensus. OpenTracing also solves the same problems as OpenCensus but is usually mutually exclusive. OpenTracing is a specification for tracing APIs rather than library. Developers are able to either create their own tracer or use the OpenTracing version. OpenTracing is often faster and easier to deploy and use, but may not provide as robust analytics or metrics as OpenCensus. But again, OpenTelemetry makes it possible to use both OpenTracing and OpenCensus at the same time, through its consolidated libraries and support.

    OpenTelemetry is an ideal technology for organizations that want to increase their observability. Through OpenTracing, developers are able to achieve greater levels of visibility throughout the network; track metrics and performance; and react to issues within the organization swiftly and more accurately.

    While in the past developers may have been limited to either OpenTracing or OpenCensus, today developers are able to use OpenTelemetry for both function sets. Even better, since it remains an open source solution, developers are able to contribute to the OpenTelemetry community.

  • AppDynamics Expands APM Data Consumption

    AppDynamics Expands APM Data Consumption

    AppDynamics, a unit of Cisco Systems, this week extended the observability capabilities of its namesake application performance management (APM) platform to ingest data from open source tools and agentless services alongside metric collected via its agent software.

    At the same time, AppDynamics has added a Cloud Data Collector that automatically captures data from public cloud services generated by tools such as Amazon CloudWatch from Amazon Web Services (AWS).

    Finally, AppDynamics has added a visualization interface optimized for monitoring cloud-native applications and integration with Cisco’s Intersight Workload Optimizer tool, which organizations can employ to better optimize IT infrastructure resources usage to reduce costs across a hybrid cloud computing environment.

    AppDynamics CTO Ty Amell said the need for deeper levels of observability into IT environments has become more pronounced in the wake of the COVID-19 pandemic. Organizations have launched multiple digital business transformation initiatives that depend on the ability to correlate events occurring in IT environments in real-time. To provide that capability AppDynamics has been investing in machine learning algorithms to analyze data that can now be more easily collected, he said.

    Cisco, meanwhile, has been investing in various machine learning technologies to automate the management of compute, networking and storage infrastructure, which Amell said also serves to provide deeper insights into the overall IT environment when combined with the AppDynamics platform.

    The shift toward a more holistic approach to observability justifies Cisco’s acquisition of AppDynamics, which provides a widely used APM platform. However, much of that shift is being made by DevOps teams, where roles tend to be a lot more conflated than in traditional IT environments. Nevertheless, Amell noted the shift will continue to accelerate as IT organizations realize they can also reduce costs by rationalizing legacy monitoring tools.

    As IT environments continue to become more complex, there’s no doubt the tolerance for spending days and sometimes weeks navigating multiple tools to uncover the root cause of an issue is declining. It’s especially frustrating when the root cause of an issue turns out to be something trivial that can be fixed in a few minutes.

    Of course, it will be up to each organization to strike a balance between observability and automatic remediation of an issue uncovered by an observability platform. Many IT teams prefer to review changes before they are applied.

    Regardless of their level of comfort with automation, the amount of metrics, logs and traces that can be collected and analyzed has increased dramatically. As more of that data is collected, the more precise the observability platform becomes. The challenge now is finding the most efficient way to instrument an IT environment as the number of platforms running either monolithic or microservices-based applications continues to expand. In fact, at this point collecting all the relevant data is still often a bigger challenge than analyzing it.

  • Applitools Integrates Testing Platform With GitHub

    Applitools Integrates Testing Platform With GitHub

    Applitools announced today that its test automation tools have been integrated with GitHub and GitHub Actions in addition to being available on the Microsoft Visual Studio App Center.

    Company COO Moshe Milman said these integrations make it possible to add testing tools that incorporate machine learning algorithms, dubbed Visual AI, to a DevOps workflow using the Applitools Eyes testing platform. Those tests are run on a cloud platform dubbed Ultrafast Grid.

    The goal is to make it possible to easily correlate code changes across different versions of updates to web and mobile applications using any testing framework and programming language, said Milman. Visual AI can now be applied to every build and pull request, he noted.

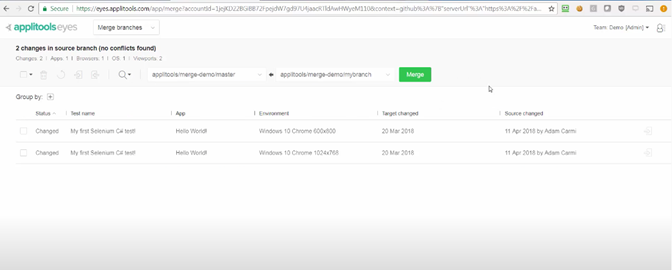
    When feature branches are created, Applitools instantly mirrors those feature branches to create a new set of baseline images. That approach simplifies the automated testing of all feature branches without impacting the trunk and its tests, he said, noting as pull requests are merged back in, the integration automatically updates the target branch with the source branch’s baseline images in a way that ensures no conflicts exist between branches.

    The Applitools approach to AI testing also provides developers with more control based on the application use cases, he added. For example, different settings can be applied to test a medical application that requires perfect alignment of pixels versus an e-commerce application that may not require as much fidelity. Developers can then resolve regression issues by employing root cause analytics.

    In general, Milman said the number of organizations that are applying DevOps processes now to the development of both web and mobile applications is increasing. Mobile applications are core to digital business transformation initiatives that have accelerated in the wake of the COVID-19 pandemic. Many of those applications are being built using components that typically are shared through repositories such as GitHub, which Milman noted creates the imperative to integrate testing tools with code repositories and other DevOps platforms.

    It’s still early days as far as applying AI to application testing is concerned. However, it’s now more a matter of when versus if organizations will be relying more on AI to test applications. As the number of testing platforms that include AI capabilities expands, each IT team will need to evaluate which approaches provide the most accurate testing.

    Nor is it clear to what degree AI might reduce the need for dedicated application testing teams. More responsibility for testing applications has been shifting left toward developers for several years now. Nevertheless, an independent test review of an application before it is deployed is always a good idea. AI capabilities in testing tools should reduce the most common mistakes the developers seem to make regularly.

    As part of an effort to make it tools more widely accessible, Applitools also makes Applitools Eyes along with its GitHub integrations available for free for open source projects hosted on GitHub that sign up to be part of Applitools’ open source plan.

    Regardless of how DevOps teams gain access to those tools, the future of application testing promises to be a lot let less monotonous.

  • Grafana Labs Looks to Simplify Observability

    Grafana Labs Looks to Simplify Observability

    Grafana Labs, at its online ObservabilityCON conference today, unveiled a distributed tracing platform dubbed Grafana Tempo that makes it possible to leverage existing object storage platforms and services to analyze traces.

    At the same time, Grafana Labs announced version 2.0 of Loki, which normalizes different structured, unstructured or JSON log formats in a way that allows DevOps teams to extract additional labels as well as enable additional filtering and grouping. IT teams are also not required to define labels in advance and store those labels in the database.

    A Loki 2.0 query can also be used to directly generate an alert statement using a new distributed rules evaluation engine. Previously, Loki would have to have been configured as a Prometheus data source, which then would allow the distributed instance of Prometheus, dubbed Grafana, to generate alerts.

    Tom Wilkie, vice president of product for Grafana Labs, says Loki 2.0 also serves to make the database employed to observe events in real-time smaller, resulting in faster queries. The result is an approach to analyzing log data that is significantly less expensive than legacy platforms, he said, noting DevOps teams should expect to see Grafana Labs also use Loki to address security use cases.

    Wilkie said both Loki and Grafana Tempo are intended to reduce the barriers to achieving observability in a way that doesn’t require nearly as much time, effort and skills on the part of a DevOps team. Grafana Tempo supports the same Tempo data discovery engine employed by Loki and the open source Prometheus monitoring platform and the Grafana platform built on top of Prometheus. That level of integration makes it easier for IT teams to narrow in on a specific trace using open source tracing protocols such as Jaeger, Zipkin and OpenTelemetry. Users of the platform can jump from log to trace and back again easily, he said.

    There is also no need to set up and maintain a separate index that IT teams must maintain, Wilkie added. In addition, Tempo is compatible with object storage systems commonly found on cloud services, so the total cost of achieving observability drops significantly compared to platforms that rely on a proprietary database, he said.

    Despite observability being a core tenet of DevOps, it remains an elusive goal for most IT organizations. There is no shortage of tools for monitoring individual applications and systems, but aggregating all the data the tools generate into actionable intelligence requires a significant amount of time and effort. Loki makes it much easier to analyze the relevant logs at the right time in a way the average IT administrator can navigate without having to become a superuser of more complex platform, said Wilkie.

    It’s too early to say how the observability wars will play out. The good news from an IT perspective is at least now there is no shortage of options.