Tag: IT observability

  • Transforming Observability

    Transforming Observability

    Walking into an unfamiliar operations center some time ago, I immediately noticed database error alerts racing down the primary monitor faster than a Matrix screensaver morphs letters. Strangely, no one seemed particularly excited about it. The situation was a head-turner for me, coming as I did from the “everything must balance” banking world.

    A senior ops tech quickly explained that airline reservation systems are highly optimized for speed and volume, sacrificing nearly everything else to meet peaks. “No worries; the agents just hit Enter again. Retry logic just slows us down,” they told me. The lesson here was removing constraints can profoundly change a system, much as Dr. Eliyahu Goldratt described in his game-changing Theory of Constraints.

    Today, cloud-native architecture, multi-cloud and hybrid cloud platforms, dynamic infrastructure-as-code (IaC), DevOps and our ability to store boundless amounts of data each change or remove constraints in their own way. Observability could be on this list, but I think observability’s transformation is still happening right in front of us.

    Observability and OpenTelemetry

    Through open source OpenTelemetry (OTel), highly competitive vendors collaborate to shift their offerings up the value chain by supplementing and replacing once highly-prized proprietary agents, interfaces and data specs. There’s no better example of removing a constraint than making these once proprietary agents with an open solution that will have profound effects across the industry.

    OTel is a thriving ecosystem of 11 tech companies participating on various boards and committees that also collaborates and integrates with open source projects such as Jaeger, Kubernetes, Prometheus and OpenMetrics. Over 20 observability companies natively support and provide OTel distributions. OTel continues to mature, reaching stability 1.0 release in 2021 and announcing its roadmap for metrics specifications in 2022.

    OTel-native support represents a significant commitment from vendors because it means rearchitecting products to distribute data via OpenTelemetry Protocol (OTLP) rather than using OTel SDKs and Collectors frontend internal interfaces. With SolarWinds’ October 2022 announcement, I suspect they will also join the ranks of companies supporting OTel natively in their commercial offerings. 

    Digital transformation, product and technology leaders see value in observability because of its potential to measure digital experiences and measure the performance of business and digital services. To do this requires observability to meet three significant challenges.

    First, observability must effectively cross the complex boundaries of microservices, containers, cloud and traditional applications, multiple cloud providers, database sources, SaaS services, infrastructure and internal and external APIs. Today’s challenge is far beyond the central aggregation of large volumes of log data and suppressing non-essential alerts. 

    Most enterprise architectures look eerily similar to a breadboard wiring project with applications, systems and data sources crisscrossing each other, representing the various pathways and interfaces across systems. Virtually any of these elements could contribute to the degradation of a digital experience, and observability must operate across these elements whether they live in our tightly controlled data centers or are distributed in microservices, cloud services or third-party interfaces.

    With this breadth and depth of visibility, we also need context to match and correlate what appears to be disconnected information and sources. Open source enthusiast Chris Engelbert describes this challenge well:

    “The data correlation, the knowledge of how the infrastructure and services are deployed, as well as the dependency tree of applications, services and (eventually) hardware, must be taken into account when providing hard evidence of what is going on in your system.”

    Following the Silver Thread

    With context and dependencies, observability can allow us to see what software developers call the “silver thread,” the ability to collect the components of systems involved in measuring an experience or triaging a performance issue. Then we can follow the pathway, or silver thread, across all the components, whatever or wherever they are, to find constraints or bottlenecks. For example, a particular API’s poor performance may be due to the location and traversal necessary to reach a needed data source rather than an issue in that API’s microservice or application.

    In summary, observability is invaluable to monitoring, operating and triaging modern applications and cloud infrastructure. The adoption and maturation of OpenTelemetry will deliver many benefits, including the removal (or, at least, greater transparency) of traditional boundary constraints. And with the context to understand and follow the silver thread, observability transforms beyond operations to measure digitally delivered business services and experiences.

  • New Relic Reports Major Spike in Volume of Log Data

    New Relic Reports Major Spike in Volume of Log Data

    New Relic today shared a report based on anonymized data it collects that showed a 35% increase in the volume of logging data collected by its observability platform.

    The report also identified logs generated by NGINX proxy software (38%) as being the most common type of log, followed by Syslog (25%) and Amazon Load Balancer (20%).

    In addition, Fluent Bit is the most commonly used open source processor and forwarder tool (38%) among IT teams that have adopted the New Relic platform. Another 16% are using New Relic infrastructure agent, followed by 14% that send log data directly to New Relic via an HTTP endpoint.

    The report also found 50% of all logs ingested by language agents come from Java applications, followed by .Net (26%), Ruby (22%) and Node.js (2%).

    Jemiah Sius, director of developer relations at New Relic, said as more cloud-native applications are deployed, the volume of log data that is collected is only going to increase as open source OpenTelemetry tools are more widely adopted. In addition, IT teams will also be collecting metrics, traces and events to better pinpoint the root cause of issues using observability platforms such as New Relic One, he added.

    Amazon Web Services (AWS) is now, of course, one of the biggest sources of log data. The New Relic report noted that the serverless AWS Lambda service is the most widely employed source of log data among AWS customers that employ the New Relic One platform. However, use of the AWS Firehose service for extracting, transforming and loading (ETL) data has grown sharply in the last year, noted Sius.

    The New Relic report found while only 32% of New Relic accounts that use AWS have adopted Firehose, there has been a 62% increase in adoption year-over-year.

    Log data is usually the first thing any IT team consults whenever there is an issue, but as the volume of log data increases it’s becoming more difficult to associate log data with specific IT events. The issue that each IT team will have to come to terms with is how much log data to store alongside metrics, traces and other data formats to help them proactively identify the root cause of an IT issue.

    Observability platforms, in the meantime, promise to make it possible to query that log data to identify relationships between events. The goal is to enable IT teams to investigate issues before they can disrupt IT services rather than merely reacting to events after they have unfolded, said Sius.

    The hope, of course, is that machine learning algorithms will soon automatically identify issues before most IT teams even know there is a problem. Given the overall complexity of modern IT environments, it’s unlikely most IT teams even know what queries to launch to identify the root cause of an issue. Instead, as machine learning algorithms become more familiar with what constitutes normal IT events, it will become simpler for those algorithms to surface the issues that are actually worth IT’s attention.

  • Scaling Predictive Analytics With AIOps to Drive Next-Gen SRE

    Scaling Predictive Analytics With AIOps to Drive Next-Gen SRE

    Enterprise systems are only as valuable as they are reliable, in the sense that they don’t suffer excessive breakdowns. Otherwise, companies experience costly downtime and added stress for engineers due to the additional burden of managing issues. This critical function of ensuring systems run reliably and optimally, at production scale and with minimum human intervention, is the purview of site reliability engineering (SRE) teams.  

    The SRE professional’s job is to reduce human toil by developing and implementing reliable and highly scalable systems that optimize software and applications. Their goal is to proactively identify and, where possible, anticipate potential disruptions to minimize risk and ensure optimal system performance. However, to be successful, SRE teams require a level of enterprise-wide visibility that can be difficult to provide without the right tools to capture and analyze data at the appropriate level of detail. 

    Let’s examine how artificial intelligence for IT operations (AIOps) can support the SRE mission by connecting data enterprise-wide for unprecedented visibility and control of systems and processes, enabling auto resolution of most issues and more efficient triaging for the few remaining cases where SRE teams must collaborate around a fix.

    Challenges of Complexity and Scale in Pursuing SRE Excellence

    As more enterprises digitize their operations and move to greater automation, their IT operations must leverage all data assets skillfully in order to improve reliability and reduce human toil. The SRE profession arose to satisfy this need, with a focus on monitoring systems, accessorizing automated releases, understanding change impacts and automating some of the most common system processes. 

    To do their job effectively, SRE teams need a wide variety of data and analytics capabilities at their disposal. This includes the ability to deep dive into descriptive and diagnostic analytics to look backward and at present conditions to discover what happened in the past and why and to baseline current operations. But this is just the beginning. The true value  of SRE comes with the scaling of predictive and prescriptive analytics to draw on that historic data and apply detailed analysis to generate predictive insights into what is most likely to happen in the future; these insights are the basis for identifying proactive measures that can serve to address any potential problems and optimize those future outcomes, minimizing adverse impacts on operations 

    These analytic capabilities must be fed by robust data that comes from across the entire IT estate. Developers assigned to the SRE role face an especially strong mandate to have this holistic visibility as they plan, build, test, release, monitor and secure systems; their job is hampered to the extent that organizational silos or problems of scale get in the way of achieving that visibility. It is here that AIOps can help evolve IT operations to become more proactive and autonomous by scaling the power and reach of predictive and prescriptive analytics. 

    AIOps Empowers the SRE Mission Enterprise-Wide

    AIOps is an essential tool for the SRE community in the battle to reduce operator stress, configure IT systems to be more stable and run efficiently with less human intervention. AIOps employs artificial intelligence (AI) and machine learning (ML) for observability, context, normal behavior analysis and automated health diagnostics. This, in turn, enables anomaly detection in real-time and closed-loop automatic resolution of most issues. 

    For example, AIOps can uncover patterns showing that, 90% of the time, a particular alert in the organization’s payment system triggers a seemingly unrelated alert within 15 minutes. Moving forward, this gives SRE teams a 15-minute head start on addressing that secondary alert; the discovery forms the basis of an auto-resolution or triaging scenario that uncovers the underlying cause of both alerts and provides a permanent fix. 

    That’s just one illustration of how AIOps uses advanced analytics to discern subtle patterns in data to predict when and where problems may occur, so proactive fixes can automatically be prescribed to head off those problems. In this way, AIOps is the technology backbone that scales and automates the SRE team’s insight and control across all system assets and dependencies, a critical tool for continuous optimization of performance with minimal human intervention. 

    Conclusion: The Game-Changing Role for AIOps in SRE

    AIOps is a game-changer for the critical function of site reliability engineering. Powered by a potent blend of advanced analytics on robust data coming from systems across the enterprise, AIOps delivers unprecedented visibility and control for SRE teams in their mission to reduce toil and ensure the reliability and resiliency of enterprise systems. The result is less human intervention and enhanced value from IT systems that are made more robust, more stable and more efficient.

  • Database Observability: How to Circumvent your Weakest Link

    Database Observability: How to Circumvent your Weakest Link

    Today, IT pros field an increasing number of assets they need to monitor to secure systems and understand what’s happening in their database and applications. This is further complicated as organizations adopt hybrid IT strategies and IT pros are tasked with managing tech stacks that span across on-premises and public clouds. 

    To cut through complexity and create end-to-end visibility into their IT systems, organizations must enact an observability approach.

    Monitoring Vs. Observability

    When it comes to observability, many think it means the same as monitoring. Whereas monitoring is a verb; observability is a measure of how well the internal states and conditions of a system can be inferred from its external outputs. 

    When monitoring systems are set up, dashboards are built around certain assumptions that an IT pro may expect will happen. When monitoring databases, teams are building multi-level component IP systems. The algorithms must process that data, and the user interface must interact with it. 

    However, to make that system highly observable, performance information and other kinds of metrics across all kinds of different endpoints must be incorporated. Especially since IT pros must deal with microservices, mesh, IoT or containers orchestrated through Kubernetes.

    How to Monitor Effectively 

    In the past, IT pros would typically monitor a SQL Server or even other database platforms like PostgreSQL or MySQL. In this new era of observability, on the other hand, IT pros need to do something different with the front-end code with regard to the different kinds of algorithms processed against that data set. Typically, developer teams would write the code, but there wasn’t anything written in that code to send out debug signals.

    Today that has changed. To make sure our systems are fully observable (because we can’t anticipate all possible problems!), we must log different steps to keep track of the many moving pieces. Organizations must collect as much of everything as possible. The more data, the more information organizations have about what’s happening in their application, from the database through the virtualization or containerization layer to the virtualization host or the orchestration to the bare metal. If organizations can get visibility into those elements, we can enable our systems to be fully observable and more easily diagnose any problem or anomaly that happens.

    An Observability Approach

    When using the observability approach, high-level dashboards are handy. They can help IT pros roll up everything that’s happening and get to a root cause analysis if there is a problem. However, sometimes there’s not a specific problem; there’s just a general performance issue. With observability platforms, teams can quickly discover, map and understand dependencies in ways that make it easier to achieve and maintain service level objectives (SLOs). 

    As IT teams increasingly distinguish between merely monitoring IT environments and achieving observability, they can proactively surface anomalies using machine learning algorithms and other forms of data science. And the depth and insight that can be applied to managing IT is increasing dramatically. Observability is quickly becoming table stakes for any modern IT organization. 

  • Dynatrace Embeds DX Monitoring in Observability Platform

    Dynatrace Embeds DX Monitoring in Observability Platform

    Dynatrace has enhanced its analytics capabilities to enable digital experience monitoring, including session replays, based on the logs, metrics and traces it collects via its observability platform.

    Steve Tack, senior vice president of product management at Dynatrace, said this update makes it simpler for DevOps teams to track user journeys across the multiple components and microservices that make up a modern application environment. Rather than trying to, for example, determine the impact of an issue by parsing through log data without any context, Tack said Dynatrace’s analytics capabilities will automatically fire up a session replay to enable DevOps teams to view the exact nature of the application issue being experienced.

    Previously, DevOps teams would have needed to deploy the Dynatrace session replay offering separately. The overall goal is to remove much of the friction DevOps teams encounter when trying to fix an application issue by providing context in a way that is more accessible, he added.

    In general, as observability continues to advance, it’s now become much less about the amount and types of data that can be collected, said Tack. The data is table stakes for achieving observability, he added. The focus now needs to be on the richness of the actionable analytics being surfaced once that data is collected, he said.

    In fact, as more organizations start to build and deploy applications based on highly interdependent microservices, the richness of the analytics is now more critical than ever, noted Tack. While microservices-based applications are more resilient than monolithic applications, troubleshooting them is more challenging whenever application performance degrades, he added.

    It’s not clear at what rate DevOps teams are embracing observability. The concept has always been a core DevOps principle, but, for the most part, more mature DevOps teams have only been able to achieve what amounts to continuous monitoring of pre-defined metrics. Observability platforms promise to surface anomalies indicative of IT issues before they escalate; DevOps teams can then launch queries to better determine their root cause and potential severity.

    Dynatrace is making a case for an observability platform, accessed as a cloud service, that employs the company’s Davis AI engine and machine learning algorithms to surface the root cause of application issues.

    As observability platforms continue to evolve, the days when IT teams determined the root cause of an IT issue by process of elimination are finally coming to an end. DevOps teams will be gaining more visibility into their application environments in ways that surface more meaningful actionable intelligence. That intelligence is especially critical for externally-facing applications driving digital business transformation initiatives.

    There is, of course, no shortage of options when it comes to observability platforms. In some cases, IT organizations are opting to rely on cloud services while others are extending DevOps platforms they built themselves and continue to maintain. Regardless of the approach, the issue will no longer be how to collect data as much as what to do with it once it’s collected.

  • Deciphering the Observability Market

    Deciphering the Observability Market

    Observability has become one of the most overused buzzwords in IT and cybersecurity. Today, the term is used by vendors to refer to everything from application performance to network monitoring, cybersecurity and data and analytics.

    While the term’s ubiquity has created confusion for everyone from end users to journalists, startups in the space have also attracted over $2 billion dollars in venture capital investment over the past two years. This momentum prompted TechCrunch to ask if this area, specifically data observability, was effectively recession-proof.

    This observation triggers two questions. First, what is observability? And second, what are the different kinds or variants?

    What is Observability?

    Observability, as a broad practice or capability, originated in the 1960s as part of industrial control theory. The idea is that by watching the output of a system, you can figure out what’s happening inside the black box. This sounds a lot like monitoring, a popular practice for IT and security teams. However, observability takes a different approach than monitoring’s alert-based methods; it allows you to ask questions about a system that dig deeper than the pre-defined thresholds from your monitoring system. 

    Observability requires collecting massive amounts of data from systems, networks and applications to feed its discovery process. As systems and applications become more complex, figuring out what went wrong and why becomes much more challenging. At a high level, these are the kinds of challenges many startups in this area are addressing. Each takes a different approach and solves a different part of the observability problem.

    Types of Observability

    The most frequently mentioned type is data observability, which is concerned with the health and quality of data passing through data pipelines for analytical use cases like feeding a data warehouse. Vendors like Acceldata, Bigeye or Monte Carlo Data typically target their products to data engineers tasked with building and operating analytical data pipelines. 

    Another group of companies addresses applications. These firms, like Honeycomb and Observe.ai, collect data from applications to help site reliability engineers (SREs) understand performance issues and aid them in debugging and troubleshooting. 

    There are also companies specializing in machine learning observability, and these are concerned with the performance and drift of models in production. These companies, like Arize and WhyLabs, target data scientists. 

    Finally, there are companies in the observability data space which is comprised of logs, events, metrics and traces essential for all other forms of observability and monitoring to work. Companies in this space, like Cribl, use specially-designed pipelines to connect the sources and destinations of observability and security data. These pipelines allow companies to route data to multiple destinations, enrich data in flight and reduce data volumes before ingestion.

    As you can see, there are dozens of companies in the space. Each category of vendors addresses a unique challenge in today’s sprawling IT and security landscape.

    Beware Observability-Washing

    As the hype around this topic grows, companies hoping to differentiate themselves from their competitors may suddenly rebrand as observability companies. This is already happening. Legacy monitoring and alerting companies are calling themselves observability companies, hoping to attract the same kind of attention as others in the space that actually do have differentiated products and positioning.

  • Cribl Automates Observability Efforts

    Cribl Automates Observability Efforts

    Cribl today announced it has updated the Cribl LogStream observability tool in addition to generally making available a software-as-a-service (SaaS) offering dubbed LogStream Cloud.

    Nick Heudecker, senior director for market strategy and competitive intelligence at Cribl, said Cribl LogStream provides the means to aggregate log data collected from multiple platforms and applications in a format any observability or monitoring tool can access.

    The challenge with observability platforms today is they leave it up to IT organization to copy and paste data into the platform. LogStream automates that process via a log router that collects and optimizes data streams from existing installed agent software and then shapes and routes that data on to analytics platform.

    Version 3.0 adds LogStream Packs, a framework for accelerating deployments of the log router. Alternatively, DevOps teams can employ LogStream Cloud to build and share LogStream configuration models.

    Heudecker said the goal is to reduce the cost of achieving observability by reducing the time and effort required to set up and manage data pipelines. No customization effort on the part of a DevOps team is required to collect and send data from hundreds of sources to any number of destinations, noted Heudecker.

    While observability is a core DevOps tenet, achieving it has been a major challenge. In addition to deploying and managing agent software to instrument IT environments, there’s a significant amount of time and data engineering effort needed to set up the pipelines employed to transfer data to a platform where it can be analyzed. Cribl is making a case for automating those data engineering tasks using a tier of software that abstracts data into a format that can be consumed by multiple observability and monitoring platforms.

    It’s not clear yet to what degree IT organizations perceive observability to be an evolution of monitoring, or simply the next logical evolution of monitoring. One way or another, IT teams need a lot more context than they have historically been able to attain using legacy monitoring tools. Each platform employed within an enterprise typically comes with its own monitoring tools that are used by the IT teams tasked with managing it. Whenever there is an issue, however, IT teams will spend hours correlating data from multiple tools to ascertain the root cause of a problem.

    Observability platforms promise to reduce that time and effort by applying analytics to data collected from multiple platforms. The challenge now is finding a way to efficiently collect all that data.

    It may be a while before IT organizations start to abandon all the monitoring tools they have in place in favor of observability platforms. However, as IT environments continue to become more complex (thanks, in part, to the rise of cloud-native computing platform based on microservices) the need for those platforms becomes more acute. The issue is enabling DevOps teams to achieve that goal without having to wait for an overworked data engineer to find the time to build a pipeline.

  • Oracle Extends Capabilities of Enterprise Manager Platform

    Oracle Extends Capabilities of Enterprise Manager Platform

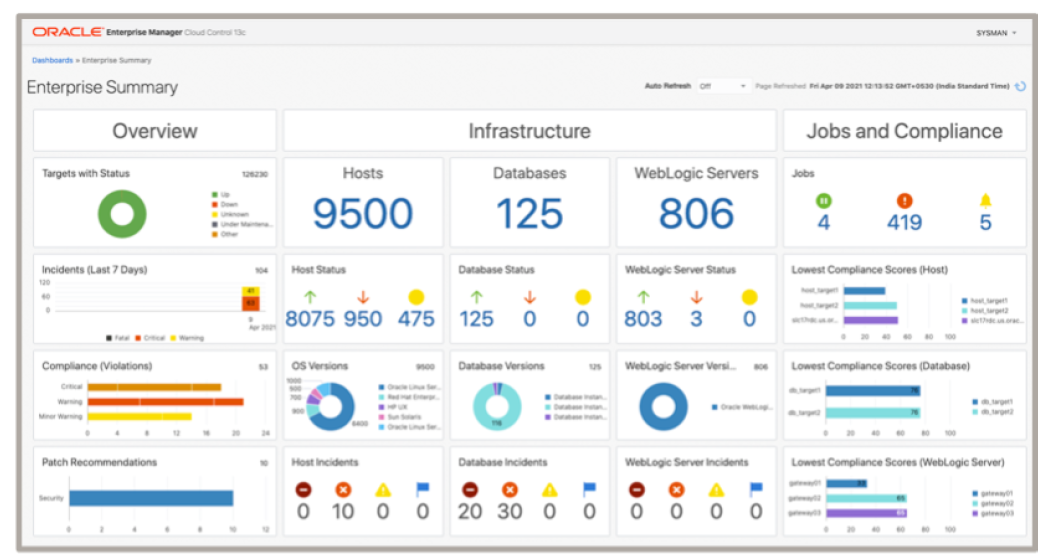
    Oracle today announced it has updated its core management platform to provide capabilities that make it easier to manage a hybrid cloud computing environment spanning millions of endpoints.

    The latest release of Oracle Enterprise Manager (EM) 13c, in addition to greater scalability, also provides support for dynamic groups, dynamic runbooks, automated workload analysis, monitoring templates, event compression and other capabilities that make it easier to manage IT operations at scale.

    Oracle Enterprise Manager (EM) 13c Release 5 also extends the reach of the management platform further into the realm of packaged Oracle applications and integrated hardware and software platforms such as Oracle Exadata, Oracle Database Appliance (ODA), Zero Data Loss Recovery Appliance (ZDLRA) and Private Cloud Appliance (PCA).

    Oracle has also updated the compliance framework it includes with Oracle Enterprise EM to support additional regulatory requirements and refreshed the user interface for the fleet management tool provided.

    Finally, the company is adding a tool that makes it easier to copy data stored within Oracle EM 13c to the Oracle Cloud Infrastructure (OCI) service. Dubbed OCI bridge, this tool copies data to an OCI object store where it is accessed by OCI services such as logging analytics and operations insights.

    Mughees Minhas, vice president of product management for enterprise and cloud manageability at Oracle, said as hybrid cloud computing continues to evolve, the need for a single management platform that spans infrastructure, databases and applications is becoming more apparent.

    Minhas said Oracle EM 13c is part of larger observability initiative that Oracle has embraced to provide more context across disparate services in a way that reduces the total number of tools an IT team needs to deploy and master. That effort complements a series of autonomous computing initiatives Oracle has previously launched that eliminates the need for database administrators (DBAs) to manage lower level systems administration tasks such as performance tuning. In general, Oracle is making a case for an IT world where platforms are co-managed by Oracle and internal IT teams that are focused on higher-level tasks.

    As IT environments become more distributed it’s clear IT is becoming more complex to manage. The issue that IT teams need to come to terms with is to what degree can they automate management tasks that today conspire to limit the size of the IT environment any given IT team can effectively manage. DevOps teams, of course, have been ruthlessly automating application development and deployment tasks for years. That philosophy is now being extended to include a broader range of IT operations tasks being automated by vendors themselves.

    Each IT team will ultimately need to decide just how many automation platforms it requires. In many cases, IT teams are now struggling to unite various islands of automation that have now emerged within their organization. Regardless of approach, however, rote tasks that once consumed hours, sometimes days to complete, are now no longer required which, theoretically at least, should leave more time to focus on more complex challenges that are getting thornier by the day.

  • Oracle Launches Observability Platform

    Oracle Launches Observability Platform

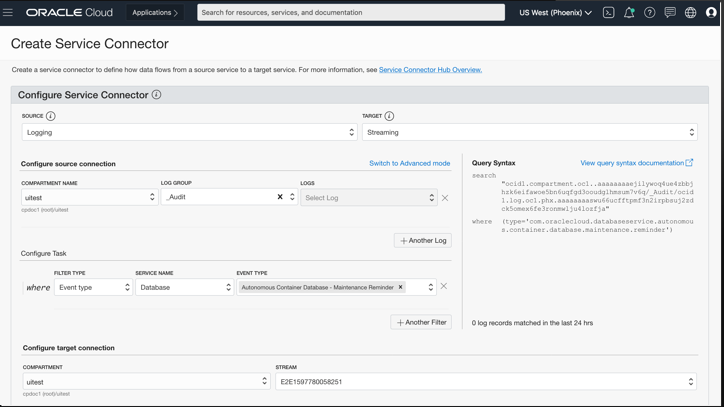
    Oracle, at its online Oracle Live event today, unveiled the Oracle Cloud Observability and Management Platform, which combines newly added logging, log analytics, database management, application performance monitoring, operations insights and service connector hub services with existing Oracle monitoring, notifications, events, functions, streaming and operating system management capabilities.

    Dan Koloski, vice president of product management for Oracle, said the Oracle Cloud Observability and Management Platform provides IT organizations with access to a unified observability platform running on the Oracle Cloud Infrastructure (OCI) service that, in keeping with best DevOps practices, offers more context than traditional monitoring tools.

    In addition to being able to observe applications deployed on Oracle infrastructure, on-premises or in the cloud, the Oracle Cloud Observability and Management Platform interoperates with Slack, Grafana, Twilio, PagerDuty and other platforms to enable organizations to craft end-to-end DevOps workflows, Koloski added. Oracle is also working toward making it possible to import and export data to open source Prometheus monitoring platforms, noted Koloski.

    Oracle Cloud Observability and Management Platform employs machine learning algorithms to automatically detect anomalies and enable remediation in near-real-time. The company has also automated the instrumentation process to the point of one-click agent deployment, he added.

    Koloski said IT organizations are moving to rationalize a raft of tools to monitor silos of applications and infrastructure that historically were employed with mixed success. An observability platform provides more context by unifying all those tools in a way that makes it easier to troubleshoot the overall IT environment, he noted.

    As IT environments become more complex, thanks mainly to the rise of microservices and containers across hybrid cloud computing environments, Koloski said a new approach to managing IT is required. Advances in observability in the form of distributed traces are also creating a need to shift IT monitoring platforms to the cloud, as the amount of data that needs to be analyzed steadily increases, noted Koloski.

    With the launch of Oracle Cloud Observability and Management Platform, Oracle is also signaling that database management is being incorporated into DevOps processes, Koloski said.

    IT teams today still spend a fair amount of time in “war rooms” trying to ascertain the root cause of an application performance issue. Observability platforms promise to reduce the amount of time IT teams need to spend trying to determine the root cause of those issues. Most of the time it only takes a few minutes to fix an issue that an IT team may have spent weeks trying to uncover.

    Of course, embracing an observability platform doesn’t necessarily mean an IT organization has embraced best DevOps practices. However, because observability is a core tenet of DevOps, it does mean a lot more IT teams will be further down that path.