Tag: IT observability

  • Grafana Labs Slashes Time to Create Observability Dashboards

    Grafana Labs Slashes Time to Create Observability Dashboards

    At its GrafanaCON 2023 event today, Grafana Labs updated its core platform for visualizing data which makes it simpler to set up dashboards in minutes. The updates are part of a celebration of the 10th anniversary of a tool that is now widely used by DevOps teams.

    Ryan McKinley, a distinguished engineer for Grafana Labs, said Grafana 10 should help make DevOps more accessible to a wider range of practitioners with limited experience working with observability tools. The latest release also makes it simpler to share knowledge with external stakeholders via public dashboards, he added.

    In addition, Grafana 10 adds expanded role-based access control (RBAC) capabilities and streamlined implementation of the secure access markup language (SAML) to ensure authentication.

    Grafana Cloud has also been updated to provide a secure way to connect to data residing in an on-premises IT environment or in a cloud with the observability platform the company provides via a software-as-a-service (SaaS) platform.

    Finally, Grafana Labs is also making the engine it created to visualize data more accessible to third-party developers that are embedding visualizations based on Grafana within their applications, noted McKinley.

    Grafana Labs

    There are now more than 150 plugins for various data sources that have been made available to more than 20 million users of the Grafana visualization framework. Not all those users are working in DevOps environments, but Grafana is widely used to enable observability across increasingly complex IT environments. The Grafana Cloud seeks to capitalize on that popularity by adding a service that uses an instance of open source Grafana Mimir software to store data collected in a format originally defined for the open source Prometheus monitoring tool.

    It’s still early days as far as adoption of observability is concerned, but it’s apparent that as application environments become more complex, the plethora of monitoring tools that DevOps teams rely on will need to be streamlined. Observability platforms promise to unify logs, metrics and traces to simplify launching queries to identify the root cause of an issue.

    The rate at which DevOps teams will embrace observability will naturally vary, but the biggest obstacle might not be the platforms themselves. Instead, the issue is understanding what queries can help DevOps teams better understand the root cause of an IT issue before there is a major disruption. In the long term, it’s expected that machine learning algorithms will leverage the data collected by observability platforms to automatically identify issues that might lead to a disruption long before it actually occurs.

    Of course, the result of any query that gets launched needs to be visualized in a way that is easily understood. Grafana Labs is now making a case for a more integrated approach that, at its core, employs its visualization tools to make it simpler to discern what’s occurring in IT environments. After all, no matter how talented any DevOps team may be, it’s still not possible to manage what was never seen in the first place.

  • What the Convergence of Observability and Security Means for Devs

    What the Convergence of Observability and Security Means for Devs

    There is a scene in the movie Apollo 13 when the mission control flight director asks why the carbon dioxide scrubber in the command module was a different shape than the one used in the lunar module (and therefore incompatible). The engineer simply replied, “This just isn’t a contingency we’ve even remotely looked at.”

    A similar scenario plays out at many organizations when they examine security and development practices. When it’s time for code to go into production, every developer hopes their code will run as planned–smoothly and error-free. Unfortunately, something will be missed, performance could degrade or new, unanticipated problems can emerge after an application is deployed to production.

    Developers fear the “unknown unknowns.” And it keeps them up at night.

    When an “unknown unknown” problem occurs, it takes time for teams to do the forensics to identify the problem. It can take days or even weeks for teams to complete that initial investigation. If a mission-critical application is offline for a significant period of time due to a forensics investigation, then it can negatively affect your customer’s experience and, ultimately, your organization’s bottom line.

    The “unknown unknowns” problem is another challenge facing developers in today’s unpredictable macro environment. That includes the deluge of data, increasing cyberthreats, an increasingly distributed infrastructure and a remote and hybrid workforce as well as a mix of modern cloud-native and monolithic apps.

    To help developers build for the future and address security concerns, it is imperative they rethink the way they are collecting, operationalizing and storing different types of data from a variety of sources.

    Security and Observability: Better Together

    Today, security and observability have recently begun to overlap, driven by the growing need for organizations to better understand the activity inside their environments. Many forward-thinking organizations are operationalizing the massive amounts of log and event data currently being generated to understand and assess issues in their infrastructure and apps and using these actionable insights to optimize workload, app resource availability, security and uptime.

    So how can developers take advantage of the security and observability convergence trend happening right now?

    Currently, it’s common for developers to have two agents as part of their tech stack. One agent for observability, which is collecting data such as logs and events to get relevant insights into the health and performance of their application in real-time. The other agent is for security to collect data in their devtest, integration and production environments.

    Since these two agents often collect the same data, there is an opportunity to consolidate it into a single location, such as a unified security platform with a single agent, where this data can be overlaid with time series analytics to deliver relevant insights to users. Using this approach of having both security and non-security data in one place will significantly speed up the process of getting these valuable insights into the developer’s hands.

    In addition to getting insights faster, another benefit of having this data in a single location is the ability to access historical data. Giving developers the ability to store and manage data for long periods of time allows them to get insights from this historical data, so they can better understand alerts, incidents and adversaries. This can help them correlate in terms of understanding the risk to an application, such as potential “unknown unknown” threats, which they can proactively address before it causes any damage.

    Adopting a converged security and observability approach is the most mature step that organizations can take to help developers deliver the best outcomes and best experiences for their customers and users. As more organizations rely on the cloud and the speed of business rapidly increases, developers must transform their view of the health, performance and security of applications and infrastructure. Giving developers this perspective will dramatically help them take rapid action against an adverse event before it impacts their company’s bottom line.

  • Datadog Dives Into Universal Service Monitoring

    Datadog Dives Into Universal Service Monitoring

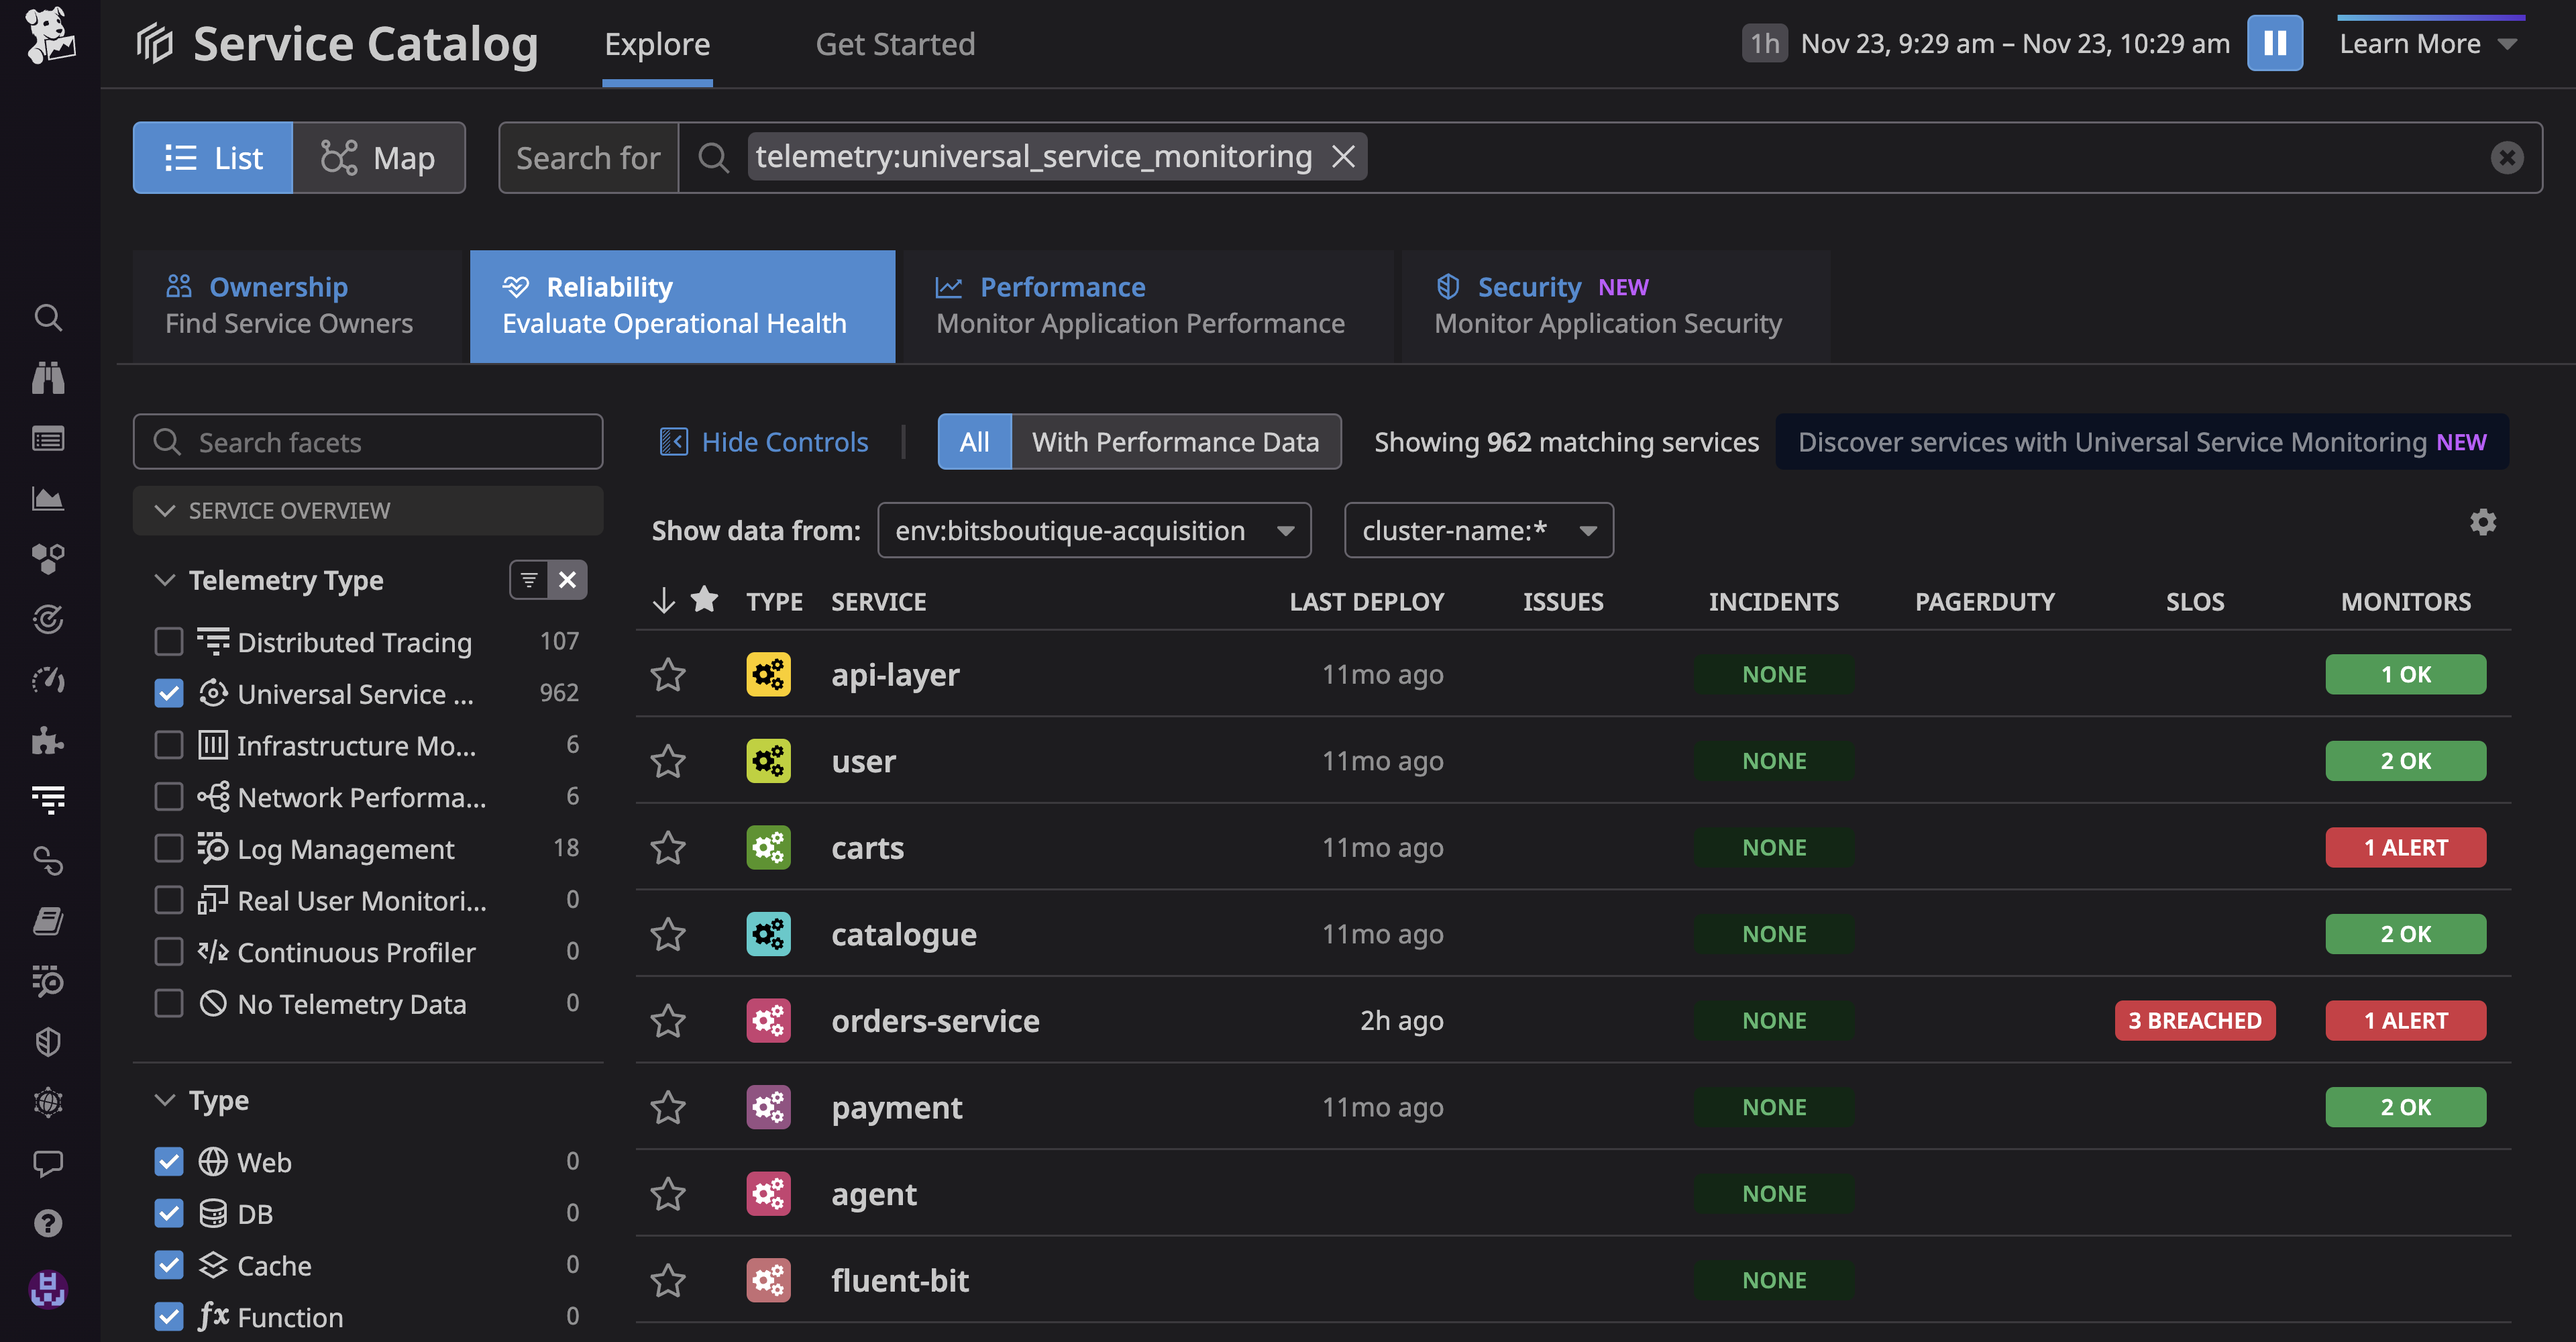
    Datadog, Inc. today made generally available a Universal Service Monitoring service that takes advantage of the extended Berkeley Packet Filtering (eBPF) microkernel in a Linux operating system to automatically detect all the services that make up an application environment without changes to the code used to construct them.

    Yrieix Garnier, vice president of product at Datadog, said as application environments continue to evolve IT teams are now trying to track not just individual microservices but also entire business processes such as order-to-cash. Before those services can be instrumented, however, DevOps teams need a simple way to discover them, he noted.

    Within the Linux operating system, eBPF makes it possible to employ a sandbox environment to identify and map the services that make up an application environment, including both internally developed and third-party services regardless of what programming languages were used to build them, added Garnier.

    DevOps teams also gain visibility into the health of every service and deployment through real-time request rate, error and duration (RED) metrics and correlated infrastructure metrics and application logs. They can then expand monitoring capabilities provided via Datadog agent software to employ distributed traces that can be correlated with observability data.

    The Datadog Universal Service Monitoring service is also integrated with the Service Catalog that Datadog makes available to determine which development team created a specific service.

    The goal is to close a visibility gap that has emerged as more IT organizations align their management efforts around specific application services in the age of digital transformation rather than the components that make up a service, noted Garnier.

    DevOps teams today are simultaneously being tasked with diving deeper into application environments to discover issues before services are disrupted and also tracking the services that span multiple application components. Collectively, the expectation is that DevOps teams will be able to ensure that application services are not just available but also consistently delivered. Ultimately, IT organizations are being tasked with removing much of the guesswork that has historically characterized the management of IT.

    Less clear is how much those shifts will ultimately drive the reorganization of IT teams that are still mostly organized around the platforms they support versus the services being delivered. However, as business leaders increasingly appreciate how dependent the overall organization is on application services, the need to manage them in a more comprehensive manner becomes apparent.

    In the meantime, DevOps teams are evaluating whether their existing tools and platforms enable them to accomplish that goal. Datadog is making a case for employing a service it manages on behalf of DevOps teams versus each DevOps team having to construct and maintain its own observability platform. Datadog, most recently, extended the reach of its namesake cloud-delivered monitoring and observability platform to address continuous testing, application security and cost management.

    It will be up to each organization to decide how best to achieve their observability goals. One thing that is certain is the current level of visibility they have into application environments is not nearly sufficient.

  • Switching From FluentD to Vector Log Aggregation Tool

    Switching From FluentD to Vector Log Aggregation Tool

    Log files are extremely important to the data analysis process as they contain essential information about usage patterns, activities and operations within an operating system, application, server or device. This data is relevant to a number of use cases across an organization from resource management, application troubleshooting, regulation compliance and SIEM and business analytics and marketing insights. To manage logs created by these use cases and make use of this wealth of data, log aggregation tools enable organizations to systematically collect and standardize log files. However, choosing the right tool can be quite challenging.

    This blog will detail and compare the popular open source fluentD and Vector tools for log aggregation.

    fluentD Configuration and Efficiency Calculation

    When using orchestration tools like Kubernetes to deploy containers or other API resources, there is a need for a log aggregator to store the pod or node logs in a cloud platform. For a particular requirement, fluentD was used as a log aggregator tool to push K8s pod logs to cloud storage buckets with a sample configuration as shown below:

    <match kubernetes.**>

    @type <cloud platform name>

    project <project name in cloud platform>

    keyfile <credential json to access the cloud storage> bucket <cloud storage bucket name> object_key_format <name for the file to be used>

    path <file prefix/path where the file have to be stored>

    <buffer tag,time>

    @type file

    path /var/log/fluent/gcs timekey 1m timekey_wait 30 timekey_use_utc true flush_thread_count 16 flush_at_shutdown true flush_mode interval flush_interval 1 chunk_limit_size 10MB retry_max_interval 30 retry_wait 60

    </buffer> <format>

    @type json </format>

    </match>

    Using this system, fluentD was pushing only 47.62% of total logs to cloud storage. Since there was a loss of more than 50%, changes were made to the configuration. In most of the changes, the efficiency was somewhere between 40% and 50%, with a maximum efficiency achieved at an average 67% for an entire day. Below are some of the changes made along with the percentage of logs that were pushed to cloud storage:

    <buffer tag,time> @type file

    path /var/log/fluent/gcs timekey 1m timekey_wait 30 timekey_use_utc true flush_thread_count 16 flush_at_shutdown true retry_max_interval 60 retry_wait 30

    </buffer> Efficiency:- 46.32%

    <buffer tag,time> @type file

    path /var/log/fluent/gcs timekey 1m timekey_wait 30 timekey_use_utc true flush_thread_count 16 flush_at_shutdown true

    </buffer> Efficiency:- 49.89%

    <buffer tag,time>

    @type file

    path /var/log/fluent/gcs timekey 10m timekey_wait 0 timekey_use_utc true flush_at_shutdown true

    </buffer> Efficiency:- 37%

    <buffer tag,time> @type file

    path /var/log/fluent/gcs timekey 30 timekey_wait 0 timekey_use_utc true flush_thread_count 15 flush_at_shutdown true

    </buffer> Efficiency:- 60.88%

    <buffer tag,time> @type file

    path /var/log/fluent/gcs timekey 1 timekey_wait 0 timekey_use_utc true flush_thread_count 16 flush_at_shutdown true flush_mode immediate

    </buffer> Efficiency:- 66.77%

    Vector Deployment, Configuration and Resultant Efficiency

    To improve this further, the open source Vector tool by Datadog was also considered. This tool was suitable for K8s setup with a similar configuration as fluentD and was installed in the nodes.

    A Helm command was used to clone the official repository in its VMs; the configuration was changed as described below and installed it as an agent. Vector comes in two working modes: Agent and aggregator. While agent is the plain mode that pushes logs/events from source to destination, aggregator is used to transform and ship data collected by other agents (in this case, Vector).

    The installation of this tool requires a Helm repository in the local machine to fetch the source code. Hence the below commands were run in a sequential pattern before installing Vector in a K8s cluster:

    helm repo add vector https://helm.vector.dev (Adding vector repo to helm list)

    helm repo update (Updating the helm repos)

    helm fetch –untar vector/vector . (command to clone the repository to local machine)

    Configuration:-

    data_dir: /vector-data-dir

    sources:

    <Custom source id>:

    type: kubernetes_logs (because we are using kubernetes as our source)

    exclude_paths_glob_patterns: <Array of directories which has be excluded when collecting the logs from the nodes> (Optional)

    sinks:

    <Custom sink id>:

    type: <Destination cloud storage>

    inputs: <Array of source id’s from where log has to be pushed>

    bucket: <Bucket name of cloud storage>

    key_prefix: <Path inside the bucket where the logs has to collected> (Optional) encoding:

    codec: <Encoding of the log file> (Optional) Command to install the Vector:-

    helm install vector . –namespace vector

    After deploying Vector in the development environment and testing it, the efficiency was ~100% with negligible loss. The switch was then made to Vector and deployed in the production environment. Vector can ship up 100,000 events or logs/sec, which is a very high throughput rate compared to other tools for log aggregation performance. Vector was able to achieve 99.98-100% efficiency even in the Kubernetes production cluster.

    To learn more about how DataOps can enable highly performant data pipelines with real-time logging and monitoring, watch this video. 

  • Fastly Adds Observability Tools for Edge Computing Environments

    Fastly Adds Observability Tools for Edge Computing Environments

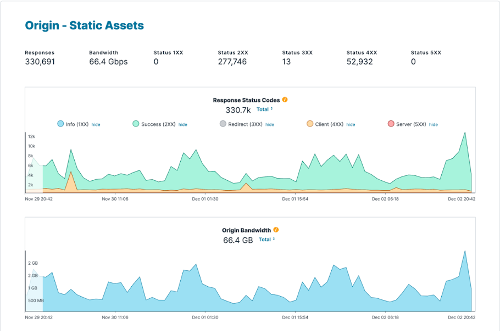
    Fastly, Inc. this week added a set of observability tools to its portfolio that are optimized for edge computing platforms connected to its content delivery network (CDN).

    Laura Thomson, senior vice president of engineering at Fastly, said the company is now providing a set of tools that enable DevOps teams to capture logging data and metrics in real-time via a single console.

    The first two available tools are Origin Inspector—to observe network traffic flows including HTTPS response codes—and Domain Inspector—to access metrics based on both historical and real-time data. In total, Fastly is now providing access to more than 200 metrics spanning client, origin, cache, web application firewall (WAF), Compute@Edge, Image Optimization services and others that cover 100% of the data generated since the service was spun up.

    There is no sampling of data, and the company is also providing integrations with 33 storage and analysis services provided by either Fastly or a third party, noted Thomson. IT teams can now log any aspect of HTTP requests and responses through a large variety of logging formats, including the Common Log Format, JSON or as a key/value store. IT teams can also store their own logs to make sure they retain complete control over access.

    Over the next several months, Fastly will continue to expand this portfolio of observability tools, including an Edge Observer dashboard it is providing to customers that are deploying applications at the edge, added Thomson.

    In general, observability tools are being used to not only improve processes and overall customer experience but also identify and block suspicious activity. Fastly is making a case for observability tools that enable DevOps teams to achieve those goals without necessarily having to deploy a separate observability platform.

    Of course, most DevOps teams have been continuously tracking various pre-defined metrics for years. Observability tools, in contrast, are designed to make it feasible to interrogate logs, metrics and traces so that IT teams can discover issues before there is a disruption to services. The challenge, of course, is that not every IT team necessarily knows how to shape the queries required to discover the root cause of a potential issue.

    One way or another, DevOps teams will need to be able to remotely diagnose edge computing issues as the number of workloads deployed on these platforms expands. IT teams are not going to be able to travel to the physical location of every edge computing platform every time an issue arises. In many ways, the rise of edge computing will force a transition to observability tools that will enable IT teams to more proactively manage IT environments rather than respond after a metric has already exceeded its threshold.

    It’s not clear to what degree that approach will prevent IT issues from occurring, but the amount of time required to detect and remediate issues should dramatically decline as more visibility into IT environments, including edge computing platforms, is gained.

  • Cribl Simplifies Telemetry Data Analytics

    Cribl Simplifies Telemetry Data Analytics

    Cribl today announced general availability of a search capability that makes it simpler to query observability data where it resides without having to first collect and centrally store it.

    Nick Heudecker, senior director for market strategy for Cribl, said Cribl Search makes it possible to analyze telemetry data at its point of origin or when it is stored in a low-cost object storage platform to minimize costs.

    As the volume of telemetry data being collected continues to grow, DevOps teams are struggling with ingesting it all. Cribl takes advantage of a platform it created to stream and normalize the collection of telemetry data. Cribl Search adds the ability to also query that data at the endpoint where it resides, said Heudecker.

    While observability has always been a core tenet of DevOps, achieving it has been a major challenge. In addition to deploying and managing agent software to instrument IT environments, there’s a significant amount of time and effort required to set up the pipelines necessary to transfer data to a platform for storage and analysis. The more data is collected, the greater storage costs become. Cribl is making a case for automating those tasks using a tier of software that abstracts data into a format that can be more easily collected and analyzed.

    In general, observability is emerging as the next logical evolution of continuous monitoring. Existing monitoring tools enable DevOps teams to track specific pre-defined metrics. Observability platforms are intended to make it easier to query telemetry data to discover the root cause of an issue that is not being tracked by a set of pre-defined metrics.

    It’s not clear yet whether IT organizations perceive observability to be an evolution of monitoring or a distinctly separate but complementary capability, but it’s apparent IT teams need a lot more context than they have historically been able to attain using legacy monitoring tools. Each platform used within an enterprise typically comes with its own monitoring tools that are used by the IT teams tasked with managing it. Whenever there is an issue, it’s not uncommon for DevOps teams to spend hours correlating data from multiple tools to ascertain the root cause of a problem. Observability platforms promise to reduce that time and effort by applying analytics to data collected from multiple platforms. The challenge is finding a way to efficiently collect all that data, which in the past has often required a data engineer to build a pipeline spanning multiple sources of telemetry data.

    One way or another, observability platforms should make it easier for DevOps teams to manage IT issues more proactively. The goal, as always, is to identify issues before they cause a major disruption. In that sense, it may be difficult to prove the ROI of deploying an observability platform. However, the best IT incident is always going to be the one that never happened or, at the very least, never escalated to a level of noticeable disruption.

  • Mezmo Adds Observability Pipeline to Analyze DevOps Data

    Mezmo Adds Observability Pipeline to Analyze DevOps Data

    At the KubeCon + CloudNativeCon North America conference this week, Mezmo launched an Observability Pipeline platform that promises to make it simpler to manage, enrich and correlate machine data.

    Previously known as LogDNA, Mezmo is expanding the scope of its reach to add the ability to augment and analyze data on top of its core log management platform. Over time, that capability will be extended to add support for metrics and traces using the open source OpenTelemetry agent software.

    Mezmo CEO Tucker Callaway said the goal is to provide a framework for centralizing the flow of observability data that is now being generated by a wide range of sources across a DevOps workflow. It’s clear that DevOps teams require a means to enrich and correlate high volumes of data in motion that goes beyond simply pre-processing so it can be stored more cost-effectively, he added.

    The Mezmo Observability Pipeline achieves that goal by ensuring the right data is flowing into the right systems in the right format for analysis, noted Callaway.

    As the volume of data being collected by DevOps teams continues to dramatically increase the need to embrace a set of DataOps best practices is becoming more apparent. DataOps has emerged recently to describe a set of data engineering practices that applies many DevOps principles to the way data should be managed. Mezmo’s Observability Pipeline aims to make it simpler to apply DataOps best practices specifically to the data collected by DevOps teams.

    Of course, each DevOps team will need to decide for themselves how much data they want or need to store long term. However, increasingly DevOps teams are holding onto data much longer as IT environments become more complex, noted Callaway. That creates a need to more efficiently analyze as much data as possible and store it more cost-effectively, he said. Those twin goals, however, often create a physics problem in the sense that they can be diametrically opposed.

    In the longer term, it’s not quite clear how much DevOps teams are embracing observability. Most DevOps teams make use of monitoring tools that enable them to track a set of pre-defined metrics. Observability platforms promise to make it easier for DevOps teams to query a wide range of data types to discover potential issues before they disrupt an IT environment. The challenge is that many DevOps teams may not know what queries to form to discover those issues. It’s likely that, over time, machine learning algorithms will be increasingly applied to observability data to make it simpler to surface potential issues.

    In the meantime, however, the need for DevOps teams to find ways to manage all the data being generated by multiple types of applications is becoming a higher priority. In fact, in the absence of any meaningful way to manage all that data, the benefits of an investment in an observability platform is likely to be limited, at best.

  • Of Max and Min: The Non-Interference Prime Directive (for Visibility)

    Of Max and Min: The Non-Interference Prime Directive (for Visibility)

    Last issue, I cited CPU utilization as an example of a metric that is often misused to describe/explain/infer system performance and asserted that improved visibility can help to overcome such misuse. In this issue, I will expand on what improved visibility means and present two case studies that illustrate a recent antipattern that I’ve noticed in visibility: Interference caused by visibility interfaces.

    I will describe some properties of ideal visibility interfaces with some real-world analogies. Together with two case studies of performance problems stemming from interfering monitoring interfaces, I will explain why interference can be so damaging to observability efforts. Because so few libraries and applications provide visibility through ideal interfaces, I also continue to argue for better visibility primitives from our operating systems.

    Clarifying Visibility

    Observability is a big deal in the DevOps and SRE communities. We cannot know how well our systems are doing without visibility into their state. Unlike Scotty on Star Trek, we absolutely should not rely on gut feeling to intuit the health of the engines that drive our enterprise systems. We have to build our systems to make their internal state visible to the outside world.

    But what is not often discussed is the degree of visibility and the associated cost. A system’s visibility is not a binary “yes/no” attribute. Just as in the physical world, there are qualities to visibility that impact how observable a system actually is:

    • Is the visibility continuous or is it discrete (in either time or space)?
    • Does the act of observing perturb the system?
    • Can everyone observe or can only a few agents observe and report to everyone else?
      • Can everyone observe at the same time or is it one at a time?

    Let’s ground these attributes of visibility by looking at some examples in the physical world. In the first article of this series, I mentioned that there is a lack of standardized language used in performance engineering. As far as I know, there is no standardized language around the attributes of visibility, so the adjectives that I am using are by no means “standard”–but the distinctions they identify are important.

    Continuous Vs. Discrete Visibility

    When in London, if I can see one of Big Ben’s1 four faces, I can always know what time it is just by looking up. My access to the time of day is continuously available. But if I can’t see any of the faces, I can still rely on the chimes—except that the bells only chime once every 15 minutes. This means that if I can’t see any of Big Ben’s four faces, my access to the time of day will be discrete.

    If I witness an accident, the continuous access to time allows me to precisely note the time of the accident. If I have to fall back to relying on the chimes, the time that I attribute to the accident becomes less precise.

    Likewise, in our cars we often need to know what our current speed is (e.g., as we approach speed traps or enter school zones). It would be absolutely useless if our speedometer reported our speed in five-minute snapshots. I do not want to know how fast I was going three minutes ago. I need to know how fast I am going now!

    All other things being equal, continuous visibility is preferable. Being able to examine a system’s state on demand is far preferable to having to wait for some arbitrary interval to pass before that information becomes available—unless there is an excessive cost to examining the system state in real-time.

    Overhead, Interference and Multiple Viewer Contention

    Measurement overhead is likely the type of cost that most people are familiar with—and the type of measurement cost that many of us focus on. The time to place down a ruler to measure the dimensions of a sheet of paper or the time that it takes to make inter-process communication calls to obtain a service’s state are costs associated with taking a measurement. Of course, we want this measurement overhead to be as low as possible, but we can sometimes live with overhead because the cost is mostly borne by the observer.

    Then there are measurements that interfere with the operation of the system being measured. For example, take the annual physical exams that our doctors recommend. The purpose of these exams is to take measurements of the state of our bodies to detect health regressions. Pretty important stuff. But these exams are intrusive. We have to take time off from work, break our daily routine and trek over to the doctor’s office to get poked and prodded. Some people even skip their annuals because it is so disruptive to their lives. Many of the exciting advances in consumer medical devices essentially facilitate more continuous monitoring of vitals so we can rely less and less on these intrusive annual physicals. Again, continuous visibility is preferred!

    In computer systems, it is virtually impossible to take software-based measurements that don’t contend with the target software for hardware resources. So, implementing visibility in software means that some interference is unavoidable. But, contending for software resources like software locks and critical regions is another matter entirely. As such, we must be cognizant of contention for software resources when designing our systems for visibility. This is the essence of the Non-Interference Prime Directive for Visibility.


    A Non-Interference Prime Directive From the PMWG

    The participants in the Performance Management Working Group (PMWG) had different goals and priorities. My priorities lay in establishing a minimally intrusive low-level visibility interface for operating system and process metrics. This became the Data Capture Interface (DCI) layer in the Universal Measurement Architecture specification.

    A key part of the DCI included this statement about the performance impact of monitoring:

    1.2.2 Performance

    The addition of any metrics acquisition subsystem should not noticeably affect the performance of the measured system. (Many performance tool builders assert that system performance should not be altered by more than 5% when there is measurement activity.) Although it is beyond this specification to stipulate a performance degradation figure, that figure belongs in an implementation’s design specification, the performance goal does impose a requirement that the programming interfaces specified in this document be capable of being implemented in the most efficient manner possible on the target operating system.

    I actually wanted something stronger than a generic statement about performance impact in the specification and thought we should provide a reference implementation that would embody the key principles of low overhead, low interference and low contention. To that end, I prototyped a version of UNIX SVR4 where the kernel sysinfo data structure used by the sar/sadc utilities was placed on a page-aligned area of kernel address space. I also made sure that the rest of the page was not occupied by any other data (to address security concerns) and arranged for that page in kernel address space, which is normally protected against reads and writes from user space, to be readable (but still not writable) by all user processes at a fixed address in the user address space (it was a prototype to demonstrate how “things could be”).

    Sadc (the data collection component of sar) normally accessed the sysinfo data structure via /dev/kmem (a special file that gives file access semantics to the kernel virtual address space). On my prototype system, I modified sadc to simply dereference the fixed virtual memory that I placed sysinfo into. No open, lseek and read—just memory dereference. On the 3B2/400 system on which my prototype ran, running sadc once a second normally took almost 5% of a single CPU. On my prototype system, I was able to run sadc 100 times a second with almost no measurable CPU usage. Additionally, in my prototype, EVERY process had read-only access to the sysinfo data via simple memory dereference. The system became super visible—with virtually no overhead. Everyone could look at sysinfo at any time at the cost of memory access. Visibility Nirvana!

    Alas, Nirvana nixed; paradise lost. PMWG participants did not wish to put the requirements of a reference implementation on their kernel developers. Instead, we opted for the weaker statement about performance you see above.


    Just as with annual physical exams, a computer system measurement implementation that results in the slowing down of the system presents a tremendous disincentive to taking that measurement.2 Measurement interference is something that we need to design out of our implementations—not design into them.

    For example, if a system maintains a linked list of objects that are actively being added and removed, and traversal and manipulation of this linked list is protected by read and write locks, an implementation of a monitoring interface that needs to traverse this collection of objects in read-only fashion should not participate in this locking protocol. This statement might rankle some software engineers who are used to “data integrity at all costs,” but this highlights some of the differences in priorities between general software engineering and the practical needs of performance engineering.3 Implementing monitoring interfaces that cause software interference is counterproductive—they won’t be usable when they are most needed.

    So far, we have only considered a single observer of our systems. When there are multiple observers, we also have to ask whether the observers interfere with each other. There are plenty of examples in real life where this happens. For example, if ten people are trying to measure the dimensions of a piece of paper, physical constraints probably allow only for two or four measurements (at most) to be taken at a time (i.e., assuming an organized pipeline of participants measuring width and then height). An even more realistic example of serialized observer access might be the portholes in the lower decks of a cruise ship. Some of the smaller portholes only allow one person to view the outside at a time. So, when a pod of whales swims by, viewers have to queue and take turns to gain access to observe them.

    With computer systems, measurement contention between multiple observers also tends to discourage observation—not because everyone is so polite but because no one wants to get stuck in a line.

    Fragmented Vs. Holistic Visibility

    A final dimension of visibility is related to the field of vision. In the physical world, this is illustrated by comparing the porthole view from inside a cruise ship with the wide open, unobstructed view from the top deck.4 Compared to the top deck, portholes only provide a partial view of the ocean. One sometimes needs to stitch together the views from multiple portholes to get a more complete view of the outside world. The importance of the more complete view is the inherent bigger picture—where each fragment provides context for and about neighboring fragments.

    In computer systems, visibility is inherently fragmented. Each component provides a visibility portal (or not) into its own state. Like the portholes on the lower decks of cruise ships, we can approximate a holistic view if we are able to query the state of each component in a reasonably timely fashion. Again, this is only possible if each component supports continuous visibility. Unfortunately:

    • Many key low-level components do not provide any visibility.
    • Many other components only provide discrete visibility.
    • Some limit visibility even further by providing discrete visibility through network sockets with endpoints that are off-host. As a result, co-located components are unable to examine each other’s visibility interfaces in any practical manner.

    In turn, the opaque, fragmented views that result from the discrete visibility in many components results in a fragmented mentality among developers. Engineers develop a mindset that they are implementing visibility only for themselves and their components, rather than thinking about their visibility as part of a whole—which provides a circular argument for justifying the discrete view they fall back on.

    Rather than thinking of passengers on a cruise ship and portholes, think of the components co-executing on a host as workers in a factory—with data moving through and between them. The current fragmented view places each worker in their own room, where they are unable to see the state of the other workers. With a holistic view supported by continuous visibility into one’s neighbors, workers can make better plans and decisions. And “factory monitors” can get a more holistic view of events and better correlate different components’ states. Being able to build useful context around observations is a key attribute of observability.

    In contrast, modern UNIX and Linux systems support continuous visibility for operating system and process metrics through the /proc interface. We can query /proc for a supported metric at any time. The utility (and success) of the /proc interface is unquestioned–being able to access process and system metrics through the filesystem namespace is a fantastic idea.5

    Applications and libraries have grown accustomed to the ability to query standard system metrics at will. If this mode of continuous visibility were to spread to the full stack, it stands to reason that the ecosystem would evolve to benefit from this enhanced observability. This should provide an impetus for the operating system to provide primitives to facilitate continuous visibility for the entire stack.

    But while we wait for visibility nirvana, there are some practical problems that need to be addressed. Some important visibility interfaces that currently exist are violating the prime directive in a big way.

    Prime Directive Violations

    I delivered a talk at SRECon 2021 entitled Latency Distributions and Micro-benchmarking to Identify and Characterize Kernel Hotspots, in which two of the hotspot case studies are examples of standard, commonly-used visibility interfaces that violate the Non-Interference Prime Directive. Let’s examine those two cases.

    When the Cost of Running Netstat is Too Dang High

    We recently discovered that netstat can seriously delay the creation and destruction of UNIX domain subsystem (UDS) sockets on Solaris. More specifically, in Solaris, the kstat mechanism to query for the list of all active UDS sockets (an ioctl call) can take seconds of CPU time, especially when there are tens of thousands of the sockets in the system. By itself, this makes logical sense and is not a problem since more sockets means more data transferred from the kernel to the user space. But the impact of a long netstat run time on actual UDS socket creation and destruction is surprising (and disappointing).

    Here is the output of a program I wrote which collects a logarithmic histogram of the socket() and close() times for creating and destroying UDS sockets 100K times on a Solaris 11.3 system:

    <1us

    <10us

    <100us

    <1ms

    <10ms

    <100ms

    <1sec

    >1sec

    max

    socket

    0

    0

    72556

    27433

    11

    0

    0

    0

    1967055ns

    close

    0

    98262

    907

    815

    16

    0

    0

    0

    1364475ns

    Now, here are the results from the same program, but this time I’ve concurrently run a single instance of netstat -f unix:

    <1us

    <10us

    <100us

    <1ms

    <10ms

    <100ms

    <1sec

    >1sec

    max

    socket

    0

    0

    39006

    60976

    18

    0

    0

    0

    2137995ns

    close

    0

    96837

    1388

    1757

    15

    2

    1

    0

    308073600ns

    Look at how the single netstat call has pushed the maximum close time from about 1ms to over three seconds!6 And it looks like the distribution of socket() times that was clustered in the 10-100usec range has increased to be more clustered in the .1-1msec range. The act of running netstat has a huge impact on the time to create and close UDS sockets.

    Disabling netstat is not the right long-term solution, as doing so would eliminate key visibility. Artificial throttling of netstat usage is also not the right long-term solution, as this compromises the timeliness of visibility (i.e., continuous visibility). The right thing to do is to eliminate this tight coupling between netstat monitoring and the UDS.

    When PS Stands for “Pretty Slow”

    Before Linux aficionados smugly dismiss monitoring interference as only a Solaris problem, there is potentially an even bigger problem on Linux. There, the monitoring contention is seen by accessing /proc itself and is of the “contending observers” type.

    Let’s look at running concurrent instances of “ps auxww” on one of our Linux development boxes with 36 cores and 72 hardware threads (RHEL 7.6):

    Concurrency

    Wall time (avg)

    User time

    Sys time

    1

    .984

    .081

    .902

    2

    1.269

    .071

    1.013

    4

    3.043

    .066

    1.429

    8

    4.106

    .070

    1.396

    As we can see, with increasing concurrency, the average wall time for ps completion goes up (along with system CPU time). The ps instances compete with one another!7 This is even more surprising since ps is essentially a read-only operation.

    Further tests showed that /proc traversal for processes and threads not only contend with each other, but also that they contend with access to other, non-process related special files under /proc (e.g., /proc/vmstat). This is significant because so many libraries and applications depend on non-process data available through /proc to make runtime decisions.

    My colleague Gary Liku will be presenting additional findings around this /proc contention problem at SRECon22 EMEA in late October.

    What Happened?

    In the old days, tools like ps and netstat would obtain their data by opening the special file /dev/kmem – a file-based interface to the kernel virtual address space. If we knew the virtual address for an object and its size, we could simply seek to the virtual address in that file and read() the object. The decoupled nature of this read meant that it was impossible to do any synchronization or coordination with actual code that operated on the object. An object could change in the middle of a read.8 As mentioned earlier, the expectations around monitoring data consistency can be looser than the standard data flows that most software engineers deal with. This decoupled data access adhered to the Non-Interference Prime Directive and suited the monitoring use case very well.

    In modern UNIX systems, the use of /dev/kmem has fallen out of favor–and for good reason. In addition to the performance overhead of seek/read to access kernel objects, /dev/kmem gave all-or-nothing access to the full kernel virtual address space. This meant that applications that did monitoring via /dev/kmem had to also be trusted with elevated privileges.

    The general purpose decoupled access through /dev/kmem has been replaced with (potentially) coupled access to kernel objects through interfaces like /proc on many UNIX and Linux systems. But, as we have concluded, just because coupled access is allowed does not mean that it should be exercised without consideration of the interference cost.

    Assuming that a visibility interface will be used sparingly or sporadically often turns out to be a bad assumption. The more useful a visibility interface, the more often it will be used.

    Visibility in User Space

    As mentioned earlier, while the operating system provides continuous visibility interfaces (e.g., /proc) for accessing well-known system and process metrics, application code generally does not. It can be argued that, in avoiding continuous visibility interfaces, applications are also able to avoid the problem of interference and observer contention–and that would be a valid argument. But, I feel that the ideal of holistic views of the co-located components of a system is so compelling that applications should either (1) lobby for the operating system to provide proper continuous visibility primitives for applications (/proc provides an excellent framework for building such primitives) or (2) implement their own continuous visibility interfaces.9

    Java and the JVM provide examples of how continuous visibility interfaces can work in user space. Very early on, Java’s designers saw the benefit of continuous visibility into JVMs and came up with the Java Management Extensions (JMX) framework. Through this framework, the JVM, Java libraries, and Java applications are able to expose metrics through getters on management beans. These getters can be discovered through a common namespace. JMX also allows external clients to invoke these getters through a standardized remote procedure call mechanism.

    Getters can be implemented as simply as returning the current value of an object that summarizes code state, or implemented with arbitrarily complex code–including invoking getters on other management beans or querying remote databases. But, the overhead and non-interference concerns outlined earlier should apply to getters implemented for performance visibility.

    Finally, it is interesting to note that Oracle (and perhaps other) JVMs also implement a lower-level metric exposure mechanism that leverages a memory-mapped file to provide a shared memory interface to JVM metadata and some low-level metrics.10 Even with the continuous visibility provided by JMX, JVMs also recognize the advantages of lower overhead, more decoupled, coordination-free visibility utilizing shared memory.

    We should all keep the prime directive in mind and design our visibility mechanisms in the least intrusive, most decoupled manner that is practical.  Or as users, require that the visibility mechanisms that we use adhere to the prime directive.


     1Yes, I know; Big Ben is not actually the name of the tower with the clock faces: https://en.wikipedia.org/wiki/Big_Ben

     2These implementations are not useless. But they are generally relegated to being used for performance debugging – often in non-production environments.

    3Similar compromises are taken when building loosely coupled distributed systems—especially in extremely large systems where eventual consistency is an acceptable norm. We need to think of the design of monitoring systems as loosely coupled with the system being observed.

    4Although recent insights from cognitive neuroscience suggests that this complete visual view is actually an illusion created by our brains: https://www.science.org/doi/10.1126/sciadv.abk2480. But the concept of an accurate holistic view of the state of systems remains an ideal goal.

    5Unfortunately, no one has chosen (yet) to implement a low cost, low interference, low contention mechanism like the one I prototyped for UNIX SVR4.

    6The amount of impact of netstat on UDS socket creation and close turns out to be a function of the number of UDS sockets on the system. The more UDS sockets, the greater the impact.

    7This behavior gets more pronounced as the number of lightweight processes/threads in the system increases because the overhead appears to grow quadratically.

    8My memory access prototype, which was orders of magnitude less expensive than a read of /dev/kmem, was also decoupled in a similar manner.

    9Everywhere I go, I re-implement my libmetrix C library—metric registration and exposure through memory mapped files which approximates what I believe would be ideal metrics primitives based on /proc. An ideal metrics registration and exposure interface for user-level libraries and applications should be implemented under /proc itself.

    10Similar in spirit to my aforementioned libmetrix library.

    Thanks

    Thanks again to everyone who provided feedback on earlier drafts of this installment. And again, special thanks to Peter Wainwright for helping to get my thoughts better organized for this installment.

  • Datadog Extends Reach of Integrated DevOps Platform

    Datadog Extends Reach of Integrated DevOps Platform

    At its Dash 2022 conference, Datadog announced today it is extending the reach of its namesake cloud-delivered monitoring and observability platform to address continuous testing, application security and cost management.

    In addition, Datadog has made available in beta a Data Streams Monitoring tool that makes it simpler to identify upstream issues that are likely to impact DevOps workflows. Also in beta is a Dynamic Instrumentation tool that makes it possible to employ Datadog agent software to collect data on the fly from specific source code to investigate performance issues. Datadog is also making available in beta a Resource Catalog to make it easier to navigate cloud resources that IT teams are employing and has added a Datadog Workflows tool to create blueprints to for automating repeatable processes.

    Datadog is also expanding the reach of its Watchdog telemetry analysis service infused with machine learning algorithms to add beta support for containers. There is also now a beta of an Event Management tool that DevOps teams can employ to more easily investigate a stream of related alerts using the Watchdog service.

    The Datadog Continuous Testing service, now generally available, provides DevOps teams with a workbench for generating and maintaining tests that can be integrated within continuous integration (CI) workflows. Datadog has also added an Intelligent Test Runner tool, in beta, to enable DevOps teams to only run tests that need to run when a change is made by analyzing code execution paths to increase developer productivity.

    Renaud Boutet, senior vice president of product at Datadog, said the goal is to make it possible for DevOps teams to create and run tests from within the Datadog user interface in parallel using a set of no-code tools without having to employ scripts. The capability will make it possible to automatically generate tests using data collected by the Datadog platform as part of an infinite DevOps workflow loop, he added.

    At the same time, Datadog is making generally available a cloud security management service that combines its existing cloud security posture management (CSPM) service and the cloud workload security (CWS) service to provide an integrated cloud-native application platform (CNAP) at no additional cost. In addition, Datadog is making it possible to block access to application components that are under attack or might be attacked in real-time based on the known vulnerabilities detected using tools that are currently in beta.

    That approach reduces the total cost of cybersecurity by providing IT teams with a single service through which they can manage application security using a platform Datadog gained last year with the acquisition of Sqreen.

    Finally, Datadog is making generally available a cloud cost management tool that leverages its monitoring capabilities to enable organizations to automatically attribute spend to applications, services and individual teams. Changes to spending patterns that impact costs are surfaced alongside the same tools IT teams are already using to monitor their cloud computing environment. That unified visibility increases awareness of costs in a way that encourages DevOps teams to optimize the utilization of multiple classes of cloud resources.

    The services being added are extensions of a Datadog platform that employs a single set of agents it provides. The Datadog platform also supports the open source OpenTelemetry agent to deliver a wide range of services. That approach eliminates the need for IT teams to deploy multiple agents each time they add an additional monitoring, security, testing or cost management tool.

    Datadog has been making a case for an integrated platform that reduces the level of integration effort DevOps teams would otherwise need to expend when deploying separate point products to address monitoring, observability, security and cost management issues. That approach makes it easier for DevOps teams to collaborate and reduces the total cost of DevOps. In contrast, each time a DevOps teams adds a point product to address a specific issue, they need to deploy and maintain a separate set of agents.

    In the longer term, it’s not clear how problematic that agent issue will be once open source OpenTelemetry agent software is more widely employed. However, it may still be years before open source software provides the same capabilities that are available today using proprietary agent software.

    It may take some time before every application is as fully instrumented as it should be, but as monitoring and observability platforms continue to evolve, it is possible to more proactively manage application environments.