Scalyr has moved to reduce the cost of observability by enabling DevOps teams to retain log and event data in S3-compatible object storage systems than use a pay-per-TB-scanned pricing model to interrogate that data.
Company CEO Christine Heckart said the Scalyr Hindsight service will make it possible for IT teams to more cost-effectively store historical event data if they so choose. This option comes at a time when they are under pressure to reduce the total cost of IT as a result of the economic downturn brought on by the COVID-19 pandemic.
Scalyr Hindsight complements an existing real-time log analytics platform that Scalyr provides via a software-as-a-service (SaaS) platform. However, IT teams no longer are required to store data in the Scalyr cloud platform itself.
Heckart said collectively Scalyr Hindsight and the company’s core log analytics platform provide an alternative to custom log analytics platforms based on open source Elasticsearch, Logstash and Kibana (ELK) software that can be difficult to maintain and scale. The core Scalyr log analytics cloud service, built on top of a columnar database, is now capable of ingesting more than 200TBs of data per customer per day in real-time at a price that can be lower than $5 per GB. The Scalyr Hindsight platform only charges fees when data stored is actually scanned.
With the rise of microservices, analytics that can be applied broadly at reasonable price points has become a major issue. Previously, IT teams might have limited their usage of analytics tools to their most important monolithic applications. Because of the way many of those platforms priced their software, IT teams found it necessary to also limit the amount of data that might be stored in these platforms. Given the complexity of microservices-based applications that tend to have lots of dependencies, an observability platform that provides an affordable approach to gaining insights into modern application environments is now required.
Heckart said Scalyr also offloads the management of the observability platform from the internal IT team. Given the massive amounts of data that needs to be stored and managed, Heckert noted it’s not uncommon for data lakes that IT teams manage to become swamps simply because there are no dedicated resources to manage them. It’s not clear how many IT teams might be willing to give up managing their own observability platforms in favor of only needing to access analytics tools, but the one thing that is clear is the cost of support open source platforms tends to climb over time. IT teams may find an ELK-based approach initially sufficient only to discover the platform needs to be replaced as the number of applications that need to managed starts to increase.
Regardless of who manages the underlying log analytics platform, it’s no longer feasible for most internal IT teams to manage modern application environments without the aid of an advanced set of analytics applications.
Logz.io today at the AWS re:Invent 2019 conference launched Cloud Observability Platform, a monitoring and security cloud service based on ELK—open source Elasticsearch, a search engine; Logstash, a data processing pipeline; and Kibana, a set of visualization tools—and Grafana, an analytics and monitoring platform.
Company CEO Tomer Levy said it’s become apparent that developers have a strong preference for open source tools for managing cloud-native applications. As such, the adoption of ELK has increased substantially. With the increasing maturity of Grafana, it’s also becoming clear that organizations want to meld the open source analytics and monitoring tool with previous investments in ELK tools, he said.
However, not many IT organizations have a lot of ELK and Grafana expertise. To fill that gap, Logz.io is launching a managed cloud service based on Logz.io Log Management, an instance of ELK that the company has enhanced with machine learning algorithms and data analytics capabilities to enable DevOps teams to discover and resolve issues faster.
That core platform is being extended via Logz.io Infrastructure Monitoring, a beta release of a monitoring platform based on Grafana, and a security information and event management (SIEM) platform dubbed Cloud SIEM, based on an ELK stack that includes built-in threat detection tools.
In addition, Levy said Logz.io plans to add support for Jaeger, an open source distributed tracing tool being developed under the auspices of the Cloud Native Computing Foundation (CNCF).
Levy said it’s apparent to all that observability is a core tenet of DevOps, which he said is why there are already a half-million developers making use of ELK software. The challenge organizations are finding is that monitoring modern IT environments based on cloud-native applications is cumbersome and time-consuming. Logz.io is addressing that issue by providing an enterprise-grade instance of an open source monitoring platform that comes with hundreds of built-in connectors, which enables DevOps teams to employ a monitoring platform without having to be worried about becoming locked in to a specific vendor because they can switch over to open source code anytime they like, Levy noted.
Developers tend to favor open source tools because they don’t have to wait on purchasing approval to employ them. However, enterprise IT organizations tend to favor platforms that are supported by a commercial vendor. Logz.io is trying to address that issue by providing support for an open source platform that will make enterprise IT organizations comfortable enough to give up relying on a proprietary monitoring platform. Thus far, Logz.io has more than 700 customers, which the company expects to expand now that it has an instance of its platform that can be consumed as a cloud service.
It’s too early to say to what degree an open source platform might usurp proprietary platforms in the enterprise. Change tends to come slowly to enterprise IT organizations. However, as organizations embrace next-generation applications based on microservices and containers, enterprise IT organizations are clearly evaluating their monitoring platform options going forward.
Currently, AWS is the leading cloud provider. However, with Azure gaining more and more momentum, all three major cloud providers are scrambling to offer their customers the best open source options and empower them to use the tools they know and love in a manner that is convenient and native to their cloud environments.
Going Big on Open Source
Today, Logz.io and Microsoft Azure announced that our ELK-as-a-service will now be offered on Microsoft Azure. Logz.io offers an intelligent machine data analytics platform built on ELK and Grafana, two of the most popular open source monitoring and troubleshooting tools. Our platform enables engineers to easily deploy, run and scale ELK without the hassle and pain of maintaining and managing the stack themselves.
Now, with Logz.io for Azure, users can use open source ELK as a highly integrated experience in Azure. The new offering includes seamless integrations to various Azure services, out-of-the-box Azure dashboards, built-in alerting and crowdsourced machine learning capabilities.
The integration between Logz.io and Azure is not only significant in the context of the cloud wars, but in the culture of Microsoft itself. While the company was previously associated with a more proprietary structure, they have made tremendous strides in recent years toward empowering open source by opening its .NET framework and Azure SDK, as well as their acquisition of GitHub.
According to Julia Liuson, corporate vice president of Microsoft’s developer division: “At Microsoft, we see open source as a major driver of innovation within the engineering community. Since we strive to empower our customers and facilitate their success, it is important to us to meet them where they are by making it easy to access and use open source tools. Our partnership with Logz.io will strengthen Microsoft Azure ties with the developer community, enabling teams to easily build and monitor their products using ELK.”
AWS vs. Google Cloud
Microsoft’s investment in ELK comes just in time to provide an answer to its competitors, AWS and Google Cloud. Just two months ago, AWS announced Open Distro for Elasticsearch, which in their own words “is a value-added distribution of Elasticsearch that is 100% open source (Apache 2.0 license) and supported by AWS.” The new offering includes managed Elasticsearch and Kibana along with features such as built-in alerting, security and more. This was AWS’ most recent appeal to the engineering community, offering one of the most popular monitoring tools as a managed service on AWS.
Following this release, Google Cloud announced its own open source offering featuring integrations with leading companies such as Elastic, MongoDB, Confluent and more. According to Google, the purpose of these integrations was to “provide users with a seamless user experience and the ability to easily leverage these open-source technologies in Google’s cloud.”
Is Open Source the Future?
If what’s happening between cloud vendors is any indication of future trends in the engineering space, it seems imperative that all organizations targeting DevOps teams must consider how they’ll fuel open source and empower its vast user community. At Logz.io, we are proud to be part of this initiative.
Overall, it is great to see the strides large organizations are taking in furthering the interests of the developer community and enabling them to work using the tools, methodologies and strategies that best suit their workflows and ideals.
As we close out 2018, we at devopsy.kinsta.cloud wanted to highlight the five most popular articles of the year. Following is the fifth in our weeklong series of the Best of 2018.
As organizations face outages and various security threats, monitoring an entire application platform is essential to understand the source of threat or where the outage occurred, as well as to verify events, logs and traces to understand system behavior at that point in time and take predictive and corrective actions. Monitoring the logs and logs analysis are important for any IT operations teams to identify intrusion attempts and misconfigurations, track application performance, improve customer satisfaction, strengthen security against cyberattacks, perform root cause analysis and analyze system behavior, performance, measures and metrics based on the logs analysis.
According to a Gartner report, the market for monitoring tools and APM tools is expected to grow to $4.98 billion by 2019, and log monitoring and analytics will become a de facto part of AI Ops. Log analysis tools are emerging as a low-cost solution for monitoring both application and infrastructure (hardware and network).
There are mix of commercial and open source tools available as the log monitoring analysis tools market has matured. Some of the key features of log monitoring tools include powerful search capabilities, real-time visibility with dashboards, historical analytics, reports, alerts notifications, thresholds and trigger alerts, measurements and metrics with graphs, application performance monitoring and profiling and tracing events. This article focuses mainly on the differences in log monitoring tools ELK, Splunk and Graylog.
ELK, Splunk and Graylog
Elastic has put together arguably the most popular log management platform for both open source and commercial (cloud and enterprise) log monitoring tools. The Elastic Stack—more commonly known as ELK Stack—combines Elasticsearch, Logstash and Kibana. Elasticsearch is a modern search and analytics engine based on Apache Lucene, while Logstash provides data processing and enrichment. Kibana offers logs discovery and visualization.
Splunk is a platform for searching, analyzing and visualizing the machine-generated data gathered from the websites, applications, sensors, devices etc. covering the entire infrastructure landscape. It communicates with different log files and stores files data in the form of events into local indexes. It provides the easiest way of search capabilities and has wide array of options to collect logs from multiple sources. Splunk is available in both SaaS and enterprise editions.
Graylog offers open source log monitoring tools providing capabilities similar to ELK and Splunk. Graylog performs centralized log monitoring; where Graylog is used for data processing and Elasticsearch, MongoDB used for search and storage. It provides log archival and drill-down of metrics and measurements.
The below table provides the comparison analysis based on the open source/free trial editions of ELK, Splunk and Graylog.
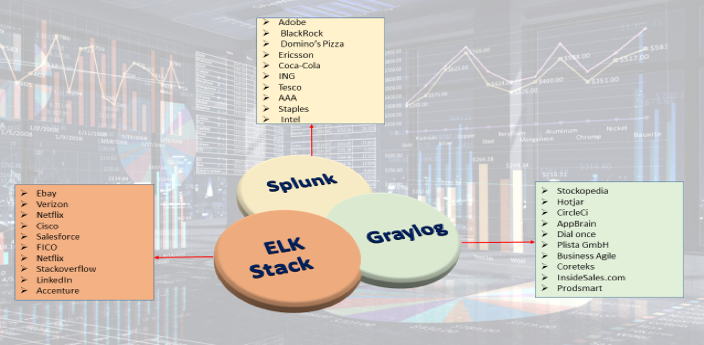
Top 10 Companies using log monitoring tools (ELK Stack, Splunk, Graylog). Information source collected from ELK, Splunk and Graylog websites.
Search filter with fields levels, saved searches, graphs, etc.
Filter logs applying transforms to events
Uses Drools rules, extractors, fields filter
Blacklisting,
Visualization
Reporting
Historical Data Management
Available in X-Pack component
Quickly generate reports of any kibana visualization or dashboard and any raw data.
Each report is print-optimized, customizable and PDF-formatted
Built-in feature
Reports are created for saved search, visualization or dashboard, set up schedule report, configure the priority of schedule report with support on Historical and streaming data
No built-in reporting capability
REST API can be used to generate own reports on the history data and streaming data.
Alerting
Supported through X-pack / watcher configurations can be created
Integrations available to send alerts to AIOps tools
Built-in feature, support real time or scheduled alerting
Integrations available to send alerts to AIOps tools
Built-in feature
Alerts raised based on stream
Integrations available to send alerts to AIOps tools
Monitoring
Server, Device Logs Monitoring
Uses Metricbeat, Filebeats for capturing server-related logs
Using Splunk Insight For Infrastructure
Uses Graylog Beat , NXlog
Network Logs Monitoring
Captures network logs through Packetbeat
Uses Splunk MINT to capture network logs
Uses SNMP & netflow Plugin
Cloud Logs Monitoring
Using Logstash, Filebeat, modules
Configurable via add-ons in Splunk, for different clouds
Plugins available to pull logs from cloud.
Containers Log Monitoring
Using Logstash, File Beat & Metric Beat, Logstash processors for Docker logs
Using Fluentd, metric beat to ingest logs from Kubernetes
Using collector built for Kubernetes
Using Filebeat collector sidecar
DB Log Monitoring
Enabled through Filebeat modules, Logstash
Enabled through Splunk add-ons for different databases and Splunk DB connect
Enabled through Add-on plugins and GLEF libraries for different databases including mysql, mongodb, etc.
End User Transactions Monitoring, Application Performance Monitoring
Enabled through APM and different beats, Logstash correlation, X-Pack components.
Enabled through Splunk App for Synthetic monitoring, Splunk ITSI Modules, Splunk MINT SDK.
Application logs and add-ons from marketplace.
Analytics
(Causal Analysis, Anomaly detection, etc)
Supports Machine Learning via X-Pack.
Splunk IT Service Intelligence Modules provides machine learning algorithms for anomalies, etc.
No out-of-box machine learning support
Others
Customization / Extensibility
Can create customized dashboards with Kibana controls and search queries.
Custom Metricsets and Plugins
Custom rules can be created to define thresholds and alerts
Can extend / integrate with other tools via webhooks / plugins and programmatic access via REST HTTP/JSON API
Hosted Elastic Stack provides out-of-box user management features, via X-Pack.
Flexible to add/ edit new components and views to Splunk dashboards using SplunkJs stack and Javascripts.
Can create custom metrics indexes and collect data using statsD, collectD.
Can extend / integrate with other tools via webhooks / plugins and programmatic access via REST HTTP/JSON API with 1000+ add-ons.
Out-of-box user management.
Slunk Enterprise Security
Flexible to add Custom dashboards based on stream using widgets, graphs, CLI stream dashboards.
Can create custom index models, custom extractors with metrics needed using REST API, content packs.
Provides few out-of-box alerting with default conditions with custom alerts defined on the streams and conditions.
Plugins are available in Graylog, to integrate with other tools
Provides user-management, LDAP and other authentication mechanisms (single-sign on/two-factor) integrations.
Scalability
Supports scalability(horizontal) and high availability with master / slaves cluster.
Scalable with distributed deployment of Splunk Enterprise components for data input, indexing and search.
Scalable with multiple nodes on ES, MongoDB, Graylog server, along with any queues (Kafka / RabbitMQ).
Backup / Restore
Can take snapshots backup of indexes to any external repository such as S3, Azure, etc.
Retention on ES through Elasticsearch curator.
Supports backup of configuration, indexes, warm db buckets based on policies.
Archival Plugin available in Graylog Enterprise, to back up indexes and restore to new cluster, via web UI, Rest API
Log monitoring is very essential as part of full stack monitoring, which can provide better insights for faster troubleshooting. The choice of log monitoring tools will depend on your requirements, infrastructure, price and monitoring and maintenance needs. Elasticstack, Splunk and Graylog have enterprise-ready platforms and solutions for log monitoring, and all are widely used across multiple enterprises and domains.
This article’s purpose is to compare the “big two” in the log analytics world—Splunk and the ELK Stack. But before we go into details, a short introduction to the competitors is required.
Splunk is the “Google for log files” heavyset enterprise tool that was the first log analysis software and has been the market leader ever since. The open-source ELK Stack of Elasticsearch, Logstash and Kibana is an up-and-coming rival that is a consolidated data analytics platform. The two compete in terms of features, usability and cost.
Overview
Splunk and the ELK Stack use two different approaches to solve the same problem. People typically choose one or the other based on how their organizations are structured and how much time they want to devote to log analytics. Splunk takes a pile of data and allows people to search through the information to extract what they need. ELK requires more work and planning in the beginning, but the value extraction is easier at the end.
The three key components of Splunk are its forwarder, which pushes data to remote indexers; indexer, which has roles for storing and indexing data and responding to search requests; and search head, which is the front end of the web interface where these three components can be combined or distributed over servers. Splunk also supports the integration of its functionalities in applications via SDKs. Common use cases include operational monitoring, security and user behavior analytics. Splunk is a paid service wherein billing is generated by indexing volume.
The ELK Stack is a set of three open-source products—Elasticsearch, Logstash and Kibana—all developed and maintained by Elastic. Elasticsearch is NoSQL database that uses the Lucene search engine. Logstash is a data processing and transportation pipeline used to populate Elasticsearch with the data (though also it supports other destinations including Graphite, Kafka, Nagios and RabbitMQ). Kibana is a dashboard that works on top of Elasticsearch and facilitates data analysis using visualizations and dashboards.
Both Splunk and the ELK Stack can be used to monitor and analyze infrastructure in IT operations as well as for application monitoring, security and business intelligence.
ELK vs. Splunk
Loading Data
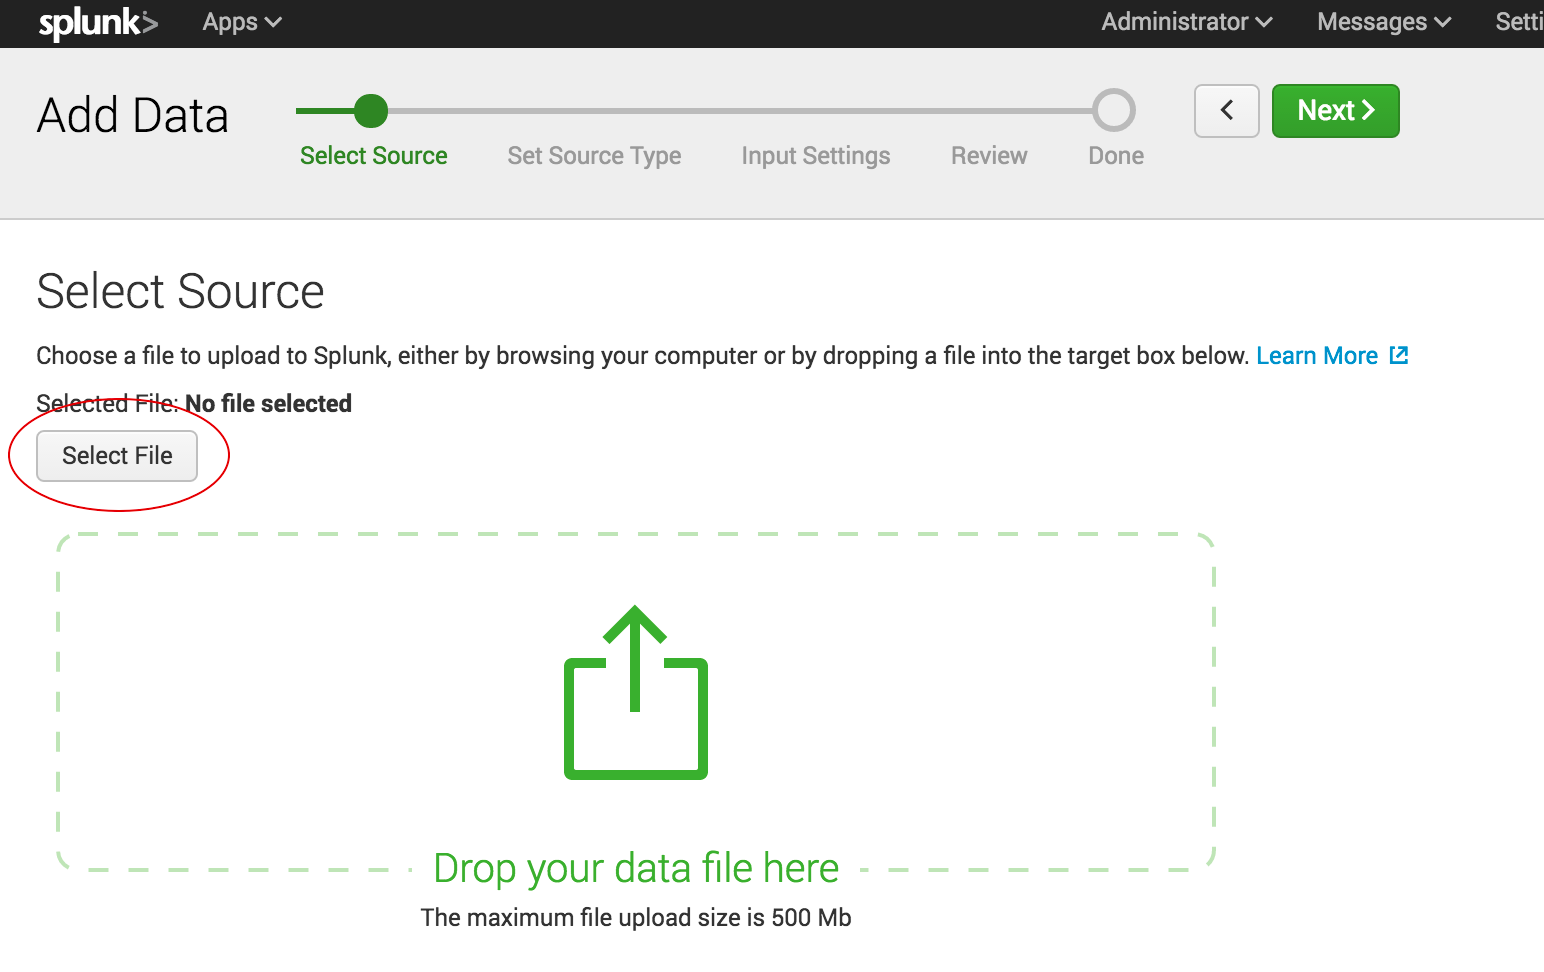
Shipping data to Splunk is fairly easy. After installation, the forwarders come pre-configured for a wide selection of data sources such as files and directories, network events, windows sources and application logs, and they are used to import data into Splunk as shown:
In the ELK Stack, Logstash is used to ship data from the source to the destination. However, Logstash needs to be configured so that each field is identified before the data is shipped to Elasticsearch. This kind of configuration can be tricky for those who do not work with scripting languages (such as Bash, Python or Ruby), but there is good support online that can be found quite easily.
Visualizations
The Splunk web UI includes flexible controls that allow you to edit and add new components to your dashboard. Management and user controls can be configured differently for multiple users, with each having a customized dashboard. Splunk also supports visualizations on mobile devices with application and visualization components that are easy to customize using XML.
Kibana is the visualization tool in the ELK Stack, and like Splunk, the platform supports the creation of visualizations such as line charts, area arts and tables and the presentation of them in a dashboard. The search filter is always shown above the different views: If a query is used, it is automatically applied on elements of the dashboard. Splunk also has a similar option, but it involves configuration in XML. Still, Kibana does not support user management, but hosted ELK solutions provide it out of the box.
Search Capabilities
The search function is a key capability of any log management platform. Both the Splunk and ELK Stack’s web UIs support searching using a dedicated search field. The query syntax on Kibana is based on the Lucene query syntax while Splunk uses its own Splunk Search Processing Language (SPL). Those familiar with scripting languages may already be familiar with Lucene while SPL is proprietary and must be learned.
One other difference is that Splunk offers dynamic data exploration to help users to find and extract everything as a searchable field when formatted in a manner that allows searching for non-configured fields. Elasticsearch fields, on the other hand, need to be defined in advance to use aggregation over the log properties.
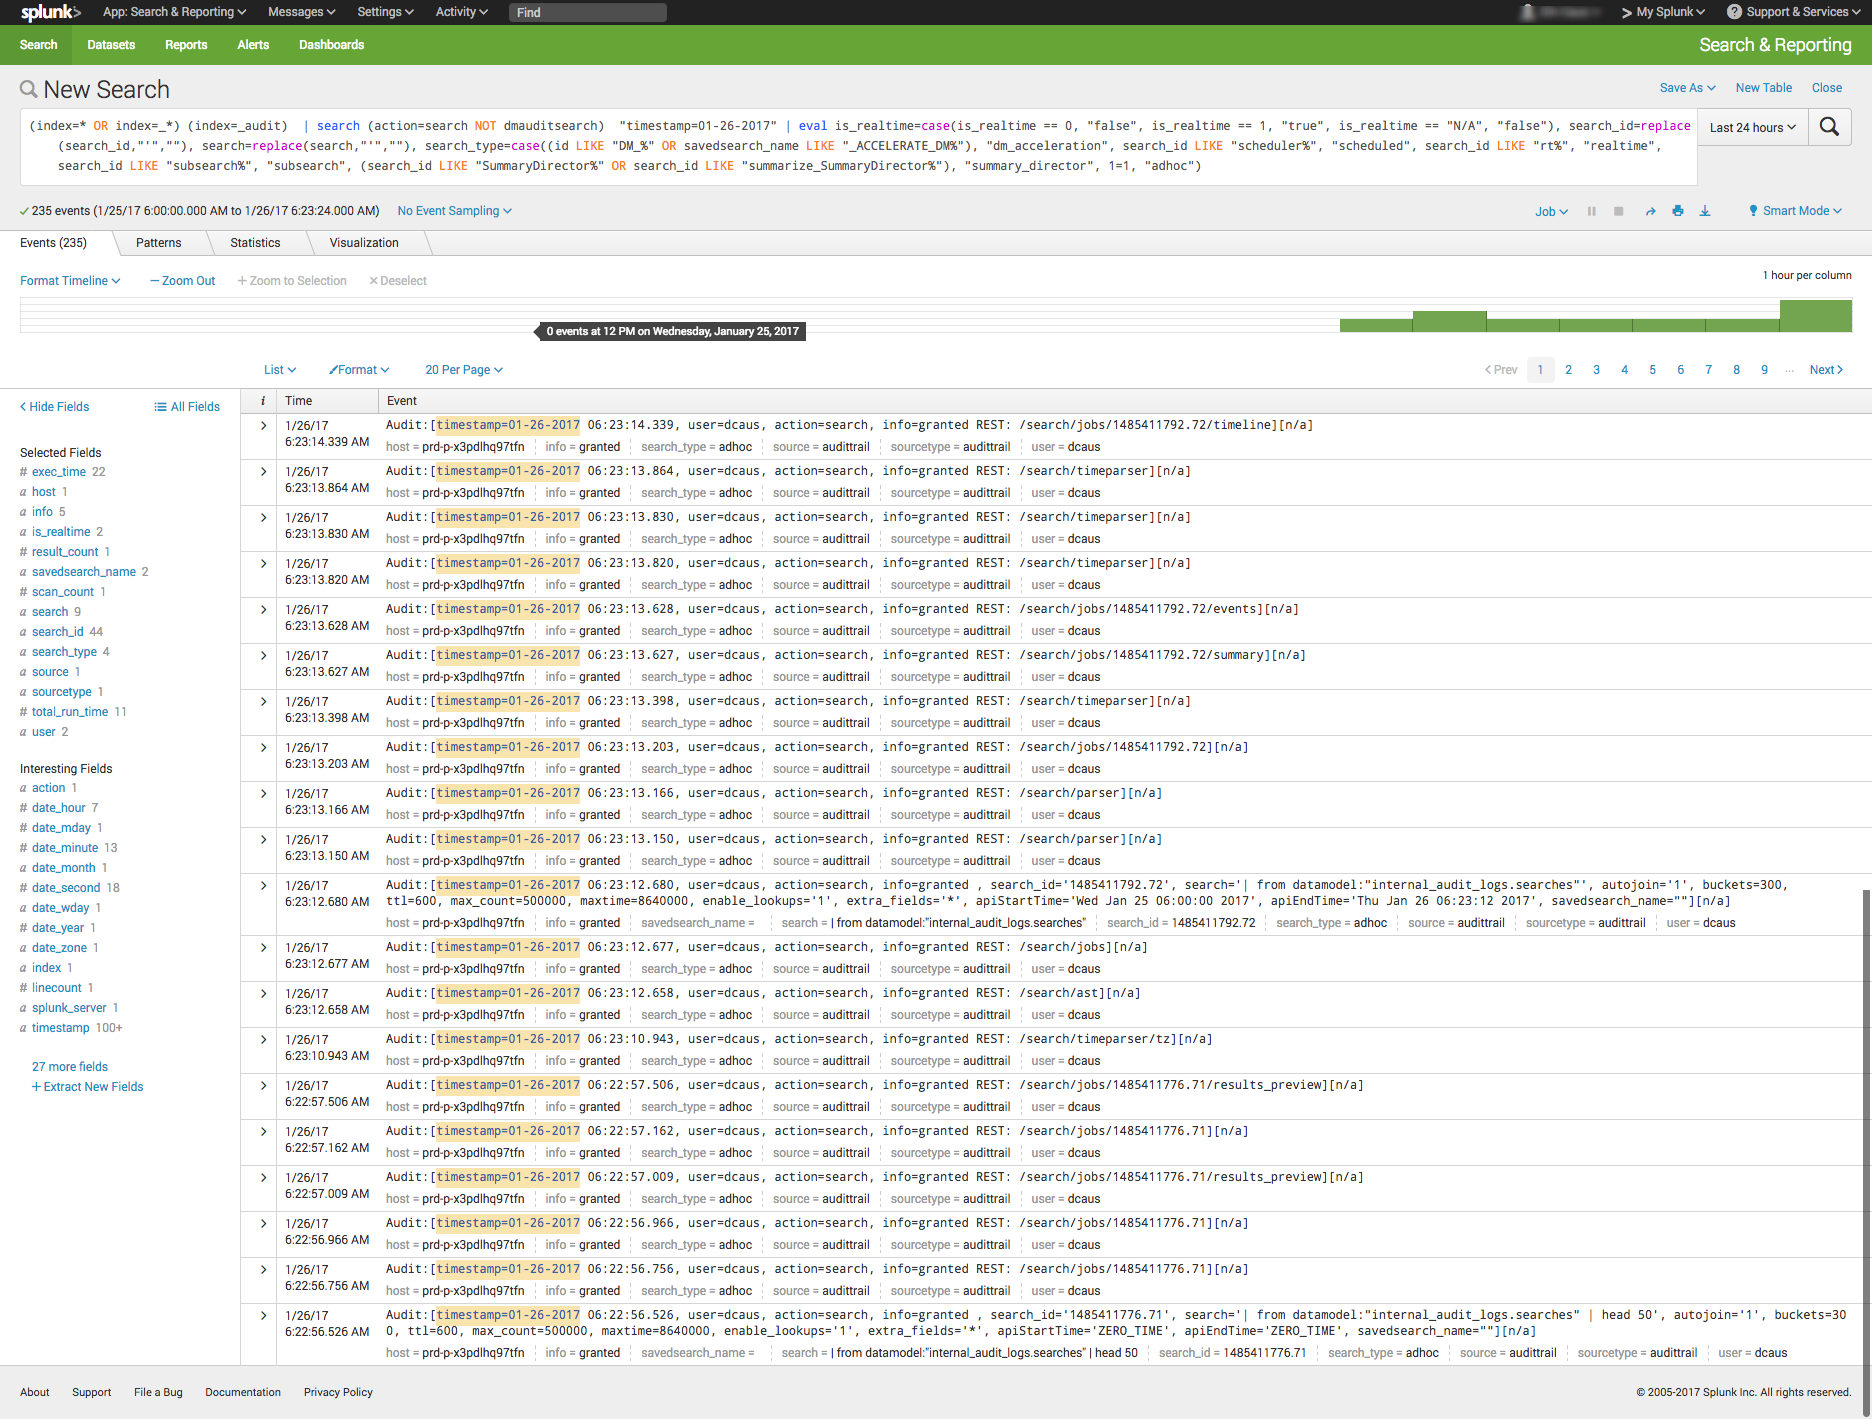
Here is one example of a query for each platform.
Kibana:
(beat.hostname: ES1 AND metricset.name: process) AND (system.process.username: root OR system.process.username: admin)
Splunk:
(index=* OR index=_*) (index=_audit) | search ( action=search NOT dmauditsearch ) "06:54"
The difference between SPL syntax and Lucene queries is that SPL supports the search pipeline (as in the example above) in which consecutive commands are chained together using a pipe character that allows the output of one command to be used as the input of the next one. Lucene query syntax is more straightforward and can work to generate the output from the query without additional transforming.
Traction and Community Support
Both Splunk and ELK Stack have large communities of users and supporters. ELK also has its own clear and extensive documentation for each separate tool, making it easy to get started. In addition, Elastic itself offers educational sessions worldwide.
In addition to having good documentation and a forum, Splunk, too, has customer and support platforms that offer various professional services. Splunk’s education program and instructors are available virtually or on site.
The Learning Curve
The ELK Stack’s learning curve is flat for what it’s meant to do. Elastic offers paid courses, but there is a lot of free material online due to the popularity of the open-source platform.
For Splunk, the learning curve is moderate in size, especially when carrying out more specialized analyzes. The company offers a trial period with extensive documentation, but the advanced Splunk educational courses are fairly expensive.
User Management
The ELK Stack provides role-based security as a separate paid tool. Splunk and managed-ELK services offer user management out of the box with user auditing included.
Pricing Levels
As already mentioned, Splunk is proprietary software with a price tag. After one integrates several data sources with the platform, the cost will increase greatly as data is continuously generated.
The open-source ELK Stack is free, but the true picture is not so black and white. The cost of the platform’s hardware and maintenance also adds up. To lower the cost of using ELK, features, plugins and tools must be developed.
Vendor Lock-In
Splunk’s high price tag comes with the benefit of offering an overall, well-rounded product. Users might be locked into a vendor, but that one vendor is all that is needed to do nearly anything. The open-source ELK Stack is seemingly free, but it does not provide many functionalities such as alerting out of the box—and it costs money to develop and maintain them.
One way to look at the Splunk-versus-ELK discussion is to frame it as the old Microsoft-versus-Linux debate. If you like Microsoft, you will probably prefer Splunk. If you like Linux, you will likely want to use the ELK Stack.
Final Thoughts
When one decides between these solutions, the ultimate choice should reflect not only on the platform but also on the customer’s specific needs.
Both Splunk and the ELK Stack are currently popular. But what might the future hold?
Splunk (Blue) vs. Elasticsearch (Red) on Google Trends
According to Google Trends, the ELK Stack has now overtaken Splunk in terms of the proportion of Google searches. But ELK’s traction does not stop there. As mentioned earlier, Splunk self-reports 12,000 total users. Elasticsearch is reportedly downloaded 500,000 times every single month. In IT departments, then, it is far more likely to meet people who are familiar with ELK than with Splunk, meaning that the adoption rate of the ELK Stack could “snowball” and increase even more in the future whenever ELK users join new companies or teams. People tend to use whatever software they already know or is already being used.
It’s clear that many functionalities are being added to the open-source ELK Stack. This, in turn, is shrinking the gap between it and Splunk. hose features currently found only in Splunk are likely to be added to ELK at some point in time.
So, if a more mature product is what you need, go with Splunk. But if you like a product that is more flexible, ELK is the way. Either way, it’ll be interesting to see how these two continue to compete.