Tag: docker

  • Docker Advances Collaborative Application Development Platform

    Introduces Docker Development Environments, updates Docker Compose and bolsters security with Scoped Personal Access Tokens

    Palo Alto, CA, May 27, 2021 – Docker, Inc.™, today announced updates and enhancements to the Docker Collaborative Application Development Platform that help development teams increase velocity through new capabilities and improved workflows. Announced at DockerCon Live 2021, Docker is introducing three key enhancements including the introduction of Docker Development Environments, a new version of Docker Compose, and Scoped Personal Access Tokens for application pipeline automation. In a separate press release, Docker also announced an expansion of the company’s trusted-content offerings for the more than eight million registered Docker developers.

    “Today’s developers face a variety of languages, frameworks and architectures, as well as discontinuous interfaces between tools for each pipeline stage, resulting in application development that is enormously complex to get from source code to cloud runtime,” said Docker Vice President of Products Donnie Berkholz. “Today’s announcements empower developers to ship faster by bringing their ideas to reality with Docker.”

    Docker is a leading provider of collaborative application development platforms for development teams. Docker provides simplicity, velocity and choice for millions of developers who want to build, share and run great apps from code to cloud. Details on today’s announcement include:

    Docker Development Environments

    Docker Development Environments form the foundation of Docker’s new collaborative team development experience. It empowers teams to work better together to create value for customers by spending less time setting up and debugging environments, bringing the ease of use and reproducibility of containers to an interactive development environment. Developers can now easily share more than just their code, taking the dependencies and wider application context and sharing this with a teammate as simply as doing a docker push.Docker Development Environments will be available next month.

    Docker Compose v2

    Docker continues investing in Docker Compose, a developer favorite tool for running multiple container applications. A recent JetBrains survey, ‘The State of Developer Ecosystem 2020’, shows that 76% of developers use Docker Compose for running containerized applications during development. Version 2 incorporates the docker compose command into the Docker CLI. Recent releases of Compose now offer improved support for deep learning as well as multi-environment configurations. GPU support for Windows and Linux makes it easier for developers and data scientists to run GPU-heavy workloads such as deep learning. Service profiles make it easy to manage and switch between configurations, such as development, testing and production. Docker Compose v2 is currently available in Docker Desktop and will be included in the Docker Linux packages later in the year.

    Scoped Personal Access Tokens

    With access to software supply chains becoming a higher security concern, Docker is updating Personal Access Tokens (PATs) to support fine-grained permissioning. The new Docker token permissions, which are scheduled to release later this summer, include options to define access that is read only, read and write, or read public repos only. This security feature provides developers and their managers with tighter control over which teams, and which automated application delivery pipelines have access to their container images and applications, further expanding the Docker platform position in providing developers with tools for building secure supply chains. In addition to securing access to applications, the tokens also simplify cross-team collaboration, letting development teams decide which teams and systems they want to enable with unrestricted access to their content

    Additional overviews and demonstrations of these announcements will be covered today during the keynote presentations at DockerCon Live 2021 on Thursday, May 27 at 9 am Pacific time.

    DockerCon Live is a free, one-day virtual event that is a unique experience for developers and development teams who are building the next generation of modern applications. If you want to learn about how to go from code to cloud fast and how to solve your development challenges, DockerCon Live 2021 offers engaging live content to help you build, share and run your applications. Register today at https://dockr.ly/2PSJ7vn.

    Resources:

    About Docker

    Docker helps millions of developers efficiently and collaboratively build, share and run applications. The Docker collaborative application development platform provides developers with an unmatched experience for an integrated, reliable and secure workflow that accelerates app delivery from code to the cloud. Through a combination of the world’s largest marketplace of components and integrations with leading tools, Docker allows teams to rapidly create innovative applications. For more information, visit www.docker.com.

  • Docker Advances Collaborative Application Development Platform

    Introduces Docker Development Environments, updates Docker Compose and bolsters security with Scoped Personal Access Tokens

    Palo Alto, CA, May 27, 2021 – Docker, Inc.™, today announced updates and enhancements to the Docker Collaborative Application Development Platform that help development teams increase velocity through new capabilities and improved workflows. Announced at DockerCon Live 2021, Docker is introducing three key enhancements including the introduction of Docker Development Environments, a new version of Docker Compose, and Scoped Personal Access Tokens for application pipeline automation. In a separate press release, Docker also announced an expansion of the company’s trusted-content offerings for the more than eight million registered Docker developers.

    “Today’s developers face a variety of languages, frameworks and architectures, as well as discontinuous interfaces between tools for each pipeline stage, resulting in application development that is enormously complex to get from source code to cloud runtime,” said Docker Vice President of Products Donnie Berkholz. “Today’s announcements empower developers to ship faster by bringing their ideas to reality with Docker.”

    Docker is a leading provider of collaborative application development platforms for development teams. Docker provides simplicity, velocity and choice for millions of developers who want to build, share and run great apps from code to cloud. Details on today’s announcement include:

    Docker Development Environments

    Docker Development Environments form the foundation of Docker’s new collaborative team development experience. It empowers teams to work better together to create value for customers by spending less time setting up and debugging environments, bringing the ease of use and reproducibility of containers to an interactive development environment. Developers can now easily share more than just their code, taking the dependencies and wider application context and sharing this with a teammate as simply as doing a docker push.Docker Development Environments will be available next month.

    Docker Compose v2

    Docker continues investing in Docker Compose, a developer favorite tool for running multiple container applications. A recent JetBrains survey, ‘The State of Developer Ecosystem 2020’, shows that 76% of developers use Docker Compose for running containerized applications during development. Version 2 incorporates the docker compose command into the Docker CLI. Recent releases of Compose now offer improved support for deep learning as well as multi-environment configurations. GPU support for Windows and Linux makes it easier for developers and data scientists to run GPU-heavy workloads such as deep learning. Service profiles make it easy to manage and switch between configurations, such as development, testing and production. Docker Compose v2 is currently available in Docker Desktop and will be included in the Docker Linux packages later in the year.

    Scoped Personal Access Tokens

    With access to software supply chains becoming a higher security concern, Docker is updating Personal Access Tokens (PATs) to support fine-grained permissioning. The new Docker token permissions, which are scheduled to release later this summer, include options to define access that is read only, read and write, or read public repos only. This security feature provides developers and their managers with tighter control over which teams, and which automated application delivery pipelines have access to their container images and applications, further expanding the Docker platform position in providing developers with tools for building secure supply chains. In addition to securing access to applications, the tokens also simplify cross-team collaboration, letting development teams decide which teams and systems they want to enable with unrestricted access to their content

    Additional overviews and demonstrations of these announcements will be covered today during the keynote presentations at DockerCon Live 2021 on Thursday, May 27 at 9 am Pacific time.

    DockerCon Live is a free, one-day virtual event that is a unique experience for developers and development teams who are building the next generation of modern applications. If you want to learn about how to go from code to cloud fast and how to solve your development challenges, DockerCon Live 2021 offers engaging live content to help you build, share and run your applications. Register today at https://dockr.ly/2PSJ7vn.

    Resources:

    About Docker

    Docker helps millions of developers efficiently and collaboratively build, share and run applications. The Docker collaborative application development platform provides developers with an unmatched experience for an integrated, reliable and secure workflow that accelerates app delivery from code to the cloud. Through a combination of the world’s largest marketplace of components and integrations with leading tools, Docker allows teams to rapidly create innovative applications. For more information, visit www.docker.com.

  • Top Six Open Source Tools for Monitoring Kubernetes and Docker

    Top Six Open Source Tools for Monitoring Kubernetes and Docker

    Kubernetes and Docker are two of the most commonly heard buzzwords in modern DevOps conversations. Docker is a tool that enables you to containerize and run your applications, and Kubernetes provides you with a platform to orchestrate or manage these containers—since managing thousands of containers manually using the Docker CLI would be a practical nightmare. 

    However, simply running thousands of containers and managing them through Kubernetes is not enough. You have to observe and analyze them properly to ensure that your services are up and running optimally. This process is called Site Reliability Engineering (SRE), a term initiated and popularized by Google. Observability and analysis are a major element of SRE. It can be subdivided into the following three areas:

    • Monitoring allows you to extract numerical metrics from your applications and resources that can later be visualized and analyzed to present the current state of your resources. Once the metrics are extracted, they can be used to set up alert rules, facilitate profiling and debugging, and make better SRE decisions.
    • Logging enables developers to debug their containers in case of a failure. Containers are short-lived, and so are logs. Kubernetes and Docker do provide a native way of browsing container logs, but it is very limited in its functionality. As a result, a centralized log plane is a must in any container-oriented environment.
    • Tracing allows you to debug services running on a network and follow a request trail until the source of a problem can be determined. In a microservices architecture, when multiple services/containers send requests to each other to perform one business task, a proper tracing solution is necessary. 

    This article will list and describe the most effective open source tools for monitoring and analyzing services running as containers. 

    Prometheus

    Prometheus is the first tool that comes to mind when discussing open source monitoring solutions. It is very popular in the development community, and it is a graduate of the CNCF project, which focuses on the monitoring side of SRE. Originally created and open sourced by SoundCloud, Prometheus simplifies the process of pulling numerical metrics based on a time series from a given metrics endpoint. It was built to monitor highly dynamic container environments.

    Prometheus is subdivided into three elements: Prometheus server, Alertmanager and exporters. Exporters are stand-alone, independent processes/containers that can be run on your target resource to generate and export metrics via a metrics API. The Prometheus server then takes care of service discovery as well as pulling metrics from the exporters to be stored in the Prometheus DB and later used for visualization or alerting. Alertmanager is responsible for setting up alert rules, analyzing the data in the Prometheus DB and sending alert messages to multiple receivers if a certain rule is triggered. There are a huge number of exporters, listed here, which are both officially supported by Prometheus and maintained by the community. 

    Prometheus has become the industry standard for monitoring cloud-native architectures. While it is known for its simplicity with service discovery, its ease of use, its alerting capacity and its integration with Kubernetes, its polling architecture is not ideal. Currently, the metrics endpoint has to be reachable by the Prometheus server. However, there is a pushgateway implemented in Prometheus that enables metric pushing rather than polling. Another downside of Prometheus is that it doesn’t scale well. This problem can be fixed in the Thanos adaptation of Prometheus.

    Related tools and technologies: Grafana, Cortex, Thanos, Prometheus Exporters, Alert Manager, Istio, Prometheus Operator.

    Figure 1: Prometheus Graphs. Source: SoundCloudDev.

    Grafana

    Grafana is an open source metric analytics and visualization suite. It allows you to create custom dashboards using data taken from multiple sources, such as Prometheus, Elasticsearch, MySQL, Postgres and Redis. Furthermore, Grafana has its own alerting system and a role-based access control (RBAC) system for software. As a data visualization tool, Grafana is famous among Prometheus users for enabling them to effectively visualize the metrics stored in Prometheus. There’s a wide array of official and community-built custom dashboards for various data sources in Grafana, allowing users to easily set up dashboards (found at this link) and get on with monitoring. Grafana offers another associated product called Loki, which aggregates logs in Kubernetes and integrates well with the Grafana UI.

    Related tools and technologies: Loki, Prometheus.

    Figure 2: Kubernetes Resources Dashboard in Grafana. Source: Replex.

    Elastic Stack

    Elastic Stack is a group of open source products from Elastic designed to help users search, analyze, and visualize data from any type of source, in any format, in real time. This product was previously recognized as the ELK stack, where each letter of the acronym stood for one of the company’s main products: Elasticsearch, Logstash and Kibana. Elastic Stack provides both monitoring and logging solutions with the help of its big data database, Elasticsearch. 

    In order to aggregate logs, people tend to use Elasticsearch for storage, Logstash or Fluentd for log streaming, and Kibana for visualization. Fluentd is not part of the Elastic Stack, but it is widely used with Kubernetes to stream logs in place of Logstash, the tool provided by Elastic Stack. Similarly, Metricbeat is used to scrape metrics and set up visualizations on Kibana. The enterprise version of Elastic Stack ships with X-Pack, a set of additional tools that enables reporting, alerting and role-based access control (RBAC), among other features. By default, the Elastic Stack GUI, Kibana, does not support RBAC. You have to use the previously mentioned enterprise version of Elastic Stack to enable it.

    Related tools and technologies: X-pack, Metricbeat, Logstash, Kibana.

    Figure 3: Discover View in Elasticsearch. Source: XpresServers.

    Sensu Go

    Sensu Go is a telemetry and service health checking solution for multi-cloud monitoring at scale. It allows you to gain visibility into servers, containers, services, applications, functions and connected devices across any public or private cloud. Sensu can be run side-by-side with Prometheus to get the best out of both solutions, or it can be run natively without Prometheus. Sensu works best alongside Prometheus, since exporting application level metrics to Prometheus requires loading the Prometheus SDK to your application codebase and exposing a metrics endpoint. The endpoint is then scraped and stored in the Prometheus Server. This may sound like a lot of work—and, sometimes, it is. Sensu avoids this complexity by using a sidecar concept. A Sensu agent is deployed alongside your application. The agent constantly collects and exposes metrics to the Prometheus server without your having to change the application codebase.

    Sensu works without Prometheus too. It can operate natively in Kubernetes, where it has its own server to store and visualize metric data exposed by the previously mentioned Sensu agent.

    Related tools and technologies: Prometheus.

    Figure 4: Events in Sensu. Source: becon.

    Sysdig Inspect

    Sysdig has two open source products: Sysdig Inspect and Falco. Here, we’ll focus on Inspect, which monitors and captures the container processes running in your system and allows you to drill into those processes for post-incident forensics. This enables you to analyze your application performance, troubleshoot errors and monitor any processors that could be misbehaving. Furthermore, if your system is breached, Sysdig allows you to understand how the breach occurred and what data was taken in the process. Sysdig Inspect is a very powerful tool that focuses on the performance tuning and security investigation of your system. 

    Related tools and technologies: Grafana, Sysdig, Sysdig Falco.

    Figure 5: Sysdig Inspect Overview. Source: Sysdig.

    Jaeger

    Jaeger is an end-to-end distributed tracing solution that was open sourced by Uber Engineering. It allows you to monitor and troubleshoot transactions in complex distributed systems. In modern microservice architectures, the majority of operational problems fall under the umbrellas of networking and observability. When a service failure occurs, you have no idea how the requests have gone from service to service over the network to complete a single business transaction. This makes debugging extremely difficult. Currently incubating under CNCF, Jaeger uses tracing to enable root cause analysis, performance and latency optimization, and distributed transaction monitoring. Jaeger works out of the box with Istio, a popular service mesh implementation open sourced by Google. 

    Related tools and technologies: Prometheus, Jaeger, Zipkin, Istio.

    Figure 6: Jaeger Find Traces. Source: Jaeger.

    Conclusion

    These tools are widely used in the tech industry, and they all have their benefits. Most of these solutions, however, require skilled implementation and ongoing manual maintenance that can be a burden for DevOps teams and a distraction from the business. There’s no one solution that can cater to all of your requirements, since each tool focuses on one or two specific aspects of observability and analysis. By mixing these tools together, you can derive a unique solution for your individual business needs. 

    For ease of comparison, the chart below outlines the features offered by each of the tools discussed in this article.

    — Ran Ribenzaft

  • Survey Sees Cloud Foundry Momentum Gains

    Survey Sees Cloud Foundry Momentum Gains

    At a time when many organizations are wondering to what degree they should rely on legacy application development and deployment platform versus emerging container-based platforms, the Cloud Foundry Foundation (CFF) today released the results of a survey that shows reliance on the organization’s namesake open source platform-as-a-service (PaaS) environment continues to grow.

    Announced at the European Cloud Foundry Summit, the annual survey of 306 IT professionals finds 45% of respondents describe their use of the PaaS as “broad,” compared to 30% a year ago. The same survey finds nearly 20% started using Cloud Foundry in just the last 12 months and 39% of developers are deploying applications now in less than one day. More than three-quarters (77%) report application development cycles of fewer than three weeks.

    Nearly half of survey respondents report they have at least 100 developers using the PaaS, a significant jump from just one-third last year, and the share of companies with more than 50 applications on Cloud Foundry grew to 43% in 2019.
    The future of the PaaS has been called into question ever since the rise of Docker containers and Kubernetes. The CFF has been slow to adopt Kubernetes as a more efficient foundation for deploying a PaaS environment. Most recently, the CFF has provided organizations that adopt the PaaS the option of replacing the Diego container orchestration engine developed by the CFF with Kubernetes. At the same time, the CFF is working toward replacing much of the foundation layer for Cloud Foundry with Kubernetes to provide a more efficient means of standing up a Cloud Foundry environment.

    The CFF has also made it possible to deploy applications built on Cloud Foundry on a Kubernetes runtime. CFF CTO Chip Childers says that no one should be surprised when the rise of Kubernetes leads to more adoption of Cloud Foundry. Most of the application development environment available for Kubernetes today are not as robust as the Cloud Foundry PaaS, with the notable exception of the Red Hat OpenShift PaaS. Following the acquisition of Red Hat, IBM is now promoting Red Hat OpenShift as the cornerstone of a hybrid cloud strategy that has Kubernetes at its core. Meanwhile, last month Pivotal Software, provider of a curated instance of a Cloud Foundry PaaS, told financial analysts it expected to see a $40 million to $50 million decline in revenue in fiscal 2020. Shortly after, VMware moved to acquire Pivotal, which, like VMware, is a unit of Dell Technologies.

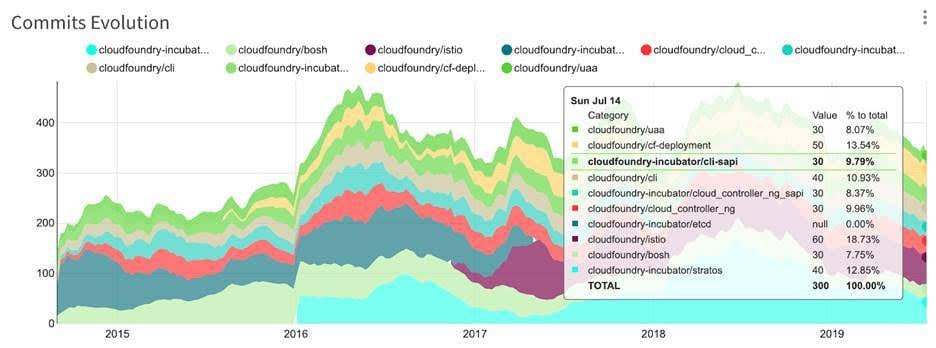
    An update to a previous report published today by source{d} shows there are now 879 repositories in the Cloud Foundry GitHub organization, with the total number of commits reaching approximately 50,000 per month. The report finds the highest levels of activity are centered around the Stratos UI project, Istio integrations and the core Cloud Foundry Application Runtime Cloud Controller.

    The CFF and Kubernetes, under the auspices the Cloud Native Computing Foundation (CNCF), fall under two separate arms of The Linux Foundation. It’s unclear if the Linux Foundation might one day merge these two arms or continue to keep them separate as a means of navigating conflicting vendor strategies. Whatever the outcome, Cloud Foundry is likely to remain a vibrant part of the open source community for many years to come.

    — Mike Vizard

  • Reducing Risk in Applications Using Docker Containers

    Reducing Risk in Applications Using Docker Containers

    Docker. It seems like in this day and age you are either using Docker containers or you are going to use Docker containers. If you haven’t jumped on the bandwagon yet, check out a previous article, “Docker: The New Ordinary.” If you are on the wagon or are thinking about it but have concerns about their security, it’s time to read on.

    José Manuel Ortega (jmortega.github.io ) is a software engineer and security researcher in Spain. I recently watched his presentation online titled, “Testing Docker Images Security.” He gave an overview of typical Docker deployments, explained the attack surface and threats, presented how to detect vulnerabilities and outlined a couple of best practices. In short, his advice will help you learn how to better secure your Docker containers.

    (New to Docker? Read this paragraph; all others skip ahead.)  If you aren’t sure what Docker is, José offered this explanation: “Docker containers wrap a piece of software in a complete file system that contains everything it needs to run: code, runtime, system tools, system libraries—anything you can install on a server, regardless of the environment it is running in.”

    That is, containers are isolated but share an operating system and, where appropriate, binaries and libraries. Docker provides an additional layer of isolation, making your infrastructure safer by default. This makes the application life cycle faster and easier to configure, reducing risks in your applications.

    For starters, José laid out Docker’s default mechanisms for security:

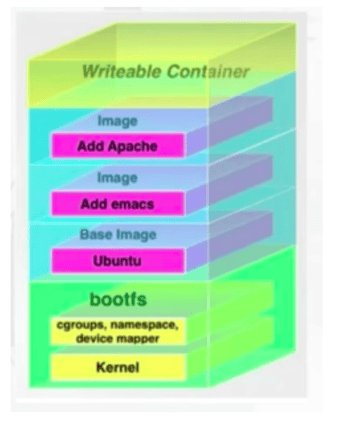
    • Linux kernel namespaces
    • Linux Control Groups (cgroups)
    • The Docker daemon
    • Linux capabilities (libcap)
    • Linux security mechanisms like AppArmor or SELinux


    Screen Shot 2018-04-08 at 7.17.58 AM

    José walked through others tools, add-ons, best practices, etc., to increase Docker container security. I will cover most of them here.

    Docker Inspect Tool. The Docker Inspect Tool is built into Docker. It provides information about the host name, the ID of the image, etc. and it comes up when you start Docker.

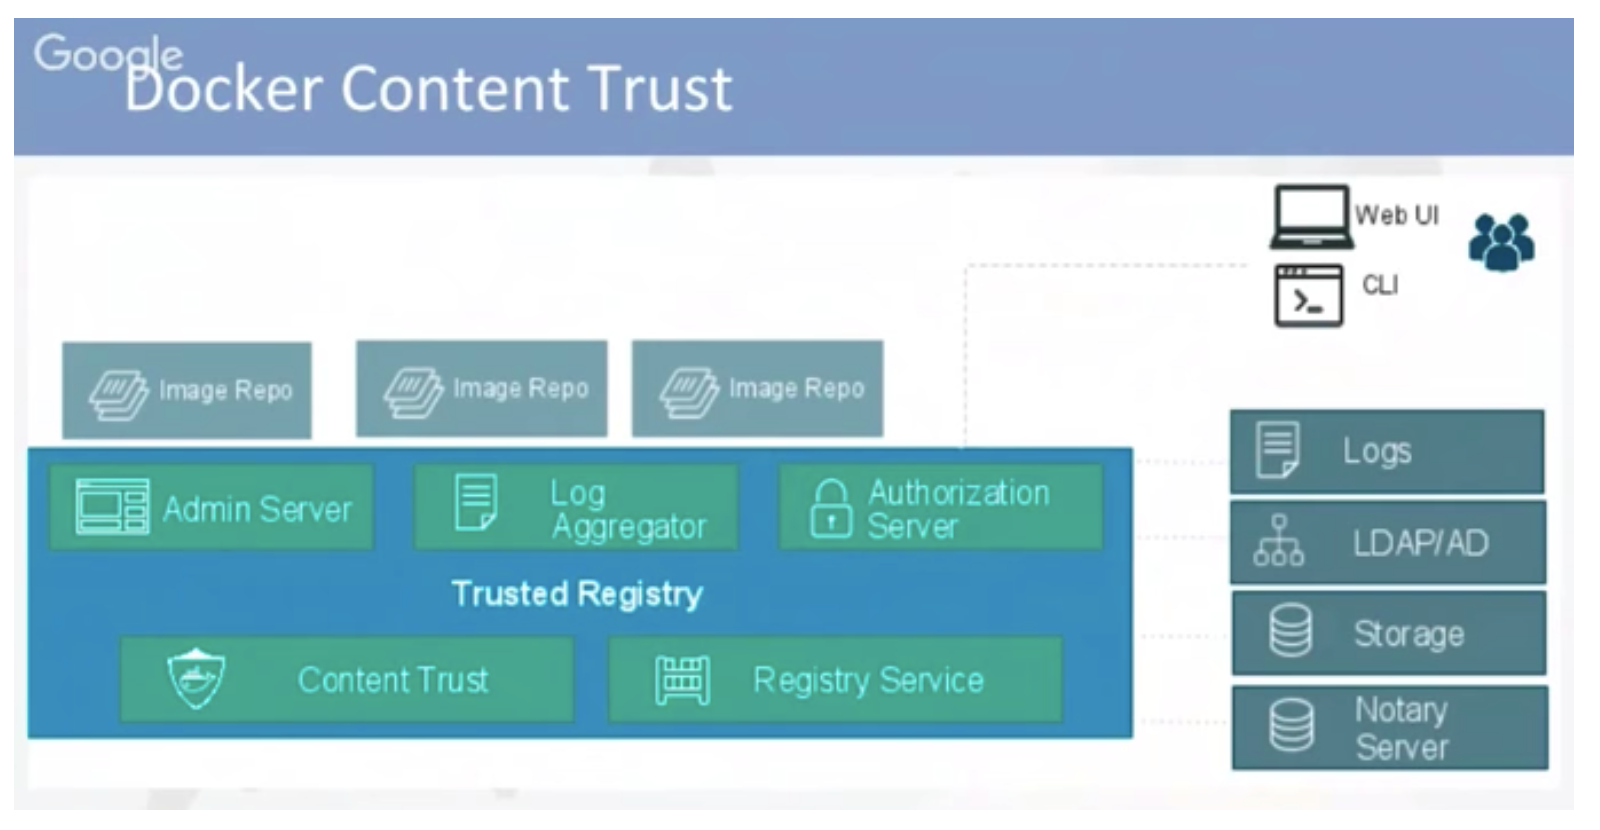
    Docker Content Trust. It protects against untrusted images. It can enable signing checks on every managed host, guarantee integrity of your images when pulled and provide trust from publisher to consumer.

    Screen Shot 2018-04-08 at 7.19.01 AM

    Docker File Security. Docker files build Docker containers. They should not write secrets, such as users and passwords. You should remove unnecessary setuid and setgid permissions, download packages securely using GPG and certificates, and try to restrict an image or container to one service.

    Container Security. Docker security is about limiting and controlling the attack surface on the kernel. Don’t run your applications as root in containers, and create specific users for testing and policing the Docker image. Run filesystems as read-only so attackers can not overwrite data or save malicious scripts to the image.

    José provided a useful checklist to check the security of a Docker container, but it’s not a short one. Remember, if you are going to deploy hundreds or thousands of these containers, you’ll want to ensure consistent handling of security concerns to keep the hackers at bay:

      • Do not write secrets to Docker files
      • Create a user
      • Follow version pinning for base images, packages, etc.
      • Remove unnecessary setuid, setgid permissions
      • Do not write any kind of update instructions alone in a Docker file
      • Download packages securely
      • Do not download unnecessary packages
      • Use COPY instead of ADD
      • Use the HEALTHCHECK command
      • Use gosu instead of sudo whenever possible
      • Use no-cache (if applicable) when building
      • Enable Docker Content Trust
      • Ensure images are free from known vulnerabilities
      • Ensure images are scanned frequently throughout your DevOps pipeline
      • Ensure your images, packages are up to date
      • Use file monitoring solutions for image layers (if required)

    Auditing Docker Images. You can scan your images for known vulnerabilities with a wide variety of commercial and open source tools such as:


    All of these solutions can be integrated in one element of your CI/CD pipelines — some can be integrated in multiple places.

    José explored these solutions and best practices in more detail and offered up technical implementation tips in his full talk, available for free here. If you are working on or interested in Docker security, his talk is worth your time.

    Thirsty for more DevOps discussions led by practitioners (not vendors)?  You too can binge watch 99 other talks from the All Day DevOps conference here.

    — Derek E. Weeks