Tag: debugging

  • AWS Brings Machine Learning to Code Optimization

    AWS Brings Machine Learning to Code Optimization

    Amazon Web Services (AWS) has made generally available a tool dubbed Amazon CodeGuru that employs machine learning algorithms to recommend ways to improve code quality and identify which lines of code are the most expensive to run on its cloud service.

    Peder Ulander, director of open source for AWS, said Amazon CodeGuru not only helps improve performance and resource utilization but also reduces the time and effort spent optimizing applications before and after they are deployed.

    Amazon CodeGuru is based on a set of AWS machine learning algorithms to identify best practices for deploying code. It creates a profile of the code deployed and then surfaces recommendations to improve performance and reduce costs by employing the most appropriate tier of the cloud service.

    That latter capability is critical because developers don’t always factor costs into deciding which tier of a cloud service to employ. Amazon CodeGuru enables IT teams to proactively optimize their cloud usage, noted Ulander.

    Amazon CodeGuru can pull code from either GitHub or CodeCommit repositories, with support for other repositories planned. It requires developers to insert agent software developed by AWS into their code. Once a pull request is made, Amazon CodeGuru automatically starts evaluating the code using trained artificial intelligence (AI) models developed using data gathered from thousands of different open source software projects by AWS and its parent company.

    Once the analysis is completed, Amazon CodeGuru will generate a graph showing such metrics as latency issues and CPU utilization rates, as well as human-readable recommendations to surface specific issues and remediations that include example code and links to relevant documentation for any line of code. Amazon CodeGuru can observe application runtimes and profile application code every five minutes.

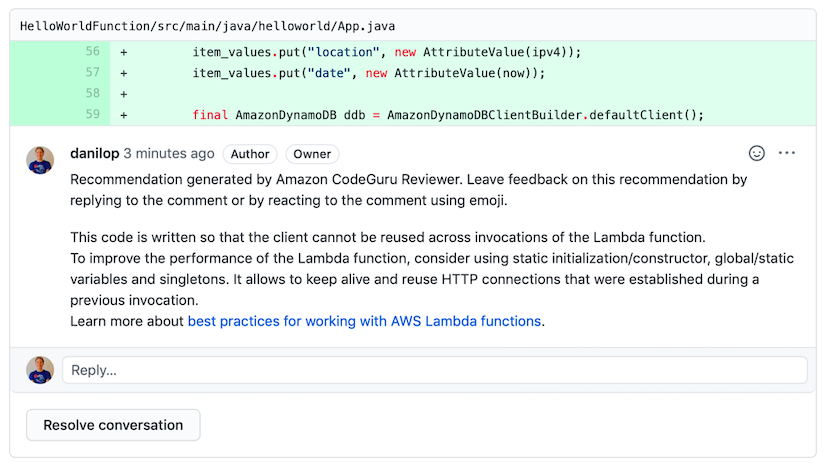
    Amazon CodeGuru has two core components. Amazon CodeGuru Reviewer automatically flags common issues that deviate from best practices and provides recommendations to fix them, including example code and links to relevant documentation. It then opens a pull request and automatically starts evaluating the code using machine learning models to identify the line of code, specific issue and recommended remediation, and provides access to a pull request dashboard that lists all the information gathered by all code reviews.

    IT teams can provide feedback on CodeGuru Reviewer recommendations by clicking on a thumbs up or thumbs down icon, which helps improve recommendations over time using machine learning.

    The second component is Amazon CodeGuru Profiler, which identifies the most expensive lines of code by analyzing the runtime behavior of their applications. Armed with those insights, IT teams can identify and remove code inefficiencies, improve performance and decrease compute costs.

    IT teams today spend an inordinate amount of time debugging code to address a broad range of issues. The paradox is the more applications they deploy, the more time they spend debugging. Perhaps the time has come to finally let machines discover code issues in the hopes that developers will use their time writing new code, not fixing it.

  • Rookout Extends Reach of Debugging Platform to On-Prem

    Rookout Extends Reach of Debugging Platform to On-Prem

    Rookout, a provider of a software-as-a-service (SaaS) platform designed to simplify the debugging of applications, has extended the reach of its tools into on-premises IT environments.

    Company CTO Liran Haimovitch said its new Data On-Prem capability extends the reach of a bytecode manipulation capability developed by Rookout to insert a snapshot capture of a specific line of code to an on-premises IT environment. This eliminates the need for DevOps teams to upload code and associated data to the Rookout platform manually.

    The Data On-Prem capability is made available via a software development kit (SDK) provided by Rookout, he said.

    Legacy approaches to debugging code are essentially broken because the processes employed to fix code are too cumbersome, said Haimovitch. Rookout is designed to collect full-stack data without requiring code to stop running or impact code execution. That approach allows developers to debug live code on the Rookout platform and then reinsert the code into their applications.

    Haimovitch said Rookout is making a case for transforming how application debugging is addressed within a DevOps process. Rather than relying on tools that need to be tightly integrated and maintained within a continuous integration/continuous deployment (CI/CD) pipeline, it will be easier for developers to debug live code on the Rookout platform, said Haimovitch.

    That approach will enable DevOps teams to go well beyond simple observability to embrace true understandability of how applications work down to individual lines of code, he added.

    Debugging applications has always been problematic. In an ideal world, developers would have a much better handle on what bugs need to be fixed earlier rather than later. By making it easier to debug live code, the number of issues that developers could address before an application is deployed in a production environment should increase. It may never be possible to address every issue before an application is deployed; however, the number of critical issues theoretically should decline. Many code issues go unaddressed simply because the effort required to debug that code is too great. Many developers too often put off fixing those issues until the next update usually because they are rushing to meet a delivery deadline.

    At the very least, developers should repeat the same mistakes less often as they work to debug live code.

    Regardless of how the debugging issue is addressed, issues within code in the age of microservices are starting to have a bigger impact. An issue within a line of code in a single microservice can have a cascading impact on all other elements of an application that depend on that microservice.

    Debugging application code is never going to be enjoyable. The challenge is finding a way to make the entire process less painful. There may come a day soon when machine and deep learning algorithms help automate much of the debugging process. In the meantime, DevOps teams might want to re-evaluate existing approaches to debugging code that clearly leave much to be desired.

  • Report: Debugging Efforts Cost Companies $61B Annually

    Report: Debugging Efforts Cost Companies $61B Annually

    Undo, a provider of a software failure replay platform, this week published a report in collaboration with a Cambridge Judge Business School MBA project that estimates 620 million developer hours a year are wasted on debugging software failures, at a cost of roughly $61 billion.

    The report also notes software engineers spend on average of 13 hours to fix a single software failure.

    According to the report, 41% said identified reproducing a bug as the biggest barrier to finding and fixing bugs faster, followed by wiring tests (23%) and actually fixing the bug (23%). Well over half (56%) said they could release software one to two days faster if reproducing failures were not an issue. Just over a quarter of developer time (26%) is spent reproducing and fixing failing tests.

    On the plus side, 88% of respondents said their organizations have adopted continuous integration (CI) practices, with more than 50% of businesses reporting they can deploy new code changes and updates at least daily. Over a third (35%) said they can make hourly deployments.

    Undo CEO Barry Morris said the report makes it clear organizations need to be able to record software to reduce the amount of time it takes to find bugs. Unfortunately, even then finding a bug is still a labor-intensive process that can involve analyzing millions of lines of code. In the future, software replay systems will be infused with machine learning algorithms to accelerate the bug discovery process, he noted. As software becomes more instrumented, the observability data and metrics that machine learning algorithms require to detect patterns is becoming more accessible.

    In the meantime, while CI has been embraced, the continuous delivery (CD) side of the DevOps equation remains a challenge. Each platform software is deployed on is unique, so most organizations find automating software delivery problematic.

    Regardless of DevOps approach, it’s clear there’s still lots of room for improvement when it comes to developing software. Even the most advanced practitioners of DevOps are limited by the rate at which software bugs, including security flaws, can be discovered and remediated. Of course, there may come a day when machine learning algorithms automate much of that process, including determining which types of tests to run. For now, however, many organizations could streamline the software debugging process by recording instances of applications when they are built and when they are deployed. After all, each platform that software is deployed on has attributes that inevitably impact how software on the platform runs.

    As software continues to become more complex in the years ahead, challenges associated with debugging applications will only continue to grow. In the age of microservices, the issue that software engineers are trying to troubleshoot might not have anything to do with the code they wrote; rather, the issue emanates from a service they invoked via an application programming interface (API). Whatever the source of the problem, it’s apparent to all a lot of time and money is being wasted on debugging software that could be put to far better use.

  • DevOps Chats: Debugging Spinnaker Apps, With Salesforce

    DevOps Chats: Debugging Spinnaker Apps, With Salesforce

    Spinnaker Summit 2019 Preview: Debugging production issues in any environment can be challenging, and Spinnaker has its production learning curve. Problems aren’t always replicable in a smaller environment, and debug messages can be verbose and confusing to triage what’s happening.

    Our DevOps Chat guest Chuck Lane, Salesforce lead software engineer, is giving a talk on “Debugging and Profiling Spinnaker Applications Live” at the Spinnaker Summit 2019. In Chuck’s talk, you’ll learn skills like remote JVM debugging, custom profiling builds and the magic of figuring out what’s going on with a multithreaded microservice using htop.

    Chuck’s talk is on Saturday, Nov. 16, at 3:40 PM PT. Spinnaker Summit 2019 is Nov. 15-19 in San Diego.

    As usual, the streaming audio is immediately below, followed by the transcript of our conversation.

    Transcript

    Mitch Ashley: Hi, everyone. This is Mitch Ashley with devopsy.kinsta.cloud and you’re listening to another DevOps Chat podcast. Today, I’m joined by Chuck Lane. He’s a lead software engineer with Salesforce.com. He works on Sales Cloud, which is the Salesforce you and I use, know and love, or our CRM capabilities. Chuck is talking at the Spinnaker Summit 2019 in San Diego, and his talk is about debugging and profiling Spinnaker applications live. And I think live means, like, live while they’re running, in production, and see what’s going on. We’ll explore what that is. This talk is on Saturday, November 16th, at 3:45 p.m. in San Diego. Chuck, welcome to DevOps Chat.

    Chuck Lane: Thank you. It’s nice to be here.

    Ashley: Excellent. Awesome to have you here. Would you start by just introducing yourself? Tell us a little about you and what you do at Salesforce.

    Lane: Yeah. So, my name is Chuck Lane. I am, as you mentioned, a lead software engineer. And basically, my chief responsibility at Salesforce is to help bring Salesforce into using Spinnaker for our public cloud based deployments. So, as we make a transition to try to move away from first party architecture and move over into the public cloud, one of the technologies that we’re using to do that is Spinnaker and I’ve established myself as a subject matter expert in Spinnaker. And so, I kinda help to bridge the gap between the traditional development and deployment cycle and what that looks like using Spinnaker in a containerized world.

    Ashley: Okay, great. You used a term there I don’t know if I’m familiar with. You mentioned something about moving from first party architecture to the public cloud. What’s that mean about the environment you’ve been in that you’re, and what you’re moving to?

    Lane: Yeah. So, basically, what I mean there is that, historically, Salesforce has owned their own data centers, and we’ve deployed to those data centers. We are moving, embracing in a big way public cloud architecture, whether that’s through AWS, whether that’s through GCP, or any of the number, any other number of cloud offerings.

    And so, as opposed to doing what some people would call a lift and shift where you just take your software that’s meant for, to be run on hardware that you own and move it into the cloud, we’re doing a fundamental re-architecture of the software to make use of all of the great things that cloud architecture allows us to take advantage of.

    Ashley: Mm-hmm. Fantastic. That’s interesting to hear a little bit about your own evolution at Salesforce. So, your talk is about using Spinnaker, you know, really about debugging and finding out problems that are happening in production, but sometimes you might struggle with trying to replicate it into a smaller environment to get the same problems working.

    Can you tell us a little bit about what sort of led you down this path to figure out how to do this? Was it a big problem that was happening or something you saw repeated over and over that there wasn’t a good solution to and you figured out how to do that? How did this come about?

    Lane: Yes. So, basically, as you’re taking workloads and migrating them over, I mean, when—you know, when you just start with a small subset of workloads, you know, the path is relatively straightforward. And, you know—hopefully, anyways—and you don’t run into too many issues that can’t kind of easily be solved.

    But the reality is, as you transfer more and more workloads over to the public cloud, that’s—you know, the devil’s in the details, right? So, that’s really where things can pop up where you’re hitting various limits or software isn’t performing in the way that you would expect it to perform. And these are the situations where we—where it can be very beneficial to jump into production software and really, you know, sometimes slap a debugger on it and see exactly what it is that it’s doing that differs from kinda what you expect. You know, and that can help you kinda tailor your workloads in such a way that you can make things run more smoothly.

    Ashley: Mm-hmm. I know sometimes using debuggers, enabling them—that can be helpful, but it also can be too much information, trying to sort through what all is happening, trying to find what should you be looking at. What are some of the challenges you’ve found by turning on debugging or using debuggers?

    Lane: Yeah. Well, so, I mean, there definitely is that problem that you’re saying just as far as too much information that’s coming out. One of the nice things about Spinnaker and the way the services are written is, you have a very fine grained tuning over which libraries inside of Spinnaker you tell it to print out and debug information.

    Ashley: Mm-hmm.

    Lane: So, if we know that there is a hiccup with one of the data binding layers or a hiccup with one of the authorization layers, then we can, through the config files, we can—and Java settings—we can really target that explicit directory, or I’m sorry, that explicit library and say, “Give me all the debug information that you have.”

    Ashley: Mm-hmm.

    Lane: But, you know, failing that, I mean, there are definitely times when it’s been advantageous and the best course of action is just to go down and actually look at the code and see what it’s doing. And, again there, it’s best to do that under—you can’t do it in production, usually, but what we can do is simulate a load that’s similar to what we would see in production and really, really take a look at what’s going on to help us identify those algorithms that might be o event squared instead of a login or something like that.

    Ashley: Mm-hmm. Now, are there some specific techniques—I know in your description of your talk, when you talked about using remote JVM debugging, custom profile builds, even using htop, you know, a UNIX command or a LINUX command to help you figure out what’s happening with multi-threaded microservices. It sounds like a variety of different approaches that you’ve kind uncovered and learned that you can use to figure out what’s happening.

    Lane: Yeah. And so, I mean, in general, we like to run as closely to the open source build as we can, the ones that are provided by Spinnaker, which is ultimately provided by Google. But there definitely are circumstances where we need an extra tool, be it htop, be it something like Glowroot, which is a Java application profiler where what we’ll do, then, is we’ll go in and we’ll build a custom image using the Spinnaker images as a base and then tack on those additional libraries and put them into the Spinnaker ecosystem and then launch them up just to see what additional information we can get out of there.

    And so, you know, one scenario where that was really useful to us, we ran into a scenario where cloud driver, which is—cloud driver is the main tool that talks back and forth to all of our different cloud infrastructures.

    Ashley: Mm-hmm, mm-hmm.

    Lane: Sometimes calls to cloud driver were taking upwards of, well, two to three minutes to respond. Now, you know, timeouts are set in such a way that if it doesn’t hear anything back in about 30 or 60 seconds, then it just disregards that load and, you know, so that created quite a bit of problems for us.

    By building a custom cloud driver image that had htop in it, we were able to see that the majority of the processes that were running were actually running basically commands to reach out to the Kubernetes clusters and get a list of all of the name spaces that are in the Kubernetes cluster. And, talking it over with some of the Spinnaker developers, what we found is that if you have 15 or so clusters that you’re connecting to Spinnaker, then that’s not so much of a problem to go and query each of those to get the list of name spaces. But as you scale up, on the order of 400 or 500 different clusters the way that we do, then a lot of the delays and a lot of your time can be just essentially Kubectl calls waiting to return to you the lists of name spaces that you need to go and scan.

    So, we implemented a workflow based solution for that, basically, where we let our teams know that when they’re creating their clusters, they should use Terraform to go ahead and create the clusters—I’m sorry, the name spaces that they’ll be using. And then, if they need to use a name space after the fact, then we provide a pipeline that they can use that will dynamically add in an additional name space that their cluster will start to scan. So, that saves us from scanning all the clusters all the time, which was causing quite a bit of performance bottlenecks.

    Ashley: Yeah, I would imagine that would have some overhead, maybe a lot of overhead if you’re doing that frequently. So, it sounds like a way to both reduce overhead, but also to get the information faster.

    Lane: Exactly, exactly—yep, yep.

    Ashley: Mm-hmm. Very cool. So, in your talk, are you going to be doing any demos? I know there’s always the demo Gremlin, or are you gonna be just showing, you know, talking about what some of these techniques are?

    Lane: So, I plan on doing some demos. As far as—

    Ashley: That’s really cool.

    Lane: Yeah. You know, I may do the, what’s the—the Easy Bake Oven a little bit as far as, “Here’s the behavior and here’s what we’ve found in code.” But from what I understand, a lot of that stuff can kinda be dependent on Internet connectivity at the actual site. So, if it’s something where we have good Internet connectivity, then by all means, I plan on walking through a couple of debugging scenarios, as close to what we would do in real time as possible.

    Ashley: Yep. Well, you know, someone somewhere—it’s been a while ago—gave me the great advice of, you know, “Have your live demo and have your disconnected demo ready in the background.” [Laughter] So, you can always at least show something locally if you can’t get on the net. So, if you’re depending upon the network—I’m not sure if you are for your demo, but always a good lesson, right?

    Lane: Sure, exactly.

    Ashley: Great. Are there any other kind of lessons learned, common mistakes, or mistakes that you or others might have made along the way, kinda so there’s hard things you learned by trial and error that you plan on sharing?

    Lane: I mean, well, there are—whew. You know, I’ve been working on Spinnaker for a couple of years. So, there’s definitely been a lot of hard lessons learned, here. But honestly, what I would do is, I would encourage anybody who wants to get into Spinnaker to not just hang around the Slack channel, because the Slack channel does have a tendency to get overrun with, you know, just kinda people posting their stack traces and just saying, “Hey, has anybody ever seen this before?”

    And, you know, I’ve gotten a lot more success by going through the commits, looking at the people who actually authored the code, and then reaching out to them directly with more than, “Hey, can you explain this to me?” but rather, you know, “Hey, I see what you did here and I see what you did here. I’m running into problems with these lines. Do you have a different approach, or is there something that I can be doing differently?”

    And the other thing that I just can’t overstate is the value of being a member of one of the special interest groups.

    Ashley: Hmm, interesting.

    Lane: So—yeah. So, I’m a member of the Kubernetes V2 special interest group that’s lead by Eric Semene and Ethan Rogers from Armory, Eric’s from Google. And it has, you know, it has been just an absolute wealth of information and, you know, honestly, I don’t know if we ever would’ve gotten nearly as far as we had without those two people.

    So, you know, yeah, I would just say that the community is really friendly and we always welcome new members who are ready to learn.

    Ashley: You know, I think both of those are great suggestions, and I really appreciate that you made those. Because, one, things like the Slack channels on projects, open source, those can be a bit intimidating. Sometimes they’re not approachable, because there’s just so much noise so much happening on it and people reaching out for help like you’ve talked about, “Here’s a stack trace I’m trying to figure out.”

    But also, your recommendation of reaching out to the code authors, you know what, it’s—people like to help each other. And, you know, it might seem like, “Hey, the people who wrote this aren’t gonna have time to bother with me”—they love to hear from people that are using their stuff to talk about it and help them out, but also hear about how they’re using it, and of course, they’re always looking for ideas and feedback and stuff like that. It sounds like you’ve had that kind of an experience.

    Lane: Yeah, absolutely. I mean, and you know, the big thing is just, you know, as a coder, it’s easy to tell the people who are coming to you and just kinda wanting you to fix it for them and the people that are coming to you that have really tried to tackle it themselves. And, you know, I can’t speak highly enough about the latter rather than the former. I mean, you know, just give it your best shot and when you get stuck, reach out to somebody and it’s, you know, it can be immensely valuable.

    Ashley: It’s kinda like going to a foreign country. Wherever you are, if you’re American going somewhere else or vice versa, everybody appreciates you trying to speak the native language, and at some point, when they see you struggle enough and how far you can go, they’re glad to help you and, you know, speak in your language.

    So, same kind of thing with helping people with code. If you’re gonna just fob your problem off onto the developer of it—not appreciated so much. But they appreciate that you tried to take it as far as you could. As you mentioned, go look at the code and figure out what’s going on.

    Lane: Yeah.

    Ashley: You’ll get immense respect, you know, even if you aren’t a coder at that level, at that level of software developer, it’ll mean a lot to the developers.

    Lane: Absolutely, absolutely.

    Ashley: Well, hey, I think you’re gonna have a fascinating talk, and I love that, you know, this idea of trying to figure out what’s happening in production and some of the techniques that you’ve come up with and developed and have experienced and the fact that you’re sharing those with others. I’m curious, do you contribute any code to the Spinnaker project in any areas? Are you primarily a practitioner user of it?

    Lane: So, I have. I’ve got a few small RPRs that have been pushed through, but really, the bulk of my commits right now have actually been to the Spinnaker website, the documentation. So, you know, I don’t know Java or Groovy or Kotlin, maybe, as well. Some of the patterns they use are a little bit—I come from a .net world, so they’re a little bit foreign to me.

    But yeah, I’ve definitely written a number of different documentation pages and I found that that’s a great way to kinda get in and I’ve even got some PRs that are coming ups soon that aren’t doc related. So, yeah, hopefully, you’ll see my name more.

    Ashley: Excellent. Well, you know what, documentation is important, too. There’s some folks doing talks at Spinnaker Summit that, you know, kinda ran into that point where, “Hey, there’s documentation for doing it one way, but not under this set of configurations or software.” So, that’s a contribution, too, so congratulations for being a part of the community and for sharing, also, your experience at the Summit.

    So, Chuck, appreciate you being on the podcast today.

    Lane: Oh, thank you. It’s been an absolute privilege. Thank you so much.

    Ashley: Absolutely. Fantastic. I wish you all the best with your talk, I’m sure it’ll be great, and hopefully folks listening to this podcast will draw some more interest and bring folks to listen to you.

    So, I’d like to thank our guest today, Chuck Lane. He’s lead software engineer at Salesforce.com, so you can imagine the environment he’s working in. There’s some super good lessons that Chuck’s bringing to the table. He’s gonna be talking at Spinnaker Summit 2019, which is in San Diego, November 15th through the 19th. His talk is debugging and profiling Spinnaker applications live, and his talk is on Saturday, November 16th at 3:45 p.m.

    I’d also to thank you—you, our listeners—for joining us today. This is Mitch Ashley with devopsy.kinsta.cloud. Have a great day and be careful out there.

    — Mitchell Ashley

  • Containers as Disposable Servers?

    Containers as Disposable Servers?

    There is a belief in the space where containers meet DevOps that a service hosted in a container crashing is no big deal, and you can just spin up a new one. It’s not a pervasive belief, but it is common enough that we’ve all heard/read it somewhere.

    I think this view of the world is, at best, incomplete. There are easily verifiable cases where it just isn’t reality. A good example is the Cloudbleed bug, where ignoring errors and spinning up a new instance to meet load demands was one of many things that combined to make a sensational (if low-risk) failure.

    Another good example is shopping carts and payment systems. All the small-business owners I know would balk at a shopping cart of payment processing system that could crash mid-transaction, and the provider shrug and say, “We spun up another instance; have the customer try again.”

    Are there scenarios where crashing containers simply being replaced might be acceptable? I would argue no. They’re software errors. The world has not changed; errors are still bad. I can invent “but if you …” scenarios as well as the next person, but the fact is, if your software is crashing—be it container, VM, hardware, firmware or whatever—you did something wrong and you can’t know the extent of the issues the crashing creates without digging into the problem. At which point, you may as well fix it.

    I’ve written my share of bugs, like any developer. And I’ve fixed my share of bugs, like any developer. Ignoring them is a recipe for disaster, when a seemingly benign bug is suddenly exposed to have major issues.

    Schedule time to fix issues. Rushing forward with new features and products is cool, but keeping the customer base happy and safe is far cooler when revenue time comes. If containers and DevOps are saving you the time they’re supposed to be, you have a little extra time to get in there and fix issues, so use it productively.

    — Don Macvittie

  • Getting the Most Out of QA in Complex Environments

    Getting the Most Out of QA in Complex Environments

    We live in a world in which software is increasingly dominant. Not only do we rely ever more on software, but its complexity is becoming even greater. And with increased complexity, bugs are more likely to be intermittent, making failures difficult to reproduce. Sometimes this non-determinism results in failures never getting fixed. Any unfixed bug is potentially a security breach or catastrophic customer outage waiting to happen. With such risks on the line, ensuring your software is of the highest quality is essential to running a successful operation.

    To cope with this complexity while still providing some assurance of delivered software quality, the DevOps industry has embraced a variety of automated testing regimes. A development team of a given size is able to run many more tests than it could before and must triage, and attempt to resolve, a correspondingly larger number of test failures. Diagnosing the cause of each test failure can still take a lot of time, particularly if the problem is intermittent or otherwise not easily reproducible. In fact, developers can spend on average as much as 50 percent of their programming time debugging, not coding. Think of all the innovation that could occur if that time were reallocated.

    Traditional QA

    When it comes to Quality Assurance (QA), developers and testers are all aware of the sequence of deliverables, beginning with development delivering an untested product to QA, which releases the tested and approved product to the end user. However, when a bug is found, QA and Development must communicate with one another to solve the issue quickly. The effectiveness of the delivery channel between QA and Development hinges on the quality of the information about the failure.

    Some common challenges raised by inefficient QA processes include:

    • Complex control flow – Difficult to make inferences about how a failure unfolded
    • Non-deterministic failures – Hard to reliably reproduce a failure to investigate the root cause
    • International R&D – Collaboration is made more difficult by geographic separation

    Conventional test systems inform that there is a bug but offer limited information about the cause. Workflows such as continuous integration (CI) often offer clues, such as informing which commit to the codebase caused the failure. However, there are several cases where CI cannot directly help identify problematic code changes. For example, the triggering code change may be entirely correct, yet cause a pre-existing bug to manifest. The developer cannot simply stare at the modification in the expectation that the source of the bug will eventually appear. Conversely, the failure may not easily reproduce for the developers even if they run the same test again. In short, CI is often very good at making the easier bugs very easy to fix, but typically is of little help with the more difficult bugs, particularly intermittent ones.

    The Next Evolution of QA

    To bridge the gap between identifying a failure in the QA process and resolution by development, DevOps teams have adopted a variety of technologies to complement their automated testing setups. New to this scene is technology capable of recording all or part of a program’s execution for subsequent replay and analysis, capturing test failures as they happen. The recording contains all the information a developer needs to understand the exact set of conditions that led to the test failure. It can be analyzed on different machines to the one on which the failure occurred, facilitating collaboration between colleagues who can work on separate machines to resolve the same issue—a particularly useful benefit for large software companies with geographically distributed teams. By gaining the ability to debug an exact replica of the failure, developers immediately reduce the time and effort required to diagnose and fix failures, therefore speeding the development cycle.

    Being able to generate recordings of failed tests, especially those intermittent issues which might not otherwise get fixed, coupled with the productivity gains of increased collaboration between development and QA allows companies to maintain a competitive advantage in a volatile marketplace.

    About the Author / Greg Law

    Greg is the co-founder and CEO of Undo. Greg has 20 years’ experience in the software industry and has held development and management roles at companies including the pioneering British computer firm Acorn, as well as fast-growing startups, NexWave and Solarflare. Greg left Solarflare in 2012 to lead Undo as CEO and has overseen the company as it transitioned from the shed in his back garden to a scalable award-winning business. Greg holds a PhD from City University, London, that was nominated for the 2001 British Computer Society Distinguished Dissertation Award. He lives in Cambridge, UK with his wife and two children.

  • How Developers Can Spend More Time Coding, Less Time Fixing

    How Developers Can Spend More Time Coding, Less Time Fixing

    I don’t think anyone became a developer because they loved to spend their time debugging. As frustrating as it may be, making sure your build works is critical—and this burden is now falling on developers. If your organization wants to deliver highly rated apps faster, building quality into the development cycle is imperative. Even though agile development has become a popular approach, it’s execution has a ways to go.

    A recent trends report in mobile and web development shows 25 percent of time is spent addressing a bug fix backlog. This can slow time-to-market and limit the amount of new features your company can roll out—not ideal when your top priority is to draw in new users and boost engagement to stay competitive. The good news is, the time spent debugging throughout the development cycle can be minimized. How? By shifting QA into the development process, you can spend more time coding and less time fixing.

    Mastering Agility in Practice

    The question for devs today isn’t whether they test, but when and how to do it best. We’ve all heard the vague, top-line answers before: “Adopt Agile development,” or, “Shift left.” The problem is, these terms and strategies can be challenging to execute in practice, especially without proper tools to make it happen.

    When we talk about “shifting left,” there’s still an important balance to be found as to which stage is right for dev teams to test—it can’t be too early, when there is nothing meaningful to test, and it can’t be too late, when the test batch pile is too big. Once your coding and testing processes are harmonized, you can effectively maximize your time and resources and get the job done faster and better.

    For development teams, if testing is done in bulk at the end, identifying the specific point in the build that needs to be corrected is like finding a needle in a haystack. When we shift quality left, defects are found earlier among a much smaller set of changes, and are therefore easier to fix. That’s why continuous integration (CI) calls for building, integrating and testing the system you’re developing upon delivery of even the smallest change.

    By testing continuously, uncertainty is reduced and feedback loops are made smaller, ensuring you’re building in the correct direction. The “shift left” trend is ultimately going to condense the dev cycle by getting quality back into the ingredient list. The earlier we deal with quality issues, the less focus is taken from our primary goal: building valuable, innovative technology.

    Find Tools that Mesh with Your Workflow

    Whether you use Selenium, Appium or Android Studio, new products need to integrate seamlessly into existing developer environments. Having to switch between building tools and testing tools is a big waste of time, and it’s unrealistic to expect a high adoption rate if the product is disrupting, rather than enhancing, your workflow. If you’re expected to shift testing into your development cycle, look for testing tools that seamlessly support the continuous integration of testing.

    Once your testing and building processes is aligned, the testing feedback and analysis becomes a new bottleneck. To minimize inefficiencies and feedback gaps, you need to carefully select tools that will improve visibility into build health, and help avoid batching up issues.

    Empower Developers to Satisfy Users

    At the end of the day, smaller batch sizes are only half the battle. No matter the batch size, quality only can be built in if it includes full test coverage, and if all the defects can be fixed in a way that actually meets user standards of quality.

    With tons of potential end user environments, injecting reality into the development process is crucial if you want to meet the high expectations of today’s consumers. With different phones, operating systems, levels of connectivity and apps running in the background, you never know what your apps will be put through once released. Leveraging stable test environments capable of recreating all potential user conditions throughout the developments cycle will maximize efficiency in development and accelerate the speed of innovation at your organization.

    Through a better delivery pipeline, mobile app and web developers are simply more effective. Once your test process is automated, aligned and maximized, writing better code can become your main focus. By taking a strategic, practical approach to shifting quality left—and giving developers the opportunity to focus on what matters most—you’ll see happier developers, and in turn, more successful businesses.

    About the Author / Paul Bruce

    Paul Bruce is Developer Evangelist at Perfecto, focusing on the value of quality and velocity throughout the software life cycle. He previously worked as an advocate for API development and testing practices and a full stack developer before that. He now writes, speaks, listens and teaches about software delivery patterns in modern enterprises and key industries around the world. Connect with him on LinkedIn and Twitter.

  • What Every Front-End Developer Needs to Know

    What Every Front-End Developer Needs to Know

    One of the hardest things about being a front-end developer is the fact that everybody has very different expectations of what it means to be one. This, along with a technology stack that changes at the speed of light, makes interviewing for a front-end position tricky.

    To help you out, and to give you an idea of our views on the role, we have prepared some points on what we consider to be essential knowledge for a front-end developer.

    Be Able to Solve Problems

    This sounds quite abstract, so let’s talk about what it means. Unlike many other developer positions, a front-end developer wields the power of multiple languages and technologies. Being able to look at a task, split it up into necessary steps and choose the right technologies for the job is an essential skill—some things need just a line of CSS, but implementing them in JavaScript would require a 100K library or vice versa.

    Sometimes you won’t know the perfect tool for the situation at hand, and this is also fine. However, you are still expected to provide a solution. This solution may not be the nicest in terms of code quality or speed, but it needs to work—at least for the cases presented at hand.

    JavaScript

    React and Angular, along with other front-end frameworks, are quite impressive pieces of engineering and it is important to know them well if they are the primary frameworks you are using for the job. That said, knowledge of JavaScript, its core libraries and browser APIs will support you no matter which framework you use. Additionally, JavaScript is a general-purpose programming language, so doing some simple array or tree processing shouldn’t cause you any problems and shouldn’t immediately trigger the reflex to include that nifty 100k library that you would barely use.

    One more thing to pay attention to is the asynchronous but single-threaded nature of JavaScript. You should be comfortable with scheduling pieces of work into the future in various ways and know how to execute some code after those asynchronous calls.

    CSS

    In the world of component-based frameworks and living style guides, you can get away with minimal CSS knowledge most of the time. Yet, when something goes wrong with your layout, or when you need to implement something unique, you need to know how browser layouts work. In short, we want you to understand CSS, but not necessarily keep all the flexbox properties or browser-specific hacks in your head—although it is certainly a plus if you do.

    Know Thy Standards and Keep Up To Date

    Nothing gives you as much appreciation of the complexities involved in making the front end work as reading the standards does: HTML, CSS and ECMA. It’s easy to get overwhelmed with more than 2,000 pages of quite dense and very specific reading, so start small. Websites such as SmashingMagazine, PonyFoo, HTML5Rocks and others will keep you up to date on the latest developments and might trigger an urge to understand things deeper.

    Network

    Every awesome front-end application needs to get to the user’s browser somehow. It’s also likely that you will have to make some asynchronous fetch requests to back-end services. All of this makes use of network, which means you should be aware of what is involved in making an HTTP request, at least on the level of Wikipedia with a sprinkle of cache-related topics, as well as what request latency is composed of.

    While it is not a requirement for a front-end developer, knowing the connection on a TCP level is a nice thing to have, as is awareness of HTTP/2. Knowledge of REST services, at least from a consumer perspective, is certainly helpful as well.

    Debugging

    This goes back to the initial section on problem-solving, but also touches on every other front-end topic. Browsers are extremely complicated pieces of software with years of legacy, but still evolving at great speed, and this software is our domain as front-end developers. So whenever something goes wrong there, it’s our job to figure out why.

    Sometimes it means looking for JavaScript errors, other times you may need to profile your code to check for slow code paths, and occasionally you may need to use CURL to fire off some requests from your terminal.

    Security

    Web, being an open platform, is constantly under the threat of various attacks, targeting both users and companies. Every piece of code and every call the browser makes is a potential source of security vulnerabilities—initial load of the page, AJAX request, external scripts or iframe, and even a simple DOM manipulation can be vulnerable to XSS, CSRF and various other vectors of attacks. Being aware and vigilant is an essential requirement for the safety of the data of your customers and your company.

    Testing

    QA, as a department or a position, hasn’t existed at Zalando since we brought in Radical Agility in 2015. We believe that it’s each developer’s responsibility to ensure the quality of their produced code, and front end has some very specific strategies for testing and asserting non-functional properties of the code.

    We believe that unit testing is a must for any project, and we highly encourage TDD, especially for a dynamic language such as JavaScript. Generally, you also would want to supplement this with some end-to-end or functional tests to make sure users can do what we expect they should be able to do.

    Tooling/Automation

    All of the topics discussed here also require very specialized tooling. You definitely should be comfortable with the concept of resource bundling and the tools available for this purpose. As mentioned above, testing by hand is not our thing, so a setup with automated tests is a must for every project.

    Ideally, tooling and automation should be complemented by continuous integration/continuous delivery to make sure no code slips past without running those tests. Depending on the project, you also might want to use a transpiler such as PostCSS or Babel to help you write more modern code.

    Conclusion

    What we’ve collected above is obviously an enormous amount of knowledge and will rarely exist in a single mind; however, the strongest candidates have at least a general understanding and a keen insight with a select few to stand out as a front-end developer.

    About the Author / Dmitriy Kubyshkin

    dmitriykDmitriy Kubyshkin is a front-end architect at Zalando SE, helping delivery teams with the migration of their front-end features from a legacy monolith to their new microservices architecture. Connect with him on LinkedIn / Twitter.