Tag: debugging

  • Can ChatGPT Fix Bugs? ‘Wolverine’ Dev Says YES

    Can ChatGPT Fix Bugs? ‘Wolverine’ Dev Says YES

    Welcome to The Long View—where we peruse the news of the week and strip it to the essentials. Let’s work out what really matters.

    This week: Instead of AI aids for programming, what about for debugging? The pseudonymous “BioBootloader” says he’s persuaded GPT-4 to make his code self heal. (more…)

  • Fiberplane Notebook Tool Fosters DevOps Collaboration

    Fiberplane Notebook Tool Fosters DevOps Collaboration

    Fiberplane today announced it is making available a public beta of a namesake real-time collaboration notebook specifically designed for DevOps teams that need to quickly debug IT infrastructure.

    Fiberplane CEO Micha Hernandez van Leuffen said in the wake of the COVID-19 pandemic, it’s clear that the structure of DevOps teams has permanently changed now that more members of those teams work remotely. The challenge is that the tools provided to DevOps teams to manage IT environments were not designed to foster the level of collaboration that is now required, he added.

    Dashboards that were designed in a different era need to be replaced with tools that make it simpler for DevOps teams to collaboratively debug infrastructure in real-time, noted Hernandez van Leuffen.

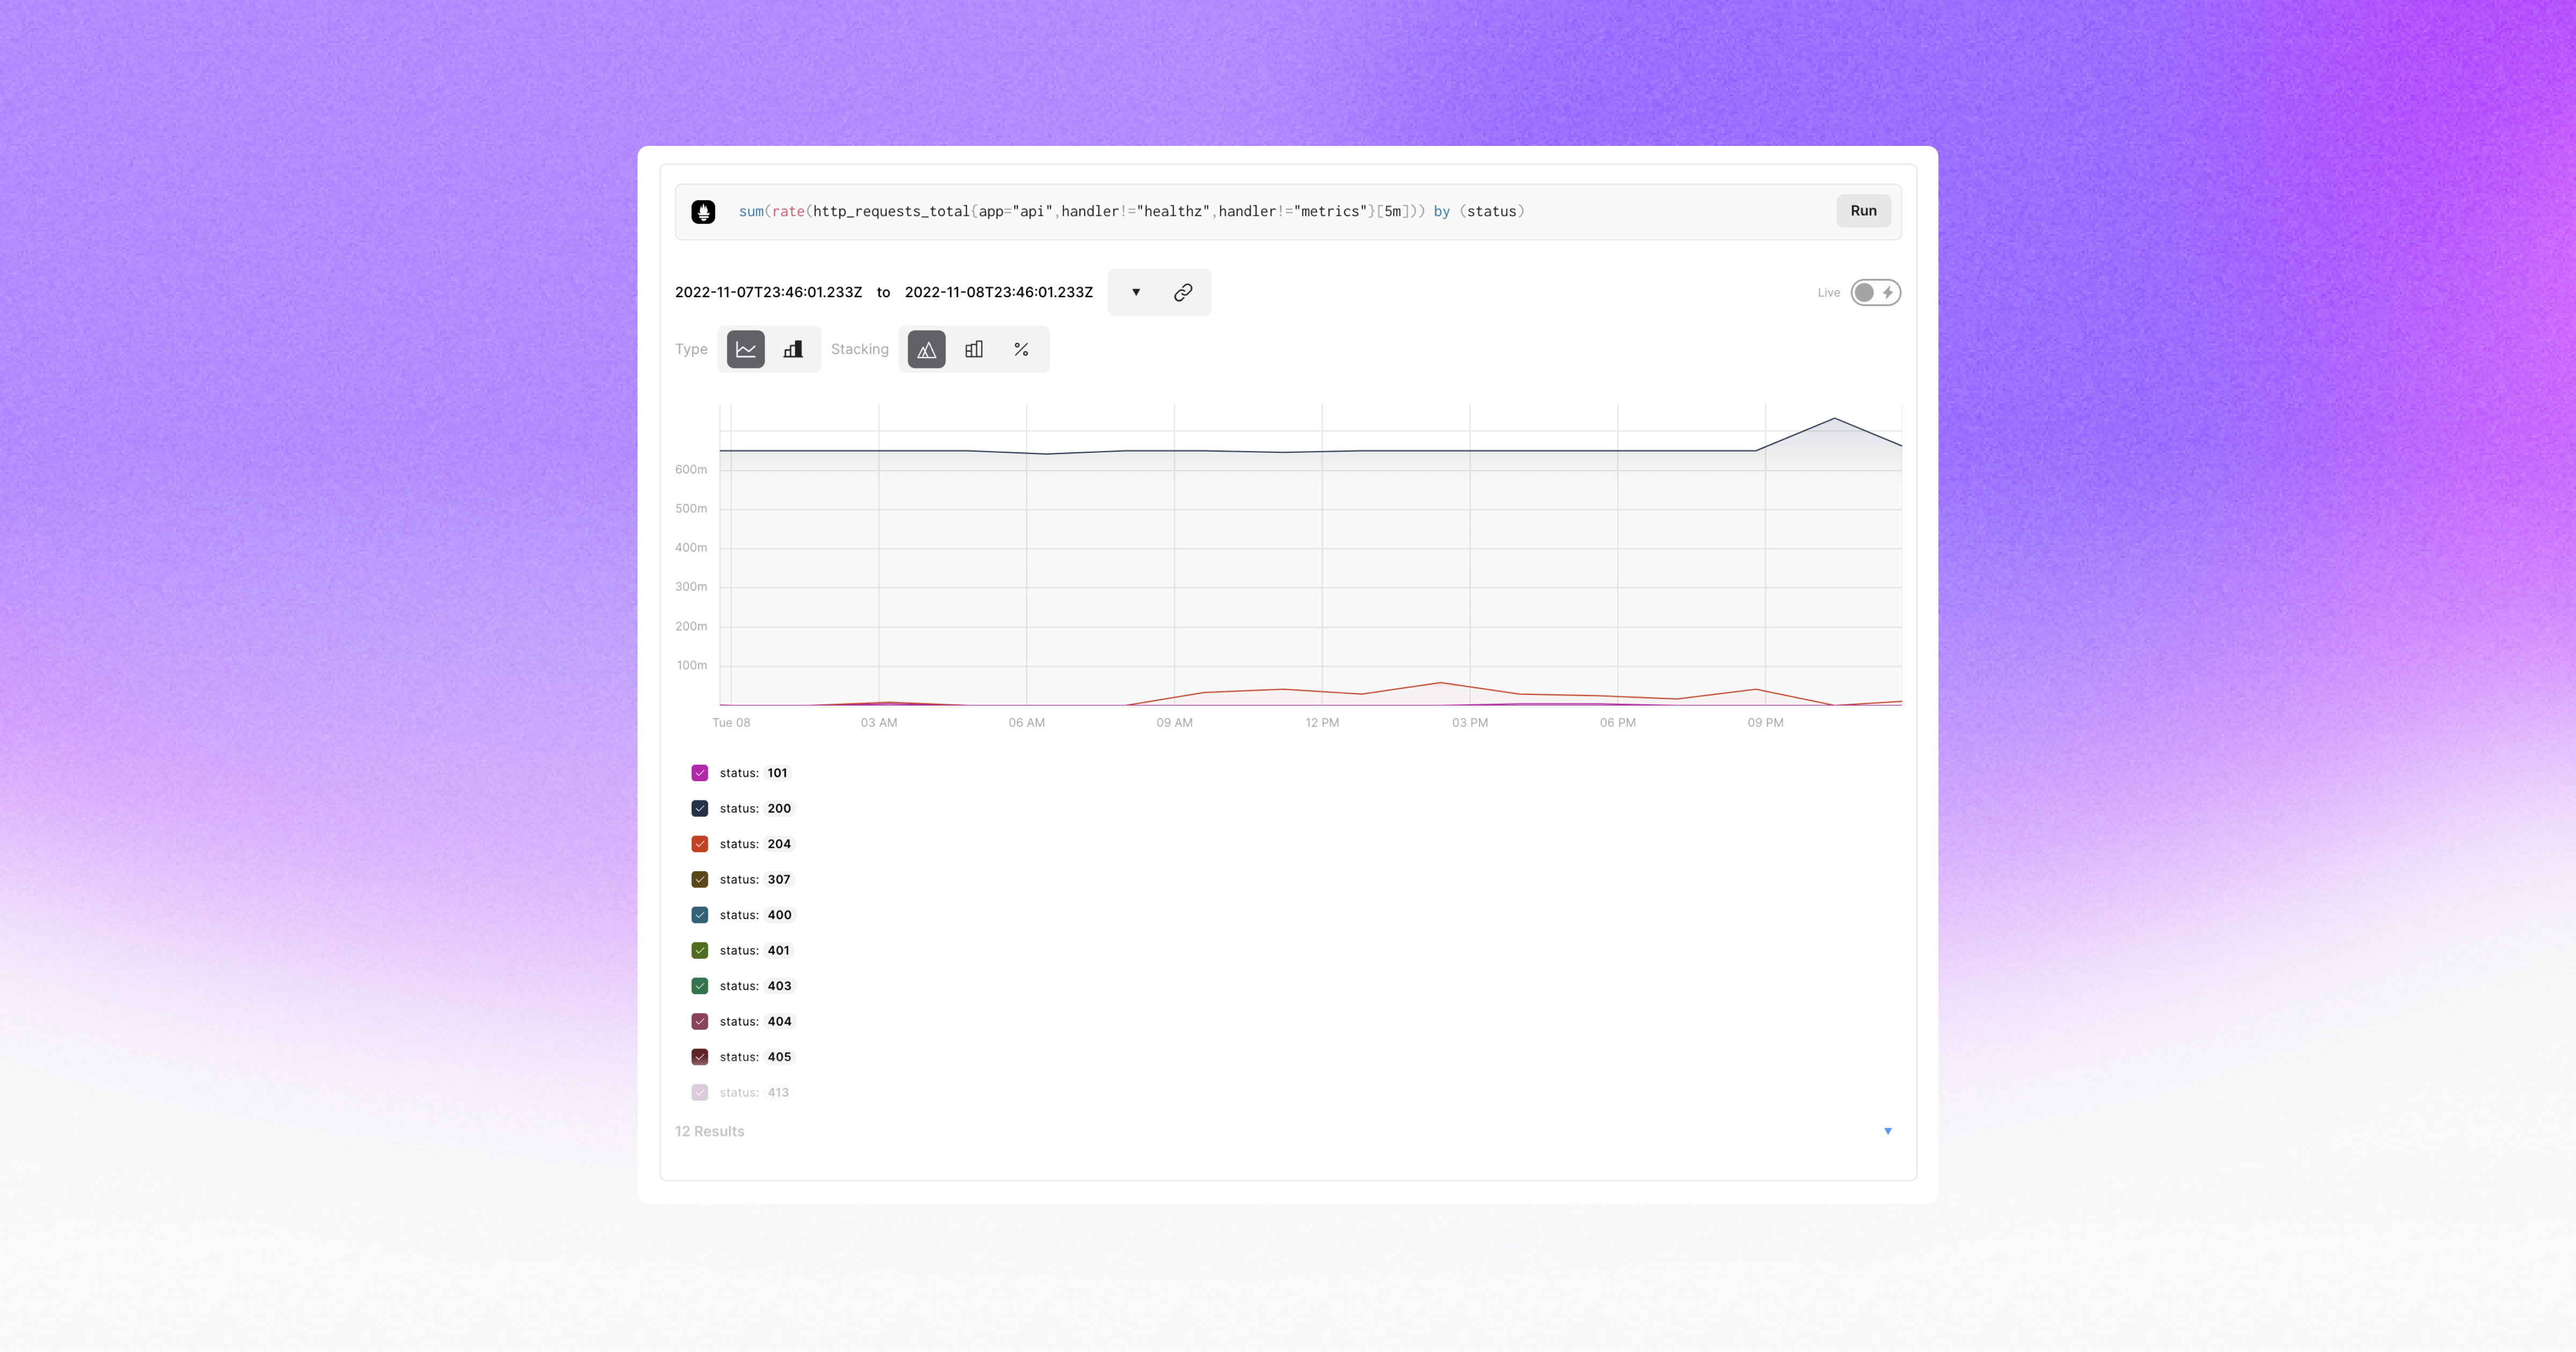
    The Fiberplane notebook achieves that goal by using the same operational transformation algorithm used in Google Docs to enable teams to easily collaborate around a document or spreadsheet. The core platform itself is built in Rust and WebAssembly (Wasm), which Hernandez van Leuffen said makes it simpler to integrate Fiberplane as a plug-in into an existing DevOps workflow. Inside a Fiberplane Notebook, DevOps teams can, for example, write and run PromQL queries and display Prometheus charts alongside other data presented via an integrated graph.

    Fiberplane Notebook’s initial integrations are for Grafana Loki, Elasticsearch and Prometheus monitoring tools. It also exposes both an application programming interface (API) and command line interface (CLI) to automate notebook creation based on specific external events, such as monitoring alerts.

    In effect, Fiberplane is taking the concept of notebooks used for collaboration by data science teams and applying it to DevOps workflows, said Hernandez van Leuffen. The goal is to improve DevOps teams’ productivity by reducing the amount of time it takes to resolve any issue, he added.

    As IT environments become more distributed in the age of the cloud and microservices, troubleshooting issues invariably spans the responsibilities of multiple members of an IT team. Fiberplane, in effect, makes it possible to spin up a virtual war room that enables the members of an IT organization to collaborate until the issue of the moment is resolved.

    The speed at which any IT issue is resolved has become a crucial metric. Given the complexity of IT environments, it’s inevitable that incidents will arise. Ideally, IT teams would discover those issues before they disrupt the business. However, in reality, the metrics organizations use to evaluate the effectiveness of a DevOps team are, unfairly or not, how quickly IT issues are resolved once they are discovered. The longer it takes for a distributed DevOps team to marshal its resources the more likely it becomes that team will be perceived as being inefficient—regardless of what level of application availability is actually achieved.

    Savvy DevOps teams, of course, have implemented a wide range of incident management best practices that create a level of muscle memory for responding to a wide range of issues. The trouble is there will always be unforeseen issues that arise. DevOps teams, as a result, need to find ways to quickly focus on an issue that, for one reason or another, were simply too unpredictable to anticipate; they need to expect the unexpected.

  • Code Ownership Is Key to Accelerate Debugging

    Code Ownership Is Key to Accelerate Debugging

    App stability is a fundamental part of every app experience. Broadly speaking, app stability is a measurement of the number of total app sessions that are crash-free or the percentage of daily active users who do not experience an error. End users have little patience for apps that crash or fail. Every application, whether it’s B2B- or B2C-oriented, suffers some level of instability and fails occasionally. Ideally, organizations should aim for app stability scores close to 99.999%. To achieve that quality of performance, software engineers must be fast and efficient in fixing coding errors that are frequently the cause of app crashes.

    But that’s a major challenge using the traditional approach to debugging. Most major applications have a wide variety of engineers, including completely separate engineering teams, all working from a single code base. Each team typically uses their own unique issue tracker to monitor errors, such as Jira or Asana. In addition, teams typically use their own channel in a collaboration platform to communicate internally, like Slack or Microsoft Teams. This causes silos between the various engineering teams, limiting communication and visibility between each team.

    When an error occurs, all the engineering teams are alerted about the bug through their own issue trackers. From there, they figure out where the error occurred in the code and who is specifically responsible for fixing it. This requires each team to manually review code as they try to locate the bug, which wastes precious time as engineers duplicate one another’s efforts. Because teams are using different communication channels, there’s little to no collaboration or alignment between the various engineering teams during this process. Overall, this approach to debugging is a cumbersome and inefficient undertaking that slows the process of repairing apps, ultimately hurting the end user experience.

    Consider a real-world example. Suppose your team is one of a dozen engineering teams, all working together on an application that creates a mobile game. Perhaps your team works on maintaining the in-app purchases feature set, while another works on the account setup flow and yet another team works on character customization features. If a bug suddenly crashes the app for a significant portion of users (resulting in a clear drop in the app stability score), every team will receive an error alert through their issue tracker notifying them that a coding issue has caused the application to fail. No one will know if their team’s code was responsible. As a result, each team is forced to go through the laborious process outlined above. If it turns out that the bug was in the character customization code, then the teams responsible for in-app purchases and account setup have wasted valuable time and resources searching for the error.

    The only team that should be notified of a bug is the one responsible for the part of the code a bug originates from. The emerging concept of code ownership makes this possible, providing a faster and easier approach to debugging. With this method, organizations create code owner files to determine which engineers or teams are responsible for each section of code, feature flags or experiments. If section X within the code fails, then team X will be responsible for addressing it. In the example above, only the team responsible for the code associated with character customization would need to find and fix the bug.

    This makes it much easier to respond to application issues and allocate the correct resources to remedy those issues. For end users, code ownership means that malfunctioning apps will be fixed faster, improving the customer experience and boosting business metrics. From an internal POV, engineering teams become far more cost- and time-efficient, freeing developers to take on new projects they actually enjoy working on.

    A culture of code ownership also helps engineering teams adopt other best practices for debugging. One major example is error prioritization. Not all bugs cause significant app instability and need to be fixed right away. When a team can ignore errors unrelated to their code, they have more time to fully hone in on and evaluate the errors they are responsible for. With this focused approach, they can establish metrics determining if they need to fix a bug immediately or if it can wait.

    Simply put, code ownership eliminates the confusion and guesswork associated with the process of debugging, allowing engineering teams to easily identify, own, prioritize and remedy bugs. Embracing code ownership is critical for companies to improve app stability, which is the most fundamental measure of an app’s health. This ties directly into business outcomes, because app stability is closely associated with customer retention, customer growth, sales and revenue. By speeding up debugging efforts, code ownership has a pronounced, positive impact on stability, boosting each of those metrics.

  • How Real-Time Debugging Improves Reliability

    How Real-Time Debugging Improves Reliability

    When designing and building software, service reliability is always at the top of the list of critical focus areas for development teams. Every team that builds software typically has, either directly or indirectly, service level agreements with their customers. These are, essentially, agreed-upon metrics or performance criteria that teams use to measure and ensure the reliability of a software system.

    Organizations may measure reliability in different ways, looking at metrics like service availability, mean time to failure or mean time to repair. Regardless of how an organization chooses to measure reliability, you can often assess the health of an organization based on how reliable their applications are. Since we know that reliability issues happen regardless of how well we prepare for them, having tools to solve those issues quickly and efficiently becomes critical to maintaining smooth operations.

    The Health of Your Organization

    Most software development organizations today have key performance indicators (KPIs) which they measure to understand how well they’re doing and to be able to quickly and easily measure the health of their application development processes. If teams are finding that they are not meeting KPI’s, it’s often a sign that something fundamental needs to change or that new and improved processes need to be put in place. Teams that are constantly measuring what they’re doing well and where they are falling short with a data-driven approach are typically the teams that come out ahead.

    In short, a team’s ability to measure and hit KPI’s and service level agreements with their customers directly influences the overall success and health of that team. If an organization isn’t producing applications that are reliable and available when their customers need them, it’s unlikely that company will have customers for very long. When reliability issues do occur, it’s critical that developers can immediately go to the source of the issue in their code to ensure that they can solve those customer issues as quickly and efficiently as possible. One such approach is to give developers the ability to do real-time debugging directly in the environment where those issues occur, without needing to create costly reproduction environments or having to figure out how to reproduce issues locally that are, many times, data dependent.

    Reliability is Shifting Left

    Historically, software reliability has fallen on the shoulders of operations or production support teams who manage the deployments and runtime of software after it’s been deployed to production (and after developers have thrown the code over the metaphorical wall). Things have changed in the recent years, in that many of today’s development teams are responsible for their applications from development all the way through to running and supporting those applications in production. Because of this, developers have more incentive than ever to ensure that their software has reliability built in, or at least the ability to quickly debug reliability issues when things go wrong.

    Real-time debuggers are one such category of tools that development teams are choosing to package with their applications in order to solve those hard-to-address customer issues faster. Real-time debuggers are solutions which allow development teams to gather code-level debugging information such as snapshots of local variables, stack traces, tracing information and profiling data. All of this data (which traditionally relies on developers having the right logs in their code and, if not, deploying new debug builds) becomes instantly available, on-demand whenever an issue arises. This faster approach to identification of issues can drastically improve the reliability of applications by allowing developers to solve issues in a fraction of the time it would normally take.

    Teams Focusing on Reliability Move Faster

    Many development teams have shifted to an agile approach to delivering software; the goal being to respond quickly to business needs and to get new, valuable features to their customers as quickly as possible. Even though this is a helpful step, unplanned events can and will happen, which need to be planned for as much as possible ahead of time. In a recent Forbes article by Rookout CEO Shahar Fogel, he discusses how businesses should consider these software bugs as mini outages. Any time teams are dealing with software bugs or other unplanned issues, it costs the business revenue and can potentially leave customers frustrated. Focusing on metrics like mean time to repair (and giving developers the tools they need to reduce the mean time to repair) can give teams the ability to better predict how long unplanned issues will take to remediate once they occur.

    In the book Accelerate by Nicole Forsgren, Jez Humble and Gene Kim, the authors discuss the notion that, by giving developers tools to fix problems when they occur, teams create an environment where developers accept responsibility for global outcomes such as quality, stability and reliability. Investments in technology are also an investment in people. So, it’s no wonder that by investing in technologies that can help improve reliability, teams will be able to move faster. This means happier customers, happier employees and a thriving business.

    By focusing on service reliability, development teams are not only able to move more quickly, but are also directly contributing to the overall health and success of their organization. We’re seeing the onus of reliability shifted from operations teams to development teams, which adds newfound importance on ensuring development teams are building reliability into their product. Real-time debugging tools are one potential solution to ensuring that developers have the ability to quickly address unplanned customer issues which can directly impact the perceived reliability of an application.

  • Debugging is Broken – Here’s How To Fix It

    Debugging is Broken – Here’s How To Fix It

    Let’s face it, debugging is broken.

    Whether you wholeheartedly agree or vehemently disagree with that statement, I think we can all agree that debugging, at the very least, has room for improvement. In fact, the way software developers debug their code hasn’t changed much. Of course, there are now a wide array of observability and monitoring tools available to make a developer’s life easier, but when we look at the process developers typically follow when debugging code, it’s stayed relatively unchanged over the years.

    Having the right tools available definitely improved the overall debugging experience, but they’re not the only factor. Internal organizational processes are equally as important, and should be adapted to make developers’ lives as smooth and stress-free as possible while still maintaining the proper levels of organizational security and compliance. Inefficient or highly restrictive processes, while great for the compliance team, can adversely affect the velocity of getting to the bottom of issues quickly. The right solution is typically a combination of adapting those processes to fit the company culture, along with a combination of tools that allow for compliance with industry standards and best practices.

    How Developers Debug Code

    When you talk to developers today about how they debug their applications, the process is typically not all that different than it was many years ago. The standard approach to debugging is still through the use of logging frameworks. Of course, teams are taking advantage of things like application performance management (APM) tools and other tools in the monitoring and observability space, but when you look at the primary method of debugging issues that require developers to dive into the code, logging is typically the main approach.

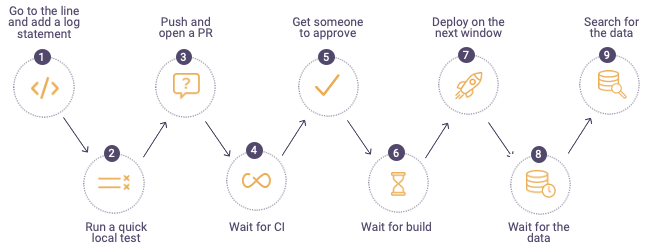
    The process typically looks something like this:


    debugging process

    When a defect is found, developers will first go to the log files on the production or pre-production servers in the environment where they are debugging. If they can’t find information in the logs to help them get to the root cause of the issue, they go back to their code and add additional log lines, finally sending their code through the process shown above. For highly advanced organizations, the process can take minutes or hours, but more often than not, this process drags on for days – or even weeks. It becomes especially time-consuming when the defect developers are trying to find and remediate is in production. In these cases, the cost to the business can be staggering; there’s got to be a better and more efficient approach to debugging.

    Where Tools Can Help

    While new and shiny tools don’t always solve all debugging problems, they can often ease some of the pain developers face and, in the process, make their lives a little bit easier. Debugging, observability and monitoring tools can get developers the data they need to solve problems faster than the more traditional method of digging through logs and using trial and error.

    The place many organizations start when considering diagnostic tools is with APM. These types of tools focus specifically on monitoring and management of the application availability, and can help to collect metrics and other relevant application information that can aid in pinpointing infrastructure issues. Most often, these tools are not actually used by developers themselves, but rather operations or production support teams to ensure availability and performance thresholds of applications.

    Another critical category of telemetry are tracing tools, which can help developers better understand how requests flow through multiple tiers of applications and even help identify error rates and latency. There are many vendors selling this category of tools, but there are also open source options which allow developers to integrate tracing into their applications via a vendor-neutral approach.

    After diagnosing an issue with an APM solution, there is often a handoff to development to remediate the issue. When developers need to debug, they often use their local IDEs or, even better, a remote debugging solution. Remote debuggers are used directly by developers to simplify debugging of applications in remote environments. These tools helps developers get to the bottom of customer issues faster by giving them direct access to the underlying application data in a safe and secure way while the application is running without stopping it or having to redeploy it. A major benefit of remote debuggers is that they can give developers the data they need from production environments without compromising security or requiring developers to have direct access to sensitive environments. While remote debuggers and other debugging tools are not a silver bullet, they can be a critical component that empowers developers to better address critical issues.

    Fixing Organizational Problems

    If solving customer issues is taking longer than expected or is potentially hurting your brand, it’s critical to sit down with your development team and use a data-driven approach to identify where the problems lie. Do a deep dive into your issue tracking or ITSM system to identify trends or recurring issues within particular application components. Development teams can often become so overwhelmed tackling issues and building out new features that valuable information in these internal systems can go untapped. Customer issues and defects should be reviewed periodically to assess things like business impact, cost to fix and alignment with the product roadmap. There is valuable information that can help focus the team’s effort on time-saving activities as well as improving the product, making for happier customers.

    Another area to look at is your software delivery process. Are there bottlenecks in your delivery pipeline that could be made easier or more efficient but have been overlooked? The speed and efficiency of your software delivery pipeline has a direct impact on developers’ ability to debug effectively and can contribute to a broken or slow debugging process. Developers should have the ability to push code into new environments as quickly as possible to remove slowdowns from too much context switching. This means automating as much of the delivery pipeline as possible, removing unnecessary manual deployment approvals and shifting left as many activities as possible.

    When it comes to empowering developers and fixing broken debugging processes, organizations should focus on fixing organizational bottlenecks as well as equipping developers with tools that can save them time and improve their daily workflows. Focusing on these areas can increase development team velocity and eliminate costly day-to-day slowdowns which add up over time and negatively impact productivity. With a few key changes, debugging can be a much more manageable and predictable process.

  • Sonatype Acquires MuseDev to Add Code Analysis

    Sonatype Acquires MuseDev to Add Code Analysis

    Sonatype today revealed it has acquired MuseDev, a provider of a code analysis tool, in addition to updating its Nexus platform for discovering vulnerabilities in software supply chains.

    Muse analyzes code each time a pull request is made, which makes it easier for developers to discover and address issues long before they commit code. Muse is integrated with 24 pre-configured code analyzers for GitHub, GitLab and Bitbucket repositories. It then analyzes each pull request to surface bugs, as part of automated code review, and includes analysis of interprocedural information flow and thread safety issue analysis, along with guidance to fix any bugs discovered.

    In addition to adding support for Muse, the latest edition of the Nexus platform integrates a container firewall from NueVector along with a set of tools for identifying and providing guidance on how to address misconfiguration issues that frequently arise when developers employ open source Terraform software to programmatically manage infrastructure as code.

    Finally, Sonatype added tools to provide better guidance on the implications of open source licensing terms attached to various projects, while at the same time starting its own community for organizations migrating from Bintray and JCenter, now that those tools have been sunsetted.

    Brian Fox, Sonatype CTO, said the expectation is Muse will create an opportunity to introduce the complete DevSecOps portfolio to developers as they analyze code. Most developers are keenly interested in both optimizing and securing their code. They would just prefer to achieve that goal on their own versus being informed of an issue after code has been committed to a repository managed by a larger DevOps team, noted Fox.

    An advanced development pack was added to the Nexus platform last year to make it easier to surface dependencies in code that are vulnerable to threats. It applies machine and deep learning algorithms to automatically identify and block software supply chain attacks based on typosquatting and malicious code injections. Collectively, these tools give developers control over third-party open source code, first-party source code, infrastructure as code and containerized code, Fox said.

    Sonatype claims it now counts 70% of the Fortune 100 as customers, and supports more than 2,000 commercial engineering teams. In 2020, it claimed it saw a 35% annual growth in Nexus repository installs, which now stands at more than 250,000 instances employed by nearly 15 million developers.

    Overall, it’s not clear how much progress is being made toward embracing DevSecOps best practices. Sonatype, however. is making a case for putting DevSecOps tools directly into the hands of developers to address software supply chain security. In the wake of some recent high-profile breaches involving software supply chains, that approach may soon gain additional traction. After all, for all the encouragement being provided by application development team leaders these days, there’s nothing quite as effective as providing developers with a set of tools that enables them to achieve that goal on their own terms versus requiring them to follow a set of procedures dictated by a DevOps management team.