Cloud migration is moving data, applications or other services to a cloud computing environment from an on-prem data center. Migrating your project means moving your data from the on-premises data center to the cloud. In this case, the cloud is the virtualization used over a data center to make the functionalities more flexible. Many companies like GoDaddy, Expedia, Netflix, startups, etc., have recently moved their business to the cloud. Migration is a big task and AWS facilitates migration in phases.
Need for Migration
Business is no easy task when handling situations like security, scaling up or down, etc. Let’s look at a few scenarios where AWS Migration could be a better resort.
More users coming in amid high-performance
Faster implementation and deployment needs
Expensive to manage a growing database
Datacenter mishap went down
We can conclude that the following are key reasons to migrate to the cloud:
Zero capital cost on infrastructure
Security
Scalable (vertically and horizontally)
Productivity
Pay what you use
Easy to manage services
Reduced operational costs
If you migrate to the cloud, the abovementioned problems will be handled automatically. Let’s move further and understand what migration is.
Phases of AWS Migration
AWS Cloud Migration is a step-by-step process that consists of planning, preparation and discovery, migration and optimization. However, it is more complex as the process involves different phases. Let me now talk about the various phases of migration.
Phase 1: Migration Preparation and Business Planning
In this phase, you identify the need, objective and benefits of cloud migration. You perform a POC and verify the outcome to compare the performance and costs. There are also times when you need not move your entire business to the cloud. This is where segregation is important. You need to identify the applications which can be migrated and those which cannot. This is what the first phase is all about.
Phase 2: Assessment — Choosing Your Migration Method (Discovery and Analysis & Assessment)
The first step is to identify the assets that need to be migrated to the cloud — gather the details such as the number of servers to migrate, road map to migration, record business-critical activities, server size, memory utilization, CPU utilization, environment type and data. You can use the ‘AWS Application Discovery Service’ to check the technical details by installing it in your server. Depending on the data, AWS provides different ways to migrate your application, e.g., AWS Snowball, AWS Snowmobile, AWS Direct Connect, etc. Also, assess the cost of renting servers, storage, network and support. Prepare the checklist for regulatory and compliance assessment and perform the security assessment.
Phase 3: Proof of Concept (POC) for AWS Storage/Designing
Once you know how and what you are migrating, next, you must plan your delivery priorities and design the AWS Cloud Migration process. You will identify the dependencies (upstream and downstream components). Define the organization or account strategy for users, VPC strategy and what cloud pattern it will be (hybrid/fully cloud) and other parameters like security.
Phase 4: Migration to AWS
Now that you have all the prerequisites such as the blueprint, migration tools, a list of assignments, backups, and its synchronization with your on-premises data repositories, you can finally migrate your project/application to AWS Cloud. Once you have migrated your project to the cloud, reliability and durability are the added benefits you get. For application code/server migration use AWS Server Migration Service, for database, you can use AWS Database Migration Service and other import/export AWS services.
Phase 5: Enterprise Cloud Operations (Operate and Optimize)
At this point, you have already migrated to AWS and it will bring updates that you would need to incorporate in your existing architecture. Optimize your architecture, have your support team ready to look for the new features and cost optimization, improve the applications using serverless, use AWS monitoring and logging services and implement CloudFormation and DevOps.
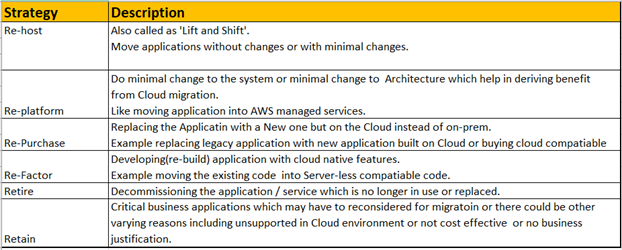
Application Migration Strategies ‘The 6 Rs’
The complexity of migrating existing applications varies, depending on the architecture, Amazon came up with different strategies which they commonly termed as 6 R’s. Let’s look into each of them:
Benefits of AWS Migration
Elasticity: Adding and removing capacity whenever it is needed is the greatest benefit of
Disaster Recovery: With 95% guaranteed uptime, businesses can be confident knowing that their data will always be available.
Enhanced Cost Management: The IaaS platform provides two major First, an IaaS such as Amazon Web Services is available as a monthly service. Second, it eliminates the need to continue to purchase and maintain physical hardware.
Services for AWS Migration
Out of the many tools provided by Amazon to automate data migration, I will be talking about the more commonly used ones.
AWS Migration Hub: AWS provides a single location for tracking the migration process. Migration Hub gives you the freedom to choose your migration partner and tools that fit your needs.
AWS Server Migration Service (SMS): AWS SMS is an agentless service that helps migrate loads of on-premises workload to AWS easily and faster. It allows you to automate migration and track the replication of the server. It makes coordinating with your large-scale-server migration easier.
Amazon S3 Transfer Acceleration: This makes the transfer of files over long range to the AWS S3 bucket faster and more secure.
AWS Snowball: It is a petabyte-scale data transfer solution that uses secure devices to transfer a large amount of data in and out of AWS.
AWS Snowmobile: It is an exabyte-scale data transfer solution to move an extremely large amount of data to AWS. Snowmobile makes the transfer of massive volumes of data easier.
Amazon Kinesis Firehose: It is the easiest out of all the methods. It can capture and automatically load streaming data into Amazon S3. You can analyze real-time data to get timely insights of the migration.
Now that you know everything about AWS, and AWS Migration, let me show you a use case where you will be migrating a Virtual OS from my local machine to AWS Cloud.
AWS Data Migration
Data can be moved from on-prem to AWS Datacenter using the following means:
Amazon S3 Transfer Acceleration — for faster transfer over the internet change the endpoint you use with your S3 bucket and acceleration is automatically applied.
AWS Snowball — a petabyte-scale data transport solution that uses secure appliances to transfer large amounts of data into and out of AWS.
AWS Direct Connect — you establish a dedicated network connection between your network and one of the AWS Direct Connect locations for transfer.
Demo: Implementing Migration Using the Import/ Export Method
You will be migrating an on-premises Virtual OS running on VMWare to AWS using the import/export (AWS Direct Connect) method.
Cloud is a service market, clearly, it is. As such, cloud service providers are at liberty to sell certain services in specific regions. Equally, they can choose to sell several defined services inside some contract bundles, while also selling other services to either new or existing customers (but not always both), as they see fit.
While the financial services industry, home internet service providers and perhaps a selection of telcos and retailers might package their most enticing deals up for “new customers only” in a sort of bait-and-switch move, the information technology industry typically works the other way around. To encourage new customers to move forward with a vendor’s longer-term platform roadmap, it’s more common to see an IT brand the size of an ERP vendor or a hyper scaler channeling new customers away from older products.
This may explain what has been happening at Amazon Web Services (AWS).
Cloud9 & AWS CodeCommit
After an initial statement and product flag that appeared in July, as we now stand in August 2024 new customers will no longer be able to sign up for AWS Cloud9 (a cloud-based integrated development environment) and the AWS CodeCommit private Git repository service.
That’s what’s moving, so how and these technologies used, what are the alternatives and what does AWS have to say about its strategy and tactics here?
The AWS Cloud9 IDE is a code-editing service for cloud-centric developers to use with support for several programming languages and runtime debuggers. It has a built-in terminal and a collection of tools that can be used to code, build, run, test and debug cloud software. AWS CodeCommit is a managed source code control service that hosts private Git repositories and stores anything from code to binaries. With AWS at the backend, this is a code store for teams that don’t want to worry about scaling infrastructure.
Also Now Available, Not
While Cloud9 and AWS CodeCommit are the services initially highlighted, other AWS services not now available to new customers include Amazon S3 Select (a tool to use SQL statements to filter and retrieve subsets of data from an Amazon S3 object), Amazon S3 Glacier Select (a query tool for AWS Glacier, a slower performing low-cost data storage service), Amazon CloudSearch (a managed service to set up a search solution for a website), Amazon Forecast (a fully managed service that uses statistical and machine learning algorithms to deliver highly accurate time-series forecasts) and AWS Data Pipeline (a web service that cloud developers and data engineers can use to automate the movement and transformation of data).
Cloud Native Now spoke to AWS central command in the EMEA region this week and received the following statement from an AWS spokesperson.
“After careful consideration, we decided to close new customer access to a few services so we can focus on delivering the innovation that customers value most. These services will remain available to existing customers, and we will continue to make security, availability and performance enhancements [to these tools], however we do not plan to introduce new features. We will continue to support our customers, whether they continue to use these services, or they migrate to other AWS offerings or alternative third-party solutions,” said AWS.
The AWS “Eye” In The Sky
So, it’s what we intimated and suggested at the start of this story then right? As newer technologies platform technologies evolve (and let’s be honest, in an era of generative AI and the current golden age of data science, a lot is shifting), this is a case of AWS using its internal “eye” to see further down the road than any external cloud advocate or evangelist might even be able to view.
AWS has promised to provide detailed guidance on the steps customers can take to ensure a smooth transition to any new service that they choose.
“We also support migrations to other AWS or third-party solutions better aligned with your evolving needs. Keep the feedback coming. We’re always listening, said Jeff Barr,” said chief evangelist at Amazon Web Services on X, formerly Twitter.
Migration Situations
As a working example (or two) of the kinds of migrations we’re talking about here, AWS provides detailed guidance on how customers can transfer from Amazon CloudSearch to Amazon OpenSearch and how customers can migrate their AWS CodeCommit repository to another Git provider.
Further on AWS CodeCommit, AWS says that users could make use of cloning or mirroring techniques to perform their migrations. In the case of AWS Cloud9, AWS advocates a migration to AWS IDE Toolkits and AWS CloudShell, a standalone, general-purpose tool that cloud engineers can use to run commands on AWS.
While some users might be understandably perturbed – especially those who were perhaps at the final stage of a project planning stage that featured some of the now “living legacy” technologies discussed here – most fast-moving cloud-native IT workshops will (arguably) have moved on and forgotten about these changes by Christmas.
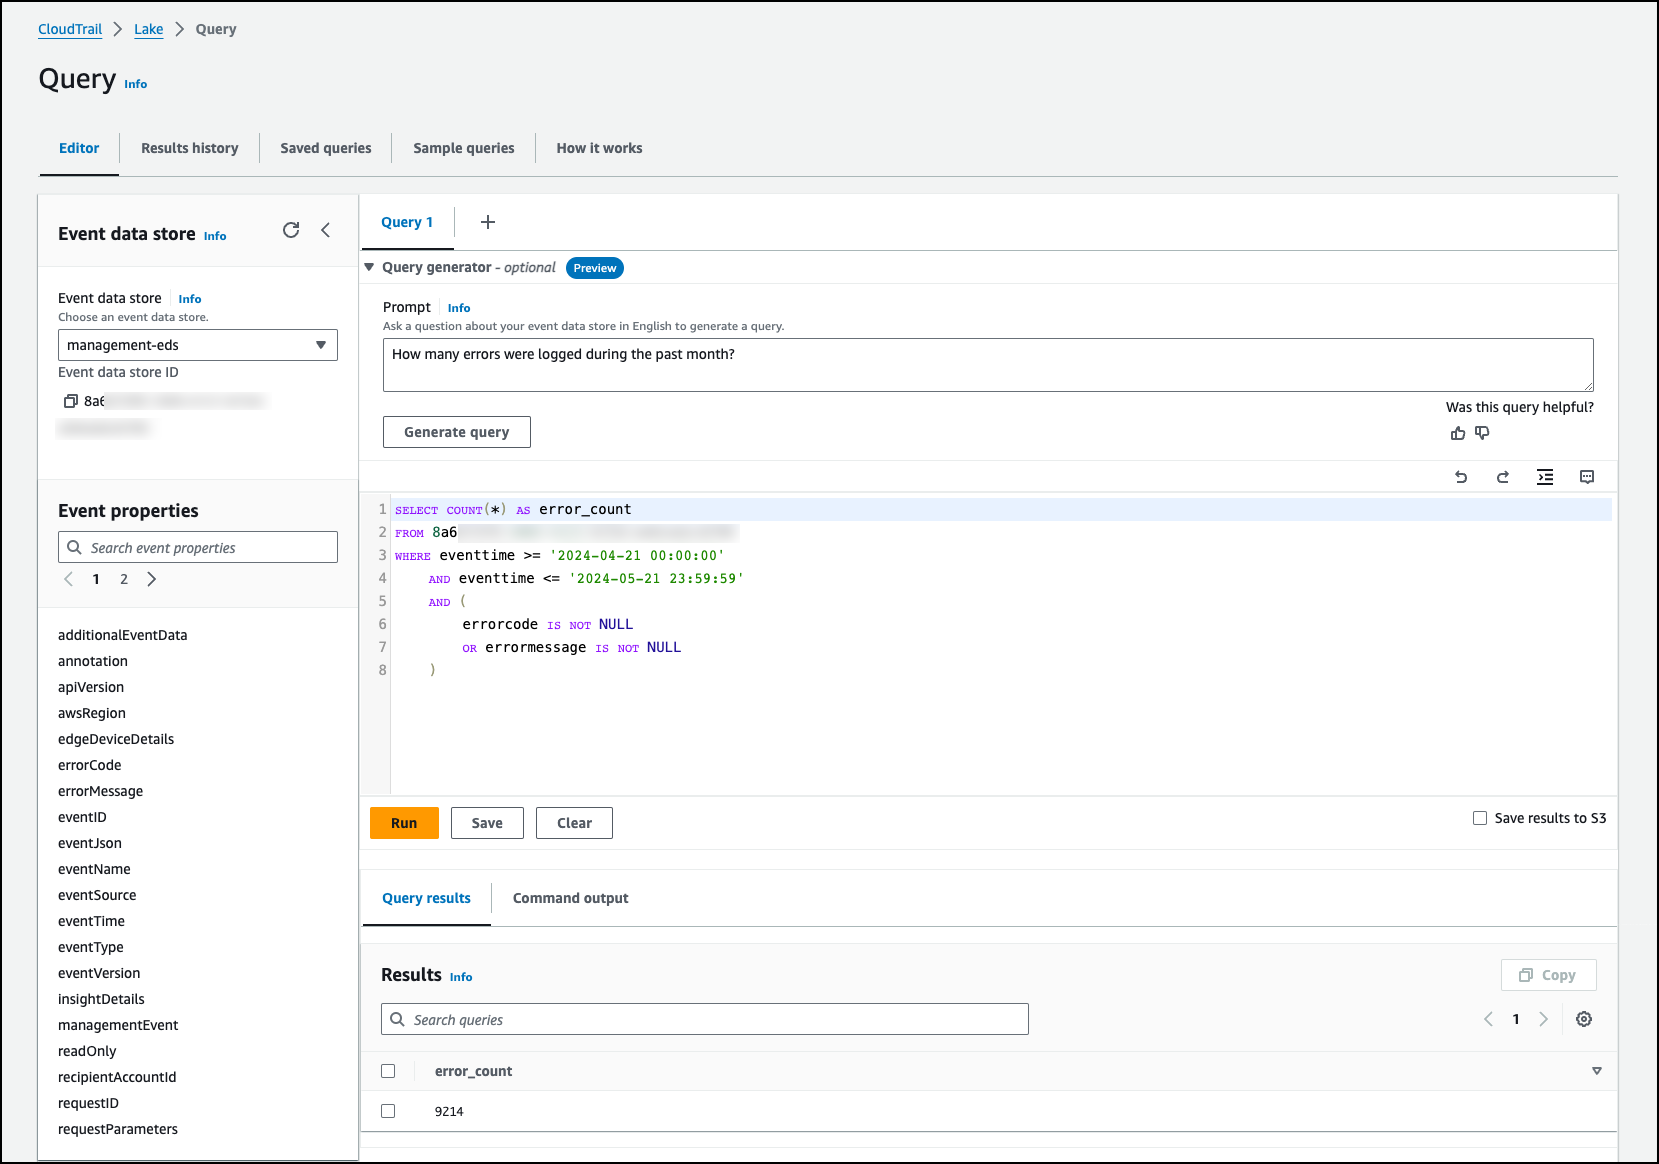
Amazon Web Services (AWS) today previewed a generative artificial intelligence (AI) tool for the data lake it provides to capture, store, access and analyze AWS CloudTrail activity logs that eliminates the need to know SQL to interrogate that data.
Announced at the AWS re:Inforce conference, the goal is to make it simpler to streamline DecSecOps workflows across teams of application developers, DevOps engineers and cybersecurity professionals.
AWS CISO Chris Betz told conference attendees that good DevSecOps intentions are not good enough. Organizations need access to tools platforms that enable them to create a culture that prioritizes cybersecurity, he added.
Mitch Ashley, principal analyst for Techstrong Research, said the challenge organizations face today is that many of the gates put in place by security teams fail to work at scale. As a result, developers will work to find ways around them, he added.
Organizations need to focus their efforts on creating guardrails, rather than gates, to create a culture that developers will embrace rather than resist, noted Ashley.
In general, AWS is focusing most of its cybersecurity efforts on a new generation of cloud infrastructure that is inherently more secure.
For example, AWS today launched AWS Service Insertion, an addition to AWS Cloud WAN that provides more control over how network traffic is routed Amazon Virtual Private Clouds (VPCs), AWS Regions, on-premises locations, security appliances and other inspection services using Cloud WAN policies or the AWS management console.
AWS also added support for FIDO2 passkeys as a method for multi-factor authentication (MFA) along with an AWS Identity and Access Management (IAM) Access Analyzer tool that enables DevSecOps teams to set, verify, and refine permissions, including recommendations for remediating unused access privileges. IAM Access Analyzer also now extends custom policy checks to proactively detect nonconformant updates to policies granting public access to critical AWS resources within the context of a DevSecOps workflow.
Finally, AWS updated AWS Audit Manager to provide additional controls for tracking usage of generative AI frameworks such as AWS Sagemaker.
Organizations Struggle With Cloud Security
Despite cloud platforms being widely used for more than a decade, many organizations continue to struggle with cloud security. In many instances, developers with limited cybersecurity expertise continue to build and deploy applications with little supervision. AWS is clearly encouraging organizations to apply those controls in addition to taking advantage of next-generation Graviton processors based on an Arm architecture, which in addition to being faster than legacy processors have more built-in security capabilities.
Regardless of approach, it’s now only a matter of time before more stringent software supply chain regulations require organizations to revisit their approach to cloud security. The challenge and the opportunity now is finding ways to get ahead of those regulations before a looming deadline creates a crisis that creates a level of panic that could have been avoided.
A CloudZero survey credits engineering teams with keeping cloud costs under control, but there’s still some room for improvement.
A survey of 1,000 U.S. engineering and finance professionals working in organizations with 100 to 9,999 employees, that spent at least $500,000 annually on cloud services from Amazon Web Services (AWS), Google Cloud Platform (GCP), or Microsoft Azure, finds just over half (51%) believe costs are higher than they should be, with 14% of those respondents claiming their cloud costs were way too high.
Conducted by CloudZero, a provider of a platform for managing cloud computing costs, the survey further finds that 81% of respondents said their cloud costs are “about where they should be” when engineering has some level of ownership. The survey also noted that more than half (59%) said their organization now has at least one person dedicated to implementing best FinOp practices to control cloud costs.
In total, 87% said they are able to investigate cost discrepancies in a matter of hours, the survey finds.
Despite those efforts, however, a full 88% said they see significant variance (5–30%) in actual cloud spend versus forecast, but only 43% said cloud costs are a higher priority in 2024 than in the previous year. In fact, well over a third (37%) said cloud costs are less of a concern.
Lack of Cloud Cost Visibility
Nevertheless, a full 89% of respondents said a lack of cloud cost visibility has an impact on their ability to carry out their role, with 46% describing that impact as significant. Among the 500 engineers that participated in the survey, 66% report a lack of visibility into cloud costs causing some level of disruption to their work, with 22% reporting high levels of disruption.
Three-quarters (75%) of all respondents noted they fear losing their jobs if cloud costs abruptly surge by 50% or more, the survey finds.
Only approximately a third of respondents said they could accurately allocate cloud costs, with 42% only being able to estimate. More than three quarters (78%) have less than 75% of their cloud spend allocated.
The profit margins enjoyed by cloud service providers suggest there is plenty of room for improvement when it comes to optimizing consumption of cloud services.
Costs Can be Highly Variable
Bill Buckley, senior vice president of engineering, said the challenge is that in addition to all the types of cloud services being consumed, costs can be highly variable from one month to the next. Developers also have a natural tendency to over provision cloud resources to ensure applications are always available without appreciating total costs, he added.
The best way to control those costs is to ensure engineering teams armed with the right tools are managing the consumption of those resources, said Buckley.
There may, of course, come a day soon when artificial intelligence (AI) is more broadly applied to rein in cloud costs by, for example, taking more advantage of spot instances to run workloads.
In the meantime, DevOps teams would be well-advised to revisit application workloads running on various clouds to make sure resources are optimally being employed in an era where many organizations as much as possible are trying to maximize existing investments in IT. After all, even in the best of times, it’s only a matter of time before someone from the finance teams starts asking questions that DevOps teams should be able to answer in a matter of minutes.
Cloud computing is a primary driver of modern technological advancements. However, as cloud services adoption continues to soar, so does a concern for their environmental impact. The further expansion of cloud infrastructure will demand more energy, which means the need for sustainable solutions has never been more acute.
Due to their scale, cloud vendors operating large data centers have a greater impact on minimizing the IT’s industry overall carbon footprint than do smaller on-premises deployments. In this article, we highlight the main benefits of migrating business operations to the large-scale cloud providers known for their established sustainable practices, and point to useful resources.
Follow the Leaders
Major cloud platforms, including Google Cloud Platform, Amazon Web Services and Microsoft Azure, have pledged to achieve net-zero carbon emissions in their data centers by 2030. These platforms are well-positioned to lead the adoption of sustainability principles in cloud engineering due to their reputation and global reach.
Microsoft’s study on the carbon benefits of cloud computing showed that an enterprise could reduce its carbon footprint by up to 98% by migrating to Microsoft Cloud, compared to running its IT operations in the on-premises data center.
As for Google Cloud, all of its cloud products are carbon neutral. Google achieves this by purchasing renewable energy to reduce the carbon footprint from operations performed on its infrastructure, as well as by using high-quality carbon credits to compensate for its remaining carbon emissions.
By moving your operations to the cloud and focusing on developing cloud-based applications, you can contribute to sustainable business practices and overall carbon footprint reduction.
Increase Energy Efficiency
Public cloud platforms rely on large-scale data centers with advanced infrastructure technologies. That allows them to reduce electricity consumption for overhead tasks such as lighting, cooling, and power conditioning. For example, according to Google’s environmental report, its data centers consume half the energy needed to power an average on-site data center.
Energy efficiency is also driven by higher server utilization rates and the ability to manage workloads flexibly. These are the main factors that allowed AWS to make its data centers 3.6 times more energy efficient than a median data center run by a U.S. company.
Additionally, the innovative approach applied to server architecture design in large data centers enables cloud service providers to develop custom hardware optimized for their customers’ workloads.
Big Names are Committed to Sustainable Software Development Practices
Another environmental benefit of running IT operations in the cloud is that public cloud platforms are committed to sustainable software engineering – and they want to make it feasible for anyone who uses their platforms.
Green (or sustainable) software starts at the design phase, considering carbon emissions as a project requirement. According to the Green Software Foundation, sustainable software applications are carbon efficient (can run on fewer machines and resources), energy efficient (require less energy to perform the same tasks), carbon aware (prioritize renewable energy sources as a power source) and hardware efficient (use less hardware).
IT operational efficiency is a fundamental of sustainable software engineering. Since cloud service providers already apply advanced technology to improve the energy and hardware efficiency of their infrastructure, cloud migration is a good start for supporting green coding.
Microsoft developed eight principles of sustainable software development for engineers to follow when they build, design, and deploy applications. You can apply these principles to all types of applications, whether deployed on-premise or in the cloud.
Amazon released a sustainable architecture guide with strategies for applying sustainability practices to optimize AWS infrastructure compute, storage and network layers. AWS also provides guidance on applying environmental best practices for designing and operating workloads in the cloud.
A Tools Roundup for Measuring and Reporting Carbon Emissions
In addition to implementing sustainability practices in their business operations, cloud platforms offer clients tools to monitor and measure carbon emissions linked to cloud service usage and report their overall carbon footprint following greenhouse gas protocol standards.
Google Cloud provides users with an emissions calculator. Using Carbon Footprint, you can track the emissions from running your applications. The tool lets you view and analyze data related to gross carbon emissions and use derived insights in emissions reports.
AWS also offers the Customer Carbon Footprint Tool for emissions tracking. You can calculate their carbon emissions associated with using AWS services, track emissions after migrating to the cloud, and use the data for sustainability reporting purposes.
Microsoft customers can access the Emissions Impact Dashboard to estimate their carbon footprint related to Microsoft Azure and Microsoft 365 cloud services. Microsoft also offers Cloud for Sustainability for tracking and managing carbon emissions. It gives you visibility into your organization’s environmental impact, aggregates data from various sources, and offers practical recommendations for reducing a carbon footprint.
Energizing Thoughts
Achieving “net zero” is not solely the responsibility of large-scale cloud providers. Businesses must also contribute. Itransition’s cloud consultants believe that if more companies move their IT operations from on-premises servers to the public cloud, overall energy consumption and related carbon footprint will decrease.
By leveraging renewable energy sources, optimizing infrastructure for energy efficiency and employing innovative technologies, these leading cloud platforms can attract a cohort of environmentally conscious clients. Those users may consider switching to the cloud not only for direct business benefits but also to make their operations more sustainable.
MongoDB is a source-available document-oriented database program. MongoDB is a a NoSQL database solution that uses JSON-like documents with optional schemas. Many organizations are opting to run MongoDB in the Amazon Web Services (AWS) cloud to gain improved scalability and reliability for their MongoDB deployment.
AWS offers a range of services that can be integrated with MongoDB, including computing power and multiple storage options. Running MongoDB on AWS can be done in a few different ways:
You can manually install and manage MongoDB on an AWS instance.
You can use MongoDB Atlas, a fully-managed database-as-a-service from the makers of MongoDB, that automatically takes care of your database operations.
In this article, we will cover the benefits of running MongoDB on AWS and show how to get started with MongoDB Atlas on AWS.
Benefits of Running MongoDB on AWS
Infrastructure Flexibility
With MongoDB on AWS, you can choose the instance that best fits your workload. For example, if you need more computing power, you can select a compute-optimized instance. If your workload requires more memory, you can opt for a memory-optimized instance. This flexibility extends to storage as well, with AWS offering both SSD and HDD storage options for your MongoDB database.
Scalability
Whether you’re dealing with a small application or a large enterprise-level operation, AWS allows you to quickly scale up or down to handle changes in requirements or spikes in popularity. AWS’s auto-scaling feature, combined with MongoDB’s sharding capabilities, provides you with a database solution that can grow with your business.
Integrated Security
Running MongoDB on AWS also offers robust security measures. AWS provides various security features, such as AWS Identity and Access Management (IAM), which allows you to set user permissions and policies. This means that you can have granular control over who can access your MongoDB databases and what actions they can perform.
Backup and Disaster Recovery
Finally, the combination of MongoDB and AWS provides robust options for backup and disaster recovery. AWS offers Amazon S3 for object storage, which is known for its durability and is well-suited to NoSQL workloads. You can also use AWS Snapshots to create backups of your MongoDB databases. In the event of a disaster, you can quickly launch more resources in AWS to ensure business continuity.
What is MongoDB Atlas?
MongoDB Atlas is a cloud-based, fully managed database service offered by MongoDB Inc. It provides an integrated suite of advanced features such as automated backups, monitoring, scaling, and security to run MongoDB in the cloud.
MongoDB Atlas handles the operational aspects of running MongoDB, eliminating the need for manual interventions. Some primary characteristics of MongoDB Atlas include:
Managed Service: MongoDB Atlas offloads the tasks of installation, configuration, maintenance, and scaling from the user, making it a go-to option for those who want to focus more on database operations and less on administration.
Platform-Agnostic: While MongoDB Atlas operates seamlessly on AWS, it is also available on other cloud platforms, including Google Cloud Platform (GCP) and Microsoft Azure. Users can choose their preferred cloud provider and region.
Security: MongoDB Atlas comes with built-in security measures, including end-to-end encryption, VPC peering, and enterprise-grade authentication mechanisms.
Automated Backups: Atlas provides continuous backups with point-in-time recovery. This means you can restore your data to any second in the past without significant downtime.
Performance Insights: MongoDB Atlas offers real-time monitoring and alerts. Users can gain insights into queries, resource utilization, and other metrics directly from the Atlas dashboard.
Migrating MongoDB to Atlas on AWS
Here are the high-level steps involved in migrating a self-hosted MongoDB database to MongoDB Atlas on AWS Cloud. For more details, see Amazon’s prescriptive guidance.
Step One: Discovery and Assessment
The first phase involves understanding your current MongoDB setup and preparing for the migration. Begin by evaluating your existing MongoDB environment, including the database size, configuration, and performance metrics. This assessment will help you determine the right size and configuration for your MongoDB Atlas cluster on AWS. It’s also crucial to analyze your application’s dependencies on the database to understand how the migration will impact your application.
During this phase, you should also identify any potential challenges or limitations that might arise during migration. These could include compatibility issues, data integrity concerns, or performance implications. By addressing these issues upfront, you can mitigate risks and plan for a smoother migration.
Step Two: Configure Security and Compliance
Security and compliance are paramount in any migration process. Start by configuring the network settings in MongoDB Atlas to ensure secure connectivity. This typically involves setting up VPC peering or AWS Direct Connect between your AWS environment and MongoDB Atlas.
Next, focus on configuring the security features in MongoDB Atlas. These include setting up encryption at rest and in transit, identity and access management, and auditing and monitoring features. Ensure that these settings align with your organization’s security policies and compliance requirements.
It’s also vital to understand the shared responsibility model in AWS and MongoDB Atlas. While MongoDB Atlas manages the security of the cloud, you are responsible for security in the cloud, which includes securing your data and controlling access.
Step Three: Migrate Data
With the preparations complete, you can start migrating your data to MongoDB Atlas. MongoDB Atlas offers a live migration service, which allows you to migrate your data with minimal downtime. To use this service, you will need to provide details about your source MongoDB environment and initiate the migration through the MongoDB Atlas interface.
Monitor the migration process closely to ensure that the data is transferred accurately and efficiently. It’s advisable to perform validation checks during and after the migration to ensure data integrity. Also, be prepared to address any issues that arise during this phase promptly.
Step Four: Configure Operational Integration
Once your data is migrated, the next step is to integrate MongoDB Atlas into your operational processes. This involves updating your application configuration to point to the new MongoDB Atlas cluster. You will need to update your application’s database connection strings and test the application thoroughly to ensure it is interacting correctly with MongoDB Atlas.
Additionally, configure monitoring and alerting in MongoDB Atlas to keep track of your database’s performance and health. MongoDB Atlas provides various tools and metrics that can help you monitor your database effectively.
Finally, consider implementing any necessary changes to your backup and recovery procedures. MongoDB Atlas offers automated backup solutions, but you should align these with your data protection policies and test your backup and recovery process to ensure it meets your requirements.
Conclusion
In conclusion, running MongoDB on AWS offers a combination of flexibility, scalability, security and robust backup and disaster recovery options. By leveraging AWS’s diverse infrastructure, you can tailor your MongoDB environment to meet specific workload demands, be it compute, memory, or storage-centric requirements.
The migration process to MongoDB Atlas on AWS involves discovery and assessment, configuring security and compliance, data migration and operational integration. By following this process, organizations can effectively migrate and optimize their MongoDB deployments in the AWS Cloud, reaping the benefits of a fully managed, scalable and secure database environment.
As we close out 2023, we at devopsy.kinsta.cloud wanted to highlight the most popular articles of the year. Following is the latest in our series of the Best of 2023.
Welcome to The Long View—where we peruse the news of the week and strip it to the essentials. Let’s work out what really matters.
This week: Amazon Prime Video has ditched its use of microservices-cum-serverless, reverting to a traditional, monolithic architecture. It vastly improved the workload’s cost and scalability. (more…)
Bitrise this week will tighten integration with its DevOps platform for building and deploying mobile applications and the application development services provided by Amazon Web Services (AWS) cloud.
Announced at the AWS re:Invent 2023 conference, the goal is to provide easier access to automated building, testing and release management capabilities provided by AWS as part of an effort to increase overall efficiency.
Bitrise CEO Barnabas Birmacher said those capabilities will streamline workflows for a Bitrise Mobile DevOps platform that has been specifically designed for building and deploying mobile applications that typically need to be updated frequently.
Based on a continuous integration/continuous delivery (CI/CD) platform developed by Bitrise that can be deployed in an AWS cloud computing environment, the integrations will make it simpler to build and run mobile applications at scale, noted Birmacher.
The goal is to reduce the total cost of building mobile applications while at the same time improving developer productivity for mobile applications that have to be thoroughly tested before being made accessible via an application store, he added.
It’s not clear how many organizations will prefer to have a dedicated CI/CD platform for building and deploying mobile applications versus using the same CI/CD platform they might already be relying on to build and deploy other applications. Bitrise claims to have more than 6,000 customers, including Reddit, WISE, Equinox and Philips Hue.
As the percentage of mobile applications that make up an organization’s portfolio continues to increase, the pace at which those applications need to be updated lends itself better to a CI/CD platform optimized for those types of applications, said Birmacher.
In fact, a recent survey conducted by Bitrise found 62% of respondents have been adversely impacted by manual processes that slowed the rate at which mobile applications were deployed and updated. The survey also found (44%) of respondents reported their release approval process is mostly or entirely manual, with only 9% having fully automated application releases.
The survey also found that nearly two-thirds of organizations (66%) have deployed applications that can’t be opened in two seconds or less, which is widely considered the accepted level of performance required for mobile applications. In addition, three-quarters of organizations (75%) required more than two days to address bug fixes.
Many mobile apps have become increasingly mission-critical thanks to digital business transformation initiatives. Consequently, the amount of focus on them within most organizations is high; any issues that arise are likely to be noticed at the highest echelons of an organization. That level of attention can easily put pressure on DevOps teams, mainly because the general expectation among end users is that mobile applications will be regularly updated with new functionality. However, if release processes are largely manual, regularly improving the user experience can become problematic.
Each IT organization will need to decide for itself how best to go about building and deploying mobile applications, but the one thing that is certain is adjustments to DevOps workflows will need to be made as a lot more of these applications are continuously built, deployed and updated.
MongoDB and Amazon Web Services (AWS) announced today that they have extended their existing alliance to provide examples of curated code to train the Amazon CodeWhisperer generative artificial intelligence (AI) tool.
Amazon CodeWhisperer is a free tool that generates code suggestions based on natural-language comments or existing code found in integrated development environments (IDEs).
Andrew Davidson, senior vice president of product for MongoDB, said developers that build applications on MongoDB databases will now receive suggestions that reflect MongoDB best practices. The overall goal is to increase the pace at which a Cambrian explosion of high-quality applications can be developed, he added.
Generative AI is already fundamentally changing the way applications are developed. Instead of requiring a developer to create a level of abstraction to communicate with a machine, it’s now possible for machines to understand the language humans use to communicate with each other. Developers, via a natural language interface, will soon be asking generative AI platforms to not only surface suggestions but also test and debug applications.
The challenge developers are encountering is that generative AI platforms such as ChatGPT are based on large language models (LLMs) that were trained using code of varying quality collected from across the web. As a result, the code suggested can contain vulnerabilities or may simply not be especially efficient, resulting in increased costs because more infrastructure resources are required. In addition, the suggestions that surfaced can vary widely from one query to the next.
As an alternative, AWS is looking to partner with organizations like MongoDB that have curated code to establish best practices that can be used to ensure better outcomes. These optimizations are available for C#, Go, Java, JavaScript and Python, the five most common programming languages used to build MongoDB applications. In addition, Amazon CodeWhisperer enables built-in security scanning and a reference tracker that provides information about the origin of a code suggestion.
There’s little doubt at this point that generative AI will improve developer productivity, especially for developers who have limited expertise. DevOps teams, however, may soon find themselves overwhelmed by the amount of code moving through their pipelines. The hope is AI technologies will also one day help software engineers find ways to manage that volume of code. On the plus side, the quality of that code should improve thanks to recommendations from LLMs that, for example, will identify vulnerabilities long before an application is deployed in a production environment.
Like it or not, the generative AI genie is now out of the proverbial bottle. Just about every job function imaginable will be impacted to varying degrees. In the case of DevOps teams, the ultimate impact should involve less drudgery as many of the manual tasks that conspire to make managing DevOps workflows tedious are eliminated. In the meantime, organizations should pay closer attention to which LLMs are being used to create code. After all, regardless of whether a human or machine created it, that code still needs to be thoroughly tested before being deployed in production environments.
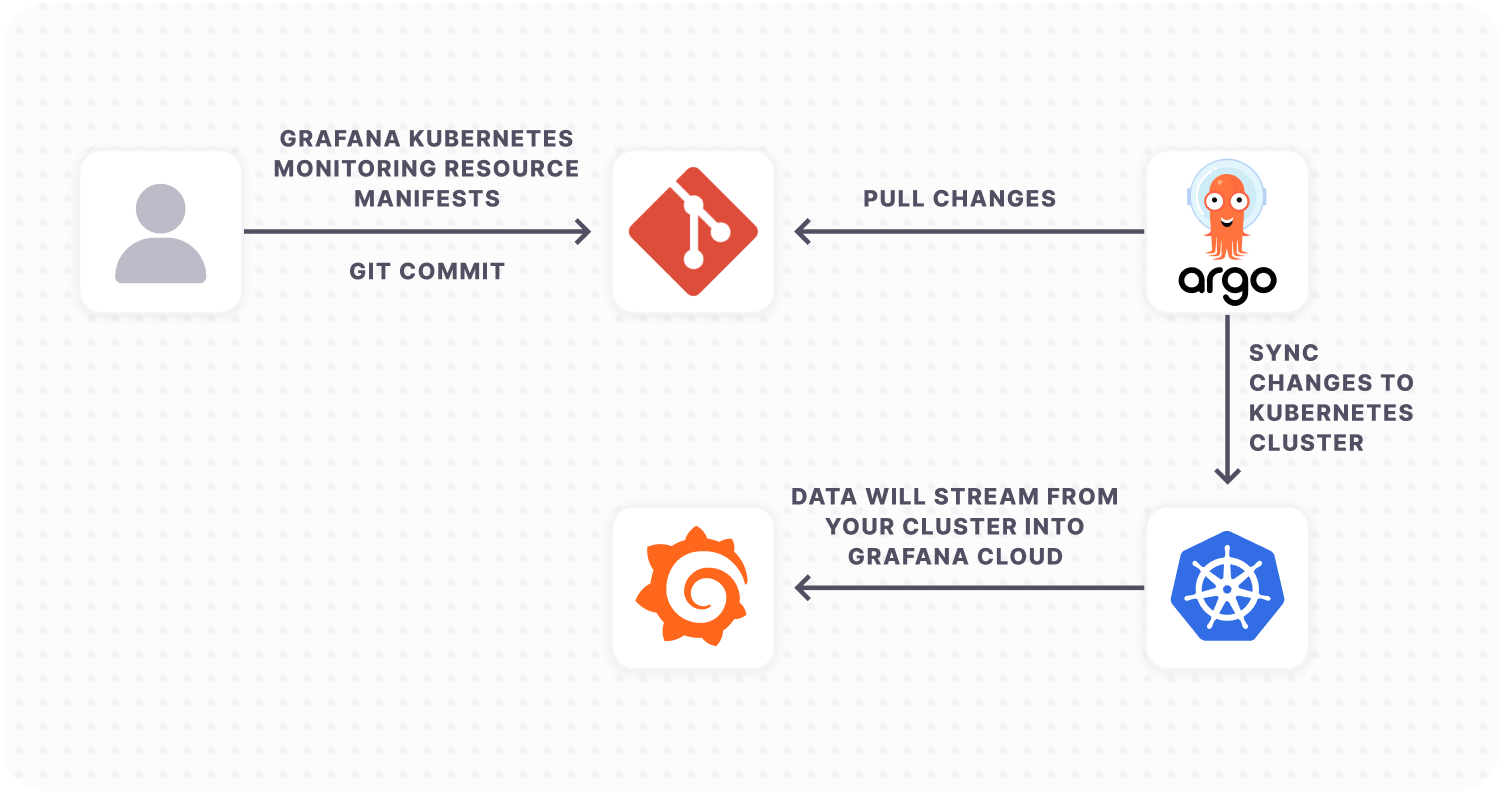
But what’s an easy way to add resources to your cluster while using Kubernetes Monitoring? ArgoCD has become the established tool for implementing GitOps workflows, simplifying the process of deploying and managing Kubernetes resources. If you are using Argo CD to manage your Kubernetes deployments, you can easily configure Grafana Cloud’s Kubernetes Monitoring solution to work with your cluster.
In this blog post, we’ll walk you through how to use Argo CD to configure Kubernetes Monitoring in Grafana Cloud.
What is Argo CD?
Argo CD is a declarative, open source GitOps continuous delivery tool that helps to automate the deployment of applications to Kubernetes clusters. It provides a centralized and standardized way of managing Kubernetes resources in large and complex environments. By using Argo CD, users can easily manage their Kubernetes resources and applications using Git repositories, allowing for version control and auditability.
Argo CD’s key features and capabilities include the ability to manually or automatically deploy applications to a Kubernetes cluster; automatic synchronization of application state to the current version of declarative configuration; a web user interface and command-line interface; and the ability to detect and remediate configuration drift. It also has role-based access control (RBAC), which allows for multi-cluster management, single sign-on (SSO) with various providers, and support for webhooks that trigger actions.
Why pair Argo CD with Kubernetes Monitoring in Grafana Cloud?
Kubernetes Monitoring in Grafana Cloud simplifies monitoring your Kubernetes fleet by:
Deploying Grafana Agent with useful defaults for collecting metrics that aid in cardinality management.
Providing custom queries to collect useful logs.
Offering preconfigured dashboards, alert rules, and recording rules for users to plug into their existing infrastructure.
But there is some manual effort required to deploy the necessary resources for Kubernetes Monitoring in Grafana Cloud. Users have to copy the configurations and run the commands, which are outlined in Grafana Cloud. While easy enough to do, this process can quickly become error-prone, especially in larger, more complex environments where multiple teams may be deploying resources across multiple clusters. Plus each change must be verified and deployed to each cluster by hand.
As a result, GitOps tools like Argo CD can help to automate Kubernetes resource deployment. Argo CD takes a declarative, GitOps approach to Kubernetes resource management, allowing for automated and standardized deployments across multiple clusters. This method not only saves time, but also reduces the risk of deployment errors and inconsistencies.
There are three key advantages to deploying Kubernetes Monitoring with Argo CD:
You’ll use a GitOps-based approach to manage resources required by Grafana Cloud’s Kubernetes Monitoring solution.
It’s easier to make changes in a controlled environment to Grafana Agent configuration and resources.
The Git repository would be maintained as a single source of truth for your Kubernetes resources.
Prerequisites for configuring Argo CD with Grafana Cloud
Before you begin, make sure you have the following available:
Argo CD installed and running in your Kubernetes cluster
Metrics and events: Deploy Grafana Agent ConfigMap and StatefulSet
Create Grafana Agent ConfigMap
Note: The default scrape interval is set to 60s. Scrape intervals lower than 60s may result in increased costs (DPM > 1). To learn more, see our documentation on active series and DPM.
Replace
${NAMESPACE} with your namespace
${METRICS_USERNAME} with Prometheus Instance ID
${PROMETHEUS_URL} with the push endpoint URL of the Prometheus Instance
${LOGS_USERNAME} with Loki Username ${LOKI_URL} with the push endpoint URL of the Loki Instance
${GRAFANA_CLOUD_API_KEY} with your Grafana Cloud API Key
Paste the following script into your shell and run it to create the metrics Agent ConfigMap configuration file.
This ConfigMap configures the Grafana Agent StatefulSet to scrape the cadvisor, kubelet, and kube-state-metrics endpoints in your cluster. It also configures Grafana Agent to collect Kubernetes events from your cluster’s control plane and ship these to your Grafana Cloud Loki instance. To learn more about configuring Grafana Agent, see our Grafana Agent configuration reference docs.
Create Grafana Agent StatefulSet
Replace ${NAMESPACE} with your namespace and paste the following script into your shell and run it to create the configuration file for metrics Grafana Agent StatefulSet.
kube-state-metrics watches Kubernetes resources in your cluster and emits Prometheus metrics that can be scraped by Grafana Agent. To learn more, see the kube-state-metrics docs.
Replace ${Argo CD_NAMESPACE} with your namespace in which Argo CD is deployed and ${NAMESPACE} with the namespace where you want to deploy Kubernetes Monitoring resources. Then paste the following script into your shell and run it to create the configuration file for kube-state-metrics Argo CD application.
Node_exporter
Node_exporter is used to collect host metrics from each node in your cluster, and emits them as Prometheus metrics.
Replace ${Argo CD_NAMESPACE} with your namespace in which Argo CD is deployed and ${NAMESPACE} with the namespace where you want to deploy Kubernetes Monitoring resources. Then paste the following script into your shell and run it to create the configuration file for node_exporter Argo CD application.
Logs: Deploy Grafana Agent ConfigMap and DaemonSet
Create Grafana Agent ConfigMap
Replace
${NAMESPACE} with your namespace
${METRICS_USERNAME} with Prometheus Instance ID
${PROMETHEUS_URL} with the push endpoint URL of the Prometheus Instance
${LOGS_USERNAME} with Loki Username
${LOKI_URL} with the push endpoint URL of the Loki Instance
${GRAFANA_CLOUD_API_KEY}
Paste the following script into your shell and run it to create the logs Agent ConfigMap configuration file.
Replace ${NAMESPACE} with your namespace and paste the following script into your shell and run it to create the configuration file for Logs Grafana Agent DaemonSet.
The ideal setup is to have changes that are made to the main branch of your Git repository automatically synced within Kubernetes. To achieve this, follow the steps below:
Create a folder in your Git repository (For this post, let’s create a folder named kubernetes-monitoring).
Push all the manifest files for earlier steps (metrics.yaml, metrics-agent.yaml, kube-state-metrics.yaml, node-exporter.yaml, logs.yaml and logs-agent.yaml) into the newly created folder.
Argo CD application setup
ArgoCD New App web interface.
In the Argo CD web interface, click on the New App button. Enter a name for the application, such as grafana-kubernetes-monitoring, and select the your desired project name (if there is none, select default) and sync policy as automatic. Select Prune Resources and Self Heal options to ensure configuration in Git Repository is always maintained within the Kubernetes cluster. Also tick the Auto-Create Namespace option and the Retry options.
Under Source, enter the URL for your Git repository along with the revision (by default it is HEAD). Set the path to the folder (kubernetes-monitoring).
Under Destination, enter your cluster URL. If it’s the same cluster where Argo CD is deployed, use https://kubernetes.default.svc and the namespace for creating the application resource. The namespace should be the same as the one where Argo CD is deployed.
Select Directory Recurse as its useful when having configuration files within nested folders
Finally, click on the Create button to create the application.
You can also run the below command to create the Argo CD application that monitors your Git Repository folder for changes. Make sure to replace ${GIT_REPO_URL} with your Git Repository URL; ${Argo CD_NAMESPACE} with your namespace in which Argo CD is deployed; and ${NAMESPACE} with the namespace where you want to deploy Kubernetes Monitoring resources.
Once the application has been created, the Kubernetes manifest defined in the Git repository will be automatically deployed.
Install prebuilt Grafana dashboards and alerts
Note: You must have the Admin role to install dashboards and alerts in Grafana Cloud.
Navigate to your Grafana Cloud instance and in the navigation menu, select Kubernetes under the Monitoring section.
Go to the configuration and click on Install dashboards and alert rules.
The configuration has been already completed, so you can now start viewing dashboards.
Once the metrics and logs from your Kubernetes cluster are being ingested into Grafana Cloud, you can:
Easily navigate around your Kubernetes setup using a single UI. Begin with a cluster view and drill down to specific Kubernetes pods with the preconfigured Grafana dashboards.
Use node observability. Find out more about node health along with pod density and node logs.
Use the cluster efficiency dashboard. Understand your resource usage and use the information for capacity planning and optimizing costs and efficiency.
Stay on top of your cluster. Use the preconfigured Grafana alerts to monitor your fleet.
Next steps for monitoring Kubernetes clusters with Grafana Cloud
Once you have settled into your new Argo CD configuration, you can continue to expand on your observability strategy with Kubernetes Monitoring in Grafana Cloud.
You can leverage the latest integrations available within the Kubernetes Monitoring solution such as Cert Manager, CockroachDB and more. To configure scraping application pod metrics, you can refer to our detailed documentation. And while Kubernetes Monitoring currently covers metrics and logs, to get a complete timeline into data transactions, request durations, and bottlenecks, it is also important to use traces. You can configure your applications to send traces to Grafana Agent, which can then be configured to send that tracing data to Grafana Cloud’s hosted tracing instance.
The easiest way to get started with Kubernetes Monitoring is with Grafana Cloud. We have a generous free forever tier and plans for every use case. Sign up for free today!