Tag: application performance testing

  • 5 Testing Strategies For Deploying Microservices

    5 Testing Strategies For Deploying Microservices

    With rigorous development and pre-production testing, your microservices will perform as they should. However, microservices need to be continuously tested against actual end-user activity to adapt the application to changing preferences and requests. This article will cover five deployment strategies that will help developers and DevOps teams when releasing new features or making changes to microservices-based applications.

    Always Test in Production

    A staging environment is a necessary but insufficient step toward building a robust microservices infrastructure. Although indicative, it is not a substitute for evolving user traffic and behavior. When real users interact with the software during production, the services may not perform as efficiently.

    Users are unpredictable. They may make requests you have not accounted for when drawing up communication paths. Or your microservices architecture may not sustain the actual production traffic. When testing with real end-users, you are sure of your software’s performance and can improve it or add new functionality. 

    The disadvantage of working with real users is that they will be impacted by any errors. However, with specific deployment strategies, you can identify the issues and minimize their impact on those users. 

    Depending on your goals, you can implement the following testing strategies in the deployment stage. They can be performed individually or in various combinations, as each approach varies in its contribution to deployment.

    Blue-Green Deployment

    A blue-green deployment uses two distinct yet identical production environments. For example, you deploy an inactive version of your application in the blue environment. At the same time, the latest version available to end users runs in the green environment. Next, you push code to add new functionality to the blue environment. 

    At this stage, you test the services in the blue environment to ensure that they are running smoothly. You can automate this process by using basic smoke tests. When the microservices pass these tests, you can instruct the load balancer to gradually redirect user traffic to this new environment.

    If the new functionality poses no problems, the router moves all traffic from the green to blue environment, but can immediately revert traffic in case of any errors. 

    Due to the identical nature of both environments and their reliance on each other, there is little to no downtime. The end user’s experience is largely unaffected and the developers can move quickly to fix any bugs.

    The old environment serves as a backup, making it possible to execute a rollback without any downtime. After releasing the latest version, you can decide to kill the old instances, but only after you are confident that the new environment will continue running without errors. You can also clone both blue and green environments to repeat the process with other feature deployments in the future.

    Canary Deployment

    Canary deployment is similar to blue-green testing in that it protects against release-related risks.

    The phrase “canary deployment” originates from an old mining practice of placing caged birds in mine shafts to detect the presence of harmful gases. If present, the gases would kill the canary before affecting the miners, thus providing an early warning to vacate the mine immediately.

    A canary deployment works on a similar principle. Instead of creating two separate environments, a canary deployment operates within the same microservice or infrastructure. The developers roll out a new service or application version with changes only to a fraction of the end-users.

    You can quickly detect errors or vulnerabilities while using the new service. The impact is temporary and minimal as the experiment is only run on a subset of users with most remaining unaffected. Once they are working and have passed verification, you can scale up the changes. 

    The biggest challenge for those running canary deployments is the requirement to run multiple versions of the same microservices so that they can be deployed to a few users at a time. Implementing multiple versions also means you need to keep track of which users are on which versions to run accurate business metrics and analytics. Such monitoring can get increasingly complex with multiple canary deployments within the same application.

    Feature Flags

    A feature flag or feature toggle is a change or feature written inside conditional code. Developers can turn the feature on or off depending on their testing requirements while the application is running and in use.

    The code is already deployed and there are two code paths: One with the code that implements the feature and one without it. The developer only needs to choose one of the two paths. When the switch is toggled on, the code chunk is executed as part of the flow. When switched off, that code is skipped and the feature is not implemented. The rest of the source code continues to run as usual, independent of the feature flag’s condition, with no disturbances in the end user’s experience.

    Once integrated, a feature flag allows you to turn on a feature for a select group of users. Unlike a canary deployment where the selection is random, feature toggles are usually employed in specific cases. For example, developers do not create two separate applications to implement free and paid subscription tiers. Instead, operating a feature flag allows you to make a particular feature accessible only to subscription users.

    Feature flags are especially attractive during testing as developers can use them to run small experiments throughout the application without relinquishing control. Being able to flip the switch remotely also makes rollbacks easier. The risk is negligible as the application is self-sufficient in that it can continue to run without the feature. 

    Feature flags generate complex user-to-service paths by way of permutations and combinations. For a specific user, it is difficult to determine the exact route they took when using the services. Feature flags complicate this by allowing each user to have a different experience, ultimately making the application hard to debug. These toggles are easy to get started with minimal risks, but their maintenance can quickly become complex. It is best to use them only when needed and with other deployment strategies.

    Traffic Shadowing

    With traffic shadowing or mirroring, the router duplicates incoming traffic to an already-released service and gives the copy to another service. The request and response mechanism between the user and the existing service remains intact. On the other hand, the second service with a copy of the traffic contains new features that require testing. Consequently, it does not interfere with the existing process. Instead, the copy is used to test its functionality.

    Its most significant benefit is that it allows the new version to receive the same traffic that is currently being received by the service it seeks to replace. There is no need to create test data or worry about replicating scale. This accuracy comes with little risk, as there is no tangible impact on the existing services. Developers can run all relevant tests on this production environment, such as testing for errors and performance metrics. The new version’s responses, which are not sent to users, can also be compared to those of the production service. Both versions operate independently of each other with different end goals. This can happen in real-time or a copy can be saved and replayed for future testing.

    Traffic shadowing can be used with other deployment techniques like blue-green or canary deployments. After successfully shadowing a production environment, the changes can be rolled out gradually using a canary deployment to gain maximum confidence before a full release.

    Shadowing can have unintended consequences, though, so you should exercise caution when deploying this strategy with services that have third-party dependencies. 

    A/B Testing

    Unlike blue-green and canary deployments, A/B testing is focused on user perception and experience of new features. It measures if and how end users are interacting with these features, whether they are easy to notice and use and gauges the application’s overall functionality. It provides developer teams with business-level insight to improve their application as the features are ultimately implemented using code.

    A/B testing divides users into groups that access different features. Group A, for example, sees a different user interface than group B, although members in both groups are making the same requests to access the application. Traffic is routed to separate builds or different configurations on a common build. This is done by considering aspects like the users’ operating systems and user agents. It must be run on a sample that is representative of your end users. The test also needs to display statistically significant results to be valid.

    This test can be combined with blue-green or canary deployments as they handle the actual feature deployments that this strategy tests. After comparing the versions shown to the groups, the one that has performed better can be pushed to release for all users. 

    Building your Deployment Strategy

    Each strategy outlined can be used independently or together in a combination that best suits your goals, workflow and microservices requirements. They allow you to identify and reduce the impact of any vulnerabilities that may only surface at the final stage of your software’s release. Implementing them can be a somewhat complex process, especially with larger architectures and dependencies. But by implementing any of these strategies, your team will release the best possible version of your application. 

  • Compuware Shifts Mainframe App Testing Left

    Compuware Shifts Mainframe App Testing Left

    Compuware today announced it is making it easier to shift application performance testing further left on to the shoulders of developers by adding support for a REST application programming interface (API) to its application performance management (APM) platform for mainframe applications, along with a plug-in for Jenkins continuous integration/continuous delivery (CI/CD) environments.

    Sam Knutson, vice president of product management for Compuware, said during the current economic downturn brought on by the COVID-19 pandemic, organizations will find it is now more imperative to shift more responsibility for managing all aspects of application development toward developers. Many organizations simply won’t be able to afford to retain IT specialists such as application testers, said Knutson.

    Instead, most organizations soon will be looking to automate as many aspects of DevOps as they possibly can with an eye toward enabling developers to achieve goals with as little intervention as possible from IT operations teams, he noted.

    In addition, Knutson said the trend of convergence between mainframe and distributed computing teams within IT organizations is about to accelerate. In fact, there may soon be no such thing as “mainframe DevOps,” he noted; rather, the mainframe will be just another mainstream platform on which applications are deployed.

    The economic downturn may limit the number of new mainframes being deployed. However, given that the total cost of computing on the mainframe tends to be lower than distributed systems, the number of workloads running on existing mainframes could increase as organizations deploy more Linux-based applications on the venerable platform.

    The API Compuware is adding to its Strobe APM platform will help accelerate the development and deployment of those applications by making application testing a more integrated element of a DevOps workflow, said Knutson. Automated tests can be run within the code delivery pipeline using Compuware Topaz for Total Test, the Topaz Utilities plugin or Compuware Hiperstation. Development teams can be notified when performance tests are completed via communications tools such as Slack and Microsoft Teams.

    Knutson said Compuware decided to build a plug-in for Jenkins because it is the most widely deployed CI/CD platform in mainframe environments.

    Despite the pending merger with BMC Software, IT organizations can count on the fact that the Compuware portfolio of DevOps tools for mainframe environments will continue to be supported and updated, he said, pointing out that this latest announcement represents the 22nd consecutive quarterly update to the Compuware portfolio of DevOps tools for mainframes.

    It’s too early to say what precise impact the economic downturn may have on DevOps adoption in mainframe environments. However, it’s safe to say that doing more with less is going to be the order of the day for some time to come. As such, the rate at which IT organizations that rely on mainframes to run their mission-critical applications will be embracing best DevOps practices is likely to increase.

    In fact, rather than incurring the costs of replacing those mainframe applications the priority now is much more likely to be modernizing them as much and as soon as possible.

    — Mike Vizard

  • Avoid Crashes: 5 Best Practices for Load Testing

    Avoid Crashes: 5 Best Practices for Load Testing

    Demanding customer expectations and the rapid distribution of information across social media have made website and applications crashes an off-limits path for today’s companies and organizations.

    Crashes resulting from traffic spikes cause immediate and long-term loss of sales, as well as tarnishing the brand name. When servers or websites go down during highly anticipated events such as Black Friday, the Big Game or before a major concert, the repercussions can be permanent.

    Yet, avoiding the “website temporarily unavailable” screen is also easier than ever before. By performance testing your website continuously and proactively you can easily detect errors, bottlenecks and bugs, and then fix them to ensure your website handles any amount of traffic.

    Here are five best practices for load testing your website or app:

    Define Your Load Goals

    Before starting your tests, you need to figure out what it is that you need to test.

    This includes the number of concurrent users, traffic patterns and areas that users can visit on your site. For example, if your site has 10,000 users concurrent at its peak, but  3,000 arrive in the morning and that total slowly climbs up to 10,000 in the afternoon—and these visitors mostly just browse your homepage—you’ll need to run a different test than if you have 10,000 concurrent users on your website all day long, constantly browsing multiple pages.

    To determine your load goals, you need to engage directly with your business colleagues. For instance, get your product manager to set the system’s expected abilities, ask the marketing team to inform you about any special campaigns that might increase website traffic, and then look at server logs and tools such as Google Analytics to determine previous customer patterns.

    Choose Your Load Testing Tools

    There are multiple open-source load-testing tools that you can use to run your tests.

    JMeter is the most popular tool, but you can also use Gatling, Locust, Tsung, The Grinder or Selenium. See here to learn more about the differences between these toolsets.

    Does this seem complicated? Taurus is an open-source automation test framework that simplifies running these tools, by using a simple YAML script. If you need to run your tests from the cloud, utilizing rich analytics or requiring user collaboration, you might consider using BlazeMeter.

    Take Your System to the Limit

    To make sure you stand up to your load goals, you need a buffer; specifically, you need to make sure that your system can handle heavier loads.

    This ensures that the CPU stays low and you don’t experience memory leaks. However, we also recommend you take your system to the limit and see when and how it fails. This ensures that you know exactly what your system’s weaknesses are, giving you a better ability to fix any errors that might occur.

    This is especially important if you come across an unexpected traffic spike—say, if your competitor’s website crashes and all their customers come running to you. Wouldn’t you rather be prepared for that?

    Monitor Test Results

    Set aside resources for looking at test results.

    Examine KPIs including Response Time and Hits/s, as well as the correlations between them, to learn what your system’s abilities and bottlenecks are. This information will help you see what needs fixing.

    As you continue testing over time, you will be able to identify KPI trends, which will help you monitor system health. We also recommend you monitor backend KPIs like DB Queries, with APM tools.

    Test Again

    So, you’ve tested, you’ve analyzed, and you’ve fixed.

    Now you have one last thing to do: Run your tests again to make sure everything is working smoothly after the committed changes. That ensures nothing gets overlooked. It would be a shame if all your hard work went down the drain due to a minor oversight.

    Now, let’s get testing!

    To get more load testing tips, check out this free whitepaper, “How to Ensure Your Website or App Won’t Fail at Peak Times.” To learn more about BlazeMeter, request a demo.

    — Noga Cohen

  • 4 Top Tips for Developing a New Feature

    4 Top Tips for Developing a New Feature

    As a backend developer at CA BlazeMeter, I recently had the chance to work on a big feature for our web app. The feature required a massive change on our backend code, a big change on our frontend and multiple migrations. You know what I’m talking about—it was one of those projects that developers fear.

    But, I gained a lot of valuable experience from the project. Not only did we deliver a kick-ass feature, I also learned the importance of teamwork and patience when developing something new. Armed with those two values, and the right tools and technologies, you can deliver a new feature quickly and efficiently.

    Here are a few more things that I learned that should prove helpful whether you’re developing a major feature or one that only requires a minor code change.

    Tip 1: Plan to understand the development requirements

    The process of development starts way before you start coding, with planning. After the product manager decides what needs to be developed, R&D needs to understand the cost: how many days (or weeks) of development the feature will take, how many people will be needed and which APIs are required.

    To do that, the product manager needs to conduct at least three “grooming” sessions with backend, frontend and QA leaders. The grooming sessions start with the product manager presenting the product flow and requirements.

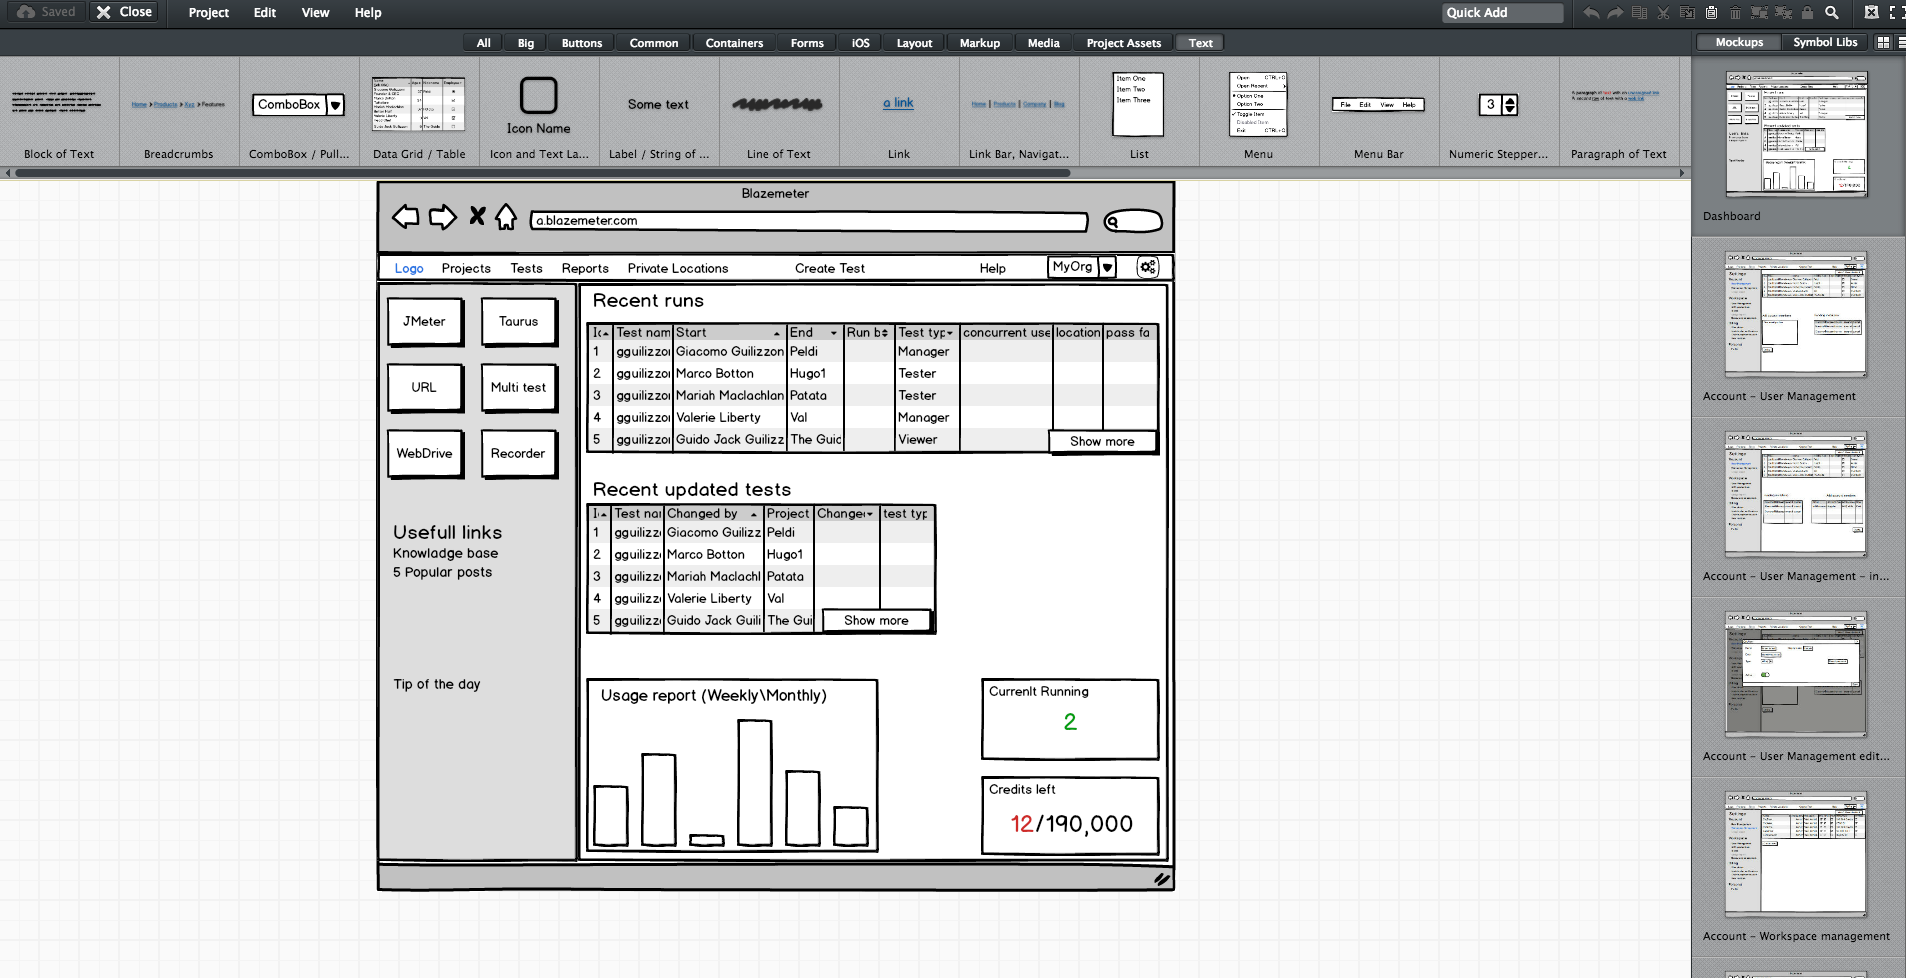
    Since no one wants to read a lot of text (except perhaps the awesome readers of this article), the product manager should prepare mockups. They don’t have to be designed or colorful, but they do need to show the team what the feature looks like in his or her vision. During our grooming sessions, we used Balsamiq, which lets you create screen sketches for how the product is supposed to look, feel and work.

    Editing screen sketches using Balsamiq

    After the initial presentation, the sessions should include a lot of open discussion—asking questions, checking for answers and examining compliance, etc. —until everyone is satisfied and understands what the feature requires from them and from others.

    This is the time and place for frontend, backend and QA to give their opinion about the schedule and to alert and flag any potential problems in development or extreme use cases. It’s the role of the product team to answer questions and change the flow and requirements until there are no R&D rejections.

    Afterward, the frontend and backend leaders need to create a feature development plan, sitting down to determine what data they need to transform the product vision into a real thing. Or in other words, which APIs are required for each flow or button, how long each step is supposed to take, including buffers, and the order of development. APIs are the agreed “contract” between the development teams. After determining the contract terms, each team can proceed individually.

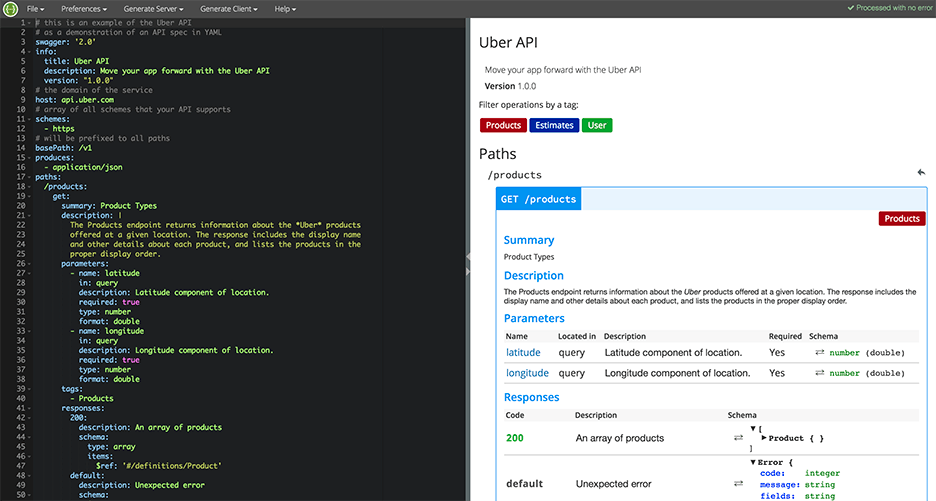
    I recommend you write your APIs in Swagger, which turns YAML files into detailed HTML pages with all the APIs.

    Swagger Editor

    This plan needs to be transparent to everyone working on the project. In fact, it’s even better if each project participant can add and describe scenarios. Tools such as TestLink and Atlassian do just that. Then, when the code is ready, developers can go over the list and see everything is covered.

    We will need to stick to this schedule later on, especially when new demands unrelated to the feature come in, such as fixing bugs. Sticking to this plan is the best way to distinguish the wheat from the chaff of the development process.

    Start writing automation ASAP

    After planning, we want everyone to start working, and not only the backend. To do that, the backend can prepare mocks, either through outsourcing services such as JSON servers, which show inputs and outputs, or by writing dummy code.

    I mentioned earlier that we used Swagger to write APIs. We also used it to generate a server in NodeJS/Python, like this:

    Generating a JSON Server through Swagger

    From this moment on, frontend can begin writing and building screens and QA can start writing API automated testing, by using tools suh as JMeter. At this point, frontend and QA have the response codes and response bodies; they know which features to put where; and which APIs they need and how to use them.

    QA also know which data they’re missing, such as field names and field data. Sure, the backend code isn’t ready yet and all of the automated exams will return “red” instead of “green,” but the main issue is making sure everyone is as prepared as possible.

    This includes load and performance testing. You can use open-source tools such as JMeter, which is enhanced by CA BlazeMeter. By uploading our test script into, configuring the number of virtual users and ramp-up time, determining geo-locations to test from and analyzing KPIs to determine trends and the health of our system, we can ensure our product is delivered to our customers without crashing.

    This is also true about sending code to QA: Developers should test their code themselves and ensure that when they commit their code, it works 99.9 percent of the time.

    By starting automation as soon as possible, you can minimize future bottlenecks in the development process.

    Ensure the team communicates and works together

    Like I said before, teamwork is the most basic requirement when creating a new feature. This is because new questions arise during development and because requirements change. Therefore, everyone in the team needs to be in sync all the time, from the product manager and the designer to the developers and QA.

    Open communication lines are crucial because everyone is working on the same product at the same time, but each developer or QA should be working on a different part of the product and on different functionalities. Communication ensures each person’s work is compatible with the rest of the team’s work. This saves time, prevents frustration and redundancy and ensures maximum professionalism.

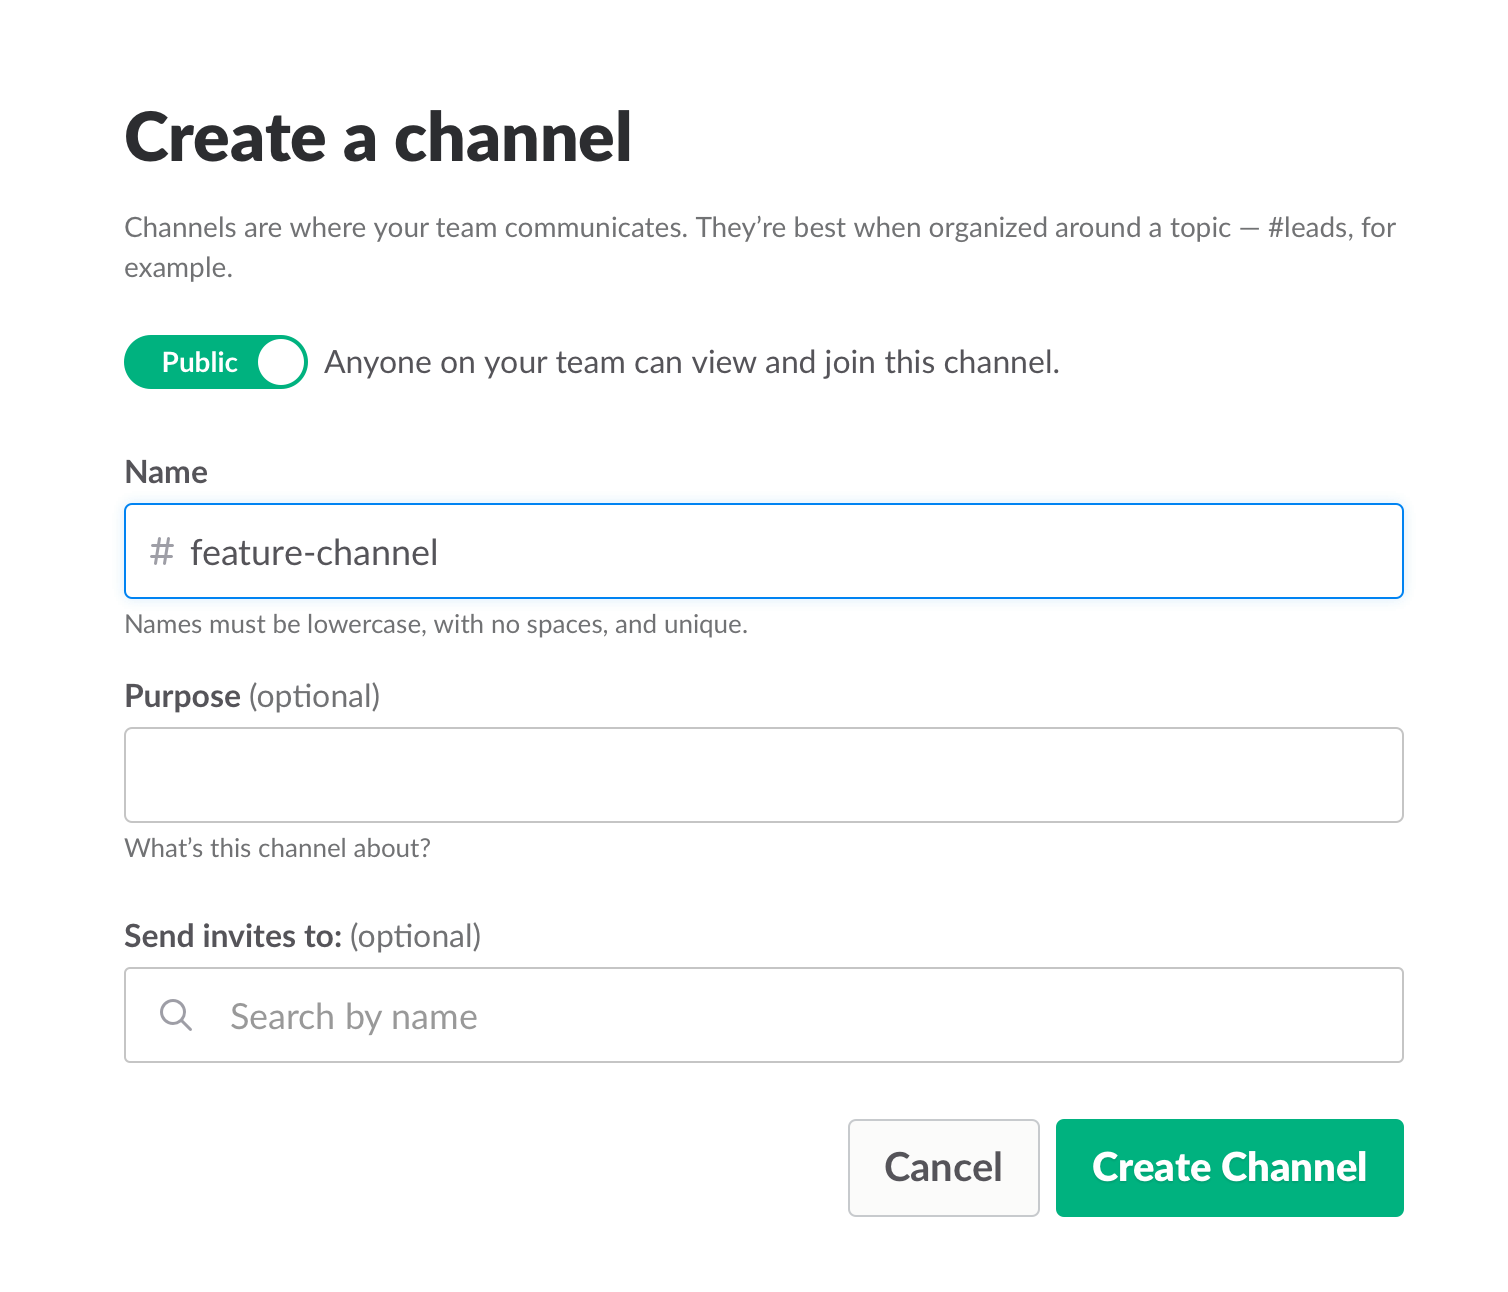
    To make sure everyone knew what was happening, we used Slack and opened a dedicated channel for the creation of this feature. We also had daily (short!) standups where we discussed what we have and what is missing.

    Opening a Slack channel

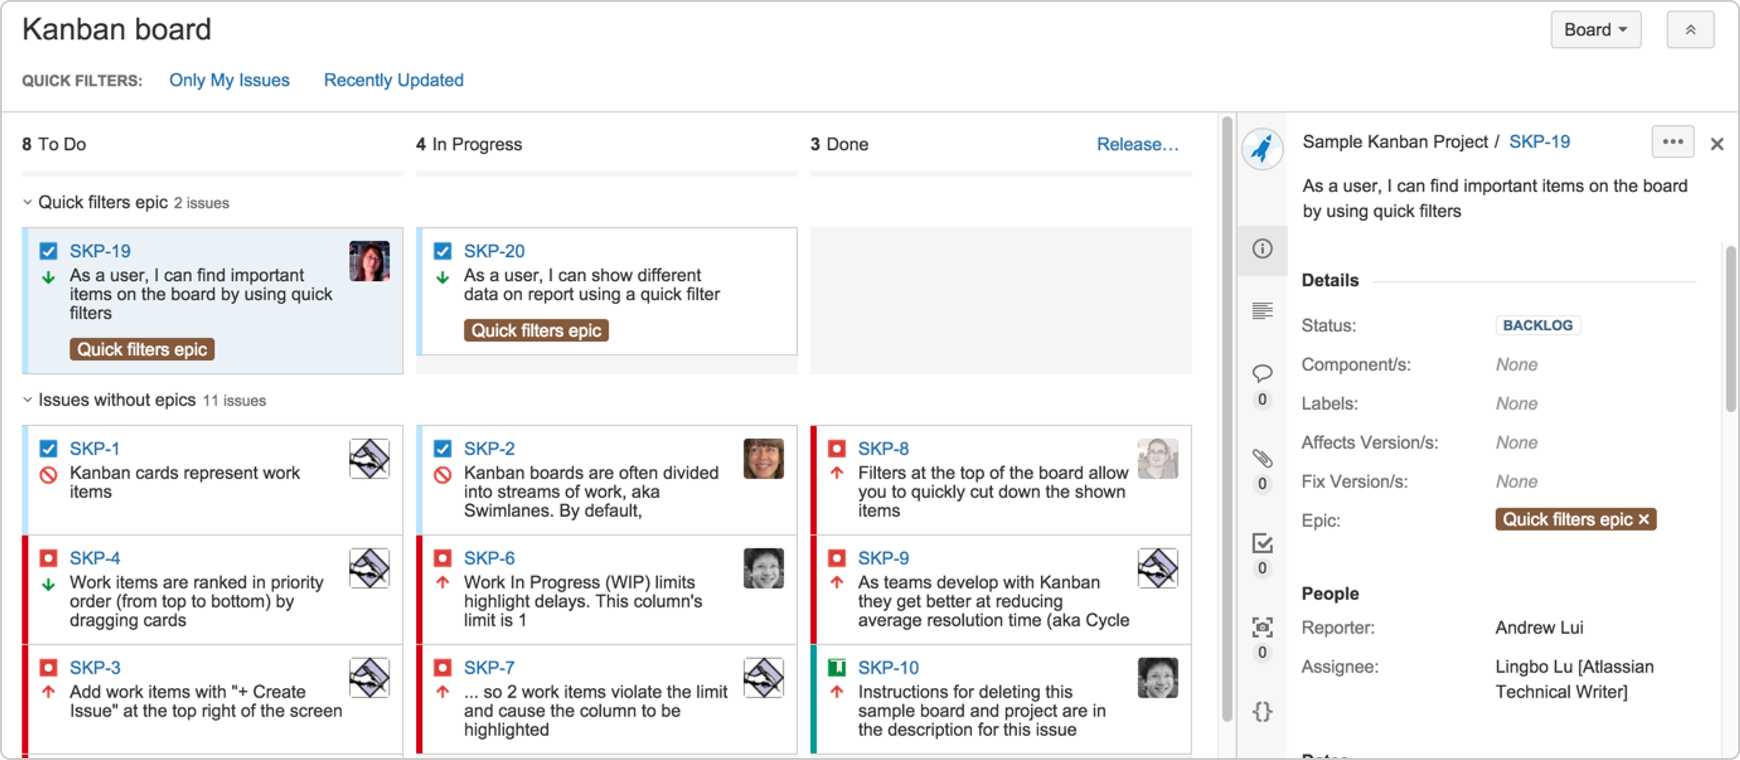
    Communication also includes team and assignment management. JIRA, our primary issue tracking tool, offers Kanban-style, Scrum and fully customizable boards, which show the progress of each development task, including the developer assigned to it, and his or her exact status or phase.

    This helps you understand what other people are working on, and just as importantly, where people are stuck. If you can, get everyone to work in an open space and put a large screen in the middle of it. This lets you stay in sync at all times.

    We used JIRA to open and manage bugs as well. This was helpful when multiple QAs found the same bug. It’s important to carefully choose which tickets are opened and put them under one epic, so everyone stays focused.


    JIRA Dashboard

    Another important aspect of communication is ensuring everyone uses the same terminology, as sometimes people might use the same term to describe different things or different terms to describe the same things. To prevent mixups that could waste your time, make sure everyone is on the same page. For example, do you say “system admin” or “<name (ex. BlazeMeter)> admin”?

    Work on the same development environments

    It’s important that everyone works on identical development environments and even on the same version of the tools and libraries. Otherwise, it could cause an (in)compatibility mess, including a lot of unnecessary back and forth and even might cause bugs to pop up. This environment needs to be as similar as possible to production, but only on a smaller scale.

    Conclusion

    Now look at the feature that came out of all that work here. I’m so grateful that I had the opportunity to work on it with an awesome team.

    I hope these best practices help you the next time you develop a new feature. Don’t forget to keep going agile after development and delivery by running tests in a continuous environment such as Jenkins for every commit.

    CA BlazeMeter works with Jenkins, ensuring you can load test in the cloud and analyze your data while shifting left. You can also use different APM tools, such as New Relic, AppDynamics and CA APM to alert you about errors before QA, which saves time.

    — Dor Atias