Tag: application deployment

  • LightStep Adds Regression Monitoring to APM Platform

    LightStep Adds Regression Monitoring to APM Platform

    LightStep this week announced it has added a Service Health for Deployments module to its namesake observability platform designed from the ground up for microservices and serverless computing frameworks.

    Talia Moyal, senior product manager for LightStep, said Service Health for Deployments will make it possible for DevOps teams to monitor performance regressions both during and after an application is deployed.

    DevOps teams can also take advantage of aggregate trace analysis functionality such as latency histogram comparisons, operations diagrams and an automated correlation engine for performing rapid root cause analysis to understand why a regression is occurring.

    Finally, a built-in instrumentation scoring capability enables DevOps teams to compare performance before, during, and after a deployment; compare latency across instances to estimate the size and scope of a regression; correlate tags that have the biggest impact on latency; and map critical path latency for each operation or service.

    As organizations embrace microservices and serverless computing frameworks, the overall IT environment becomes more complex to manage. As an application performance management (APM) platform, LightStep makes use of OpenTelemetry software to gather metrics that are then fed into a statistical engine to detect anomalies, which the APM can then record and replay. By employing OpenTelemetry, LightStep is able to employ distributed tracing to surface more context than traditional APM tools, said Moyal.

    Given the costs involved in employing APM platforms, most IT organizations historically have limited their use to their most critical monolithic applications. However, the dependencies that exist between microservices and serverless computing frameworks that make up a modern cloud-native application are now requiring IT organizations to apply APM platforms more broadly. In fact, observability is a core principle of best DevOps practices that many organizations are embracing more widely as they build and deploy cloud-native applications. Many of those applications will run just fine when initially deployed, but over time performance can degrade for a whole host of reasons that span everything from increased storage access latency to too many calls being made to the same application programming interface (API).

    Of course, there is no shortage of options when it comes to APM platforms. LightStep is making a case for OpenTelemetry because it provides a single set of open source APIs, libraries, agents and collector services to capture distributed traces and metrics. That approach makes it easier for developers to instrument their applications in a way that allows platforms such as LightStep to surface more insights into application performance. LightStep claims it has already employed that approach to analyze more than 1.4 trillion traces. OpenTelemetry is currently being developed under the auspices of the Cloud Native Computing Foundation (CNCF).

    It’s too early to say to what degree traces will supplant traditional sampling methods to analyze application performance. The one thing that is certain is as developers are held more accountable for application lifecycle management, many of them are demanding access to more sophisticated APM tools to provide the visibility they require to resolve application performance issues faster.

    — Mike Vizard

  • An Inside Look at GitOps

    An Inside Look at GitOps

    At a time when variations on DevOps abound, get ready for the latest: GitOps. This new term promises to bring some order to what can be operational chaos and empower operational teams to leverage best practices learned from their developer counterparts. It’s early days yet for GitOps, but here’s what we think you need to understand about this new facet of DevOps.

    What is GitOps?

    Everyone we spoke with has a slightly different perspective on GitOps, but this is our take: In its most basic form, GitOps is infrastructure and operational procedures defined as code, and living in a source control system, such as Git. Git becomes the single source of truth for what is running in production (or staging, or development).

    Declarative systems, such as Terraform, AWS CloudFormation and Kubernetes help enable this practice; but operations is much more than Infrastructure as Code. True operations requires a way to plan, review and approve moves, adds and changes to the infrastructure. It also requires well documented procedures, or runbooks, to be successful. This is where GitOps differentiates itself. We believe GitOps is the full operations lifecycle of infrastructure management, living as code in a git repository.

    GitOps may be used for managing both application deployments and base infrastructure made up of systems needed regardless of the applications deployed (i.e. networking, security, etc.). Both will follow the same procedures to plan, review, approve and release code into production. Done right, GitOps will let engineers constantly apply updates to infrastructure meet all the needs of the applications in a continuous delivery format. The version control system ensures everything is recorded and visible and an audit trail keeps teams compliant. GitOps will make it easy to revert problematic changes, becoming a single source of truth about what is happening in the system from both the software development and infrastructure perspective.

    What Technology is Required?

    In order to kick off GitOps, you’ll use a Git-based version control system. Then you’ll need the ability to create a declarative cloud infrastructure, using something such as Terraform and Kubernetes, with the help of Helm or Flux. Because both Terraform and Kubernetes are declarative systems, they make it simpler to create and deploy infrastructure as code in a manner that is both replicable and transparent. And you’ll also want to implement a solution such as GitLab that wraps operational procedures around these tools. GitLab, being an end-to-end DevOps solution can manage the backlog of requests, assign those requests to the appropriate subject matter expert to create the change in Git, facilitate the review and approval process, and kick off the execution of the changes using its flexible CI/CD system.

    While it is possible to achieve this sort of workflow by using different solutions to merge and ship code to Kubernetes, GitLab is certainly a straightforward path to GitOps. It allows developers and operations administrators to work from the same source of truth and with a common set of procedures and tools.

    What Are the Benefits?

    In the DevOps world, GitOps is perhaps unique in that it can potentially benefit both operations team members and developers. For starters, GitOps aims to address the sometimes cave-like nature of operations (a single person working largely in isolation) by taking all of the best practices from software development and letting them loose on the deployment side.

    Full oversight, architectural review, project management and all the other pieces of the process are brought together in GitOps in an effort to end ops versus everyone else and get all the stakeholders involved in the process. The basics don’t change–an ops engineer will still create an infrastructure–but that will just be one part of a much larger process that everyone can contribute to and collaborate on. No more worrying about an engineer creating a cloud infrastructure that can’t be replicated; with GitOps everything is tracked making repeatability easy. Suddenly it will also be simple to answer the “what changed?” question because no one will have to hunt for an answer. The bottom line is a successful GitOps program will benefit the actual bottom line because operational processes will be dramatically streamlined.

    Possible Challenges

    With any collaborative effort, change can be tricky and GitOps is no exception to that. It is usually easier to create one-offs and not follow a process, so the first thing to consider about GitOps is it will require discipline from all participants. It will be vital for teams to write everything down.

    At GitLab we live and die by this thanks to our culture of collaboration, but we know it’s not necessarily something that comes naturally to any individual or organization. It will be vital for everyone on the team to record what’s going on in merge requests and issues. The temptation to edit something directly in production or change something manually is going to be difficult to suppress, but the less “cowboy engineering” the better GitOps will work.

    If GitOps sounds like something your organization might benefit from, our best advice is to start small. Pick a tiny area to begin with, get a win and then build on that. At GitLab we call that iteration and it’s worked well for us.


    This article was co-authored by Priyanka Sharma, director of technical evangelism at GitLab.

    — Brad Downey

  • Using Spark and Jenkins to Deploy Code into Hadoop Clusters

    Using Spark and Jenkins to Deploy Code into Hadoop Clusters

    This article illustrates how to deploy an application into a Hadoop cluster using GitLab/Jenkins/Spark application.

    In this article, we will cover the following:

    • Auto-triggering Jenkins build when code is committed in Git.
    • Pulling the latest code from the repository through Jenkins.
    • Building, compiling and packaging the “.jar” using SBT tool.
    • Uploading the .jar to the Nexus repository with defined version.
    • Pulling the versioned jar and dependent files from Nexus repository to server.
    • Deploying the versioned “.jar” file through Spark job into Hadoop cluster.

    Getting Started

    The following must be performed first:

    1. Download and install Java 1.8.
    2. Install Jenkins.
    3. Integrate GitLab and Jira.
    4. Install SBT.
    5. Create the Hadoop cluster: Hadoop and Spark.

    End to End Steps in Detail

    When a developer pushes code to GitLab, Jenkins will trigger a predefined job using webhooks.

    The Jenkins job will pull the code from version control using Git; it builds the code and makes the package as .jar file using the build tool SBT. This .jar file can be deployed into a Hadoop cluster with the help of a Spark command.

    Once the deployment is completed in the Hadoop cluster, the application will start running in the background.

    Initially, we can see the current running application in Hadoop (see Figure 1). It has an application ID, which is in a running state.

    Figure 1
    • If we click the tracking UI, which is Application Master, it will navigate into the Spark streaming page.
    Figure 2
    • In Figure 2, we can see batches are running in 40 seconds. For this scenario, we are changing from 40 seconds in the code.
    • When a developer makes changes to the code, he will commit in his local machine and test his code, then push to remote repository. I have updated steaming time from 40 to 50 seconds and committed.
    • If we can specify the Jira task number in the commit message, the same comment will be updated in the Jira task as below.
    Figure 3

    In the Jira application, we can see our commit message as comments.

    Figure 4

    GitLab and Jira integration process:

    • Install Git plugin to pull code from GitHub repository and SBT plugin to build and make a package as a .jar file in Jenkins.
    • Configure the Jenkins job under source code management and provide the Repository URL along with credentials and branch details.
    Figure 5
    • Optional: Set webhooks to automatically trigger the Jenkins job when the push happens in GitLab.
    Figure 6
    • In the “build” section, add the parameters clean compile package in the Actions field, which will build the code and create a .jar file.
    Figure 7
    • Once the job has been triggered in Jenkins, monitor the Jenkins console for the next step and errors, if any.
    Figure 8

    Optional: If we have configured SonarQube, it will analyze the code files and provide the result in the SonarQube dashboard. This allows us to know the code quality, code coverage vulnerabilities and bugs to improve efficiency of code.

    • Optional: To maintain the versioning, we can upload our *.jar into Nexus/Artifactory.
    • Once .jar has been created, we can keep it in a specific folder and trigger a Spark job. This can be performed by triggering a Spark command from Jenkins. Execute the below command to submit spark job:

    # spark-submit –name appName –master yarn –deploy-mode cluster –executor-memory 1g –driver-memory 1g –jars $(echo $dependencyJarDir/*.jar | tr ‘ ‘ ‘,’) –class com.coe.spotter.DQModule –conf spark.driver.extraJavaOptions=../src/main/resources/log4j-yarn.properties –conf spark.sql.warehouse.dir=./spark-warehouse –conf spark.yarn.submit.waitAppCompletion=false app.Jar


    • Once deployed, we can see the application ID number has been increased.
    Figure 9

    Timeout in the Spark streaming job has been increased to 50 seconds.

    Figure 10

    — Nodagala Nagarjuna

  • The Importance of Instant Feedback in Analytics

    The Importance of Instant Feedback in Analytics

     A feedback loop is essential for every part of the modern DevOps environment. From continuous integration and deployment to application development to infrastructure monitoring to team dynamics, feedback is the most important piece of the DevOps puzzle.

    But feedback is of little to zero value if it is not timely. And in the modern development world, that means instant or as near to instant as possible.

    In the past, prior to the current world of web and mobile development, feedback was a closed loop between the developer and the application. Often aided by tests or a compiler, desktop developers could spot issues and follow trails to solve problems without worrying about end users seeing the flaws or getting caught in a bad deploy. There were no deploys, unless you consider pushing a new version out on disc or CD a deploy.
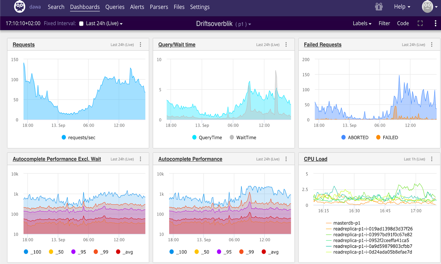
    As the world moved to web-based software and mobile software, new components came into play including cloud, containers, test-driven development and constant iterative deployments. All these led to a new need to monitor systems far beyond the single machine with operating system ecosystems prior to the web revolution.

    Before fully understanding the value of instant feedback, we first need to define what feedback is. When we are running multiple, divergent systems, such as a CI/CD server, containers for our applications or separate containers for our databases, information will be pushed to us in the form of feedback. Without some sort of analytical engine, this is simply raw data.

    Raw data often has little value. To those working directly with it, there may be something to be gleaned without manipulating it further, but for those abstracted from direct interaction with raw data, it is important to have some sort of buffer between the information we are looking for and the data in the raw.

    Taking raw data and putting it into a usable form is the role of the analytical engine. It’s important to note here that not all data is necessary to all people. For example, the sales department has no need of a dashboard showing CPU usage over time. At the same time, the operations team likely doesn’t need to see the burn rate of the sales team. Getting the information is the first step. The next is to get the correct information to the right people in a timely way.

    The importance of instant feedback is compounded by the development style adopted by the modern application development team. We want our web-based and mobile applications to be deployed consistently, if not constantly, as well as securely and with stability. When an application enters the world, we want to know if the deploy occurred correctly, if there were errors, and how many resources were necessary.

    If the team needs to wait for even a few minutes, it can be detrimental to business. The concepts of high availability and constant uptime for users has made it so every deployment needs to be tested and retested, but all this needs to be done in a short time frame.

    Modern, instant feedback allows everyone to see what is successful (and what is not) with enough time to adjust before a slight issue becomes a major meltdown. The analytical dashboards are feeding this information, converting the raw deployment and application data and presenting it as valuable feedback. This helps the modern DevOps adherent to streamline processes and continue to deliver a better product to customers and end users.

    It’s easy to see the past was a time when analytics and feedback was of little consequence, but as we continue forward, with faster deployment and development cycles, the role of instant feedback will continue to increase and better, faster solutions will need to grow to meet that need.

    — Geeta Schmidt