Tag: application architecture

  • How to Migrate an Observability Platform to Open Source

    How to Migrate an Observability Platform to Open Source

    Achieving full observability across enterprise applications is challenging. While third-party services like New Relic or Datadog make end-to-end observability easier, as your application grows in complexity, so does the telemetry data, leading to increased costs. Migrating to an open source stack gives you control over telemetry data and reduces observability costs, despite challenges with existing service provider commitments.

    Migrating to open source solutions is straightforward with simple architecture and tech stacks. However, transitioning the entire observability stack to open source demands meticulous planning, tools/frameworks assessments, testing, risk analysis, and cross-team communication, especially given the number of microservices, heavy cloud reliance, and diverse languages and frameworks to take into account.

    A cloud observability platform usually absorbs 20%-30% of overall infrastructure spending, but in some cases, it can reach 50%-60%. If your observability expenses exceed 50%, then transitioning to open source solutions would be a sensible option to mitigate tech infrastructure costs.

    For the past two years, I have been working on migrating the observability platform from a proprietary solution provider to an open source stack. Let’s dive into the key steps necessary for such a migration.

    Finalize the key telemetry data and systems

    Managed observability platforms offer comprehensive insights into system health, necessitating a significant volume of high-quality telemetry data. By default, the agents tasked with capturing and transmitting telemetry data are configured to gather as much information as possible, facilitating the creation of extensive dashboards and reports. However, this extensive data collection contributes to the overall cost.

    Select which systems you actually need to monitor. A typical enterprise application includes databases, caching databases, container orchestrators, and numerous cloud services. Engineers often monitor more services than necessary, which leads to unnecessary complexities and costs. It’s often sufficient to streamline the monitoring scope to essential systems.

    In my experience, the quantity of telemetry data required is significantly lower than what third-party services typically retrieve. You can easily divide those data collections into two buckets: must-have and nice-to-have. The “must-have” data aligns with the well-established four golden signals:

    • Latency: the amount of time it takes to serve a request
    • Traffic: the volume of requests that a system is currently handling
    • The error rate: the number of requests that fail or return unexpected responses
    • Resource saturation: the percentage of available resources being consumed

    These fundamental signals serve as the foundation for key dashboards and alerts. Observability platforms built on these signals cover 80% of typical use cases.

    Understanding each signal’s metadata requirements is crucial. The extent of metadata captured directly impacts the observability platform’s complexity and cost. For example, when monitoring service-to-service latency, consider the necessity for service IP addresses, instance IDs, or header information.

    Select the relevant stack

    Managed observability platforms such as New Relic and Datadog provide comprehensive monitoring for various enterprise components. However, when you migrate to an open source stack, you must assess and integrate the tool stacks to meet diverse monitoring requirements.

    One important aspect to consider is scaling: how to manage the huge amount of data generated every minute across all those systems. Focus on two fronts: selecting the stack for storing and processing telemetry data (logs, metrics and traces) and devising methods for capturing and pushing telemetry data from diverse systems.

    Telemetry signal stack selections
    Telemetry signal stack selections

    Stack for logs

    You require a stack that can efficiently and economically process and store the substantial volume of logs generated by the system. In the past, I used the ELK stack for storing and searching logs, but it is a generic solution and not tailored specifically for logs.

    I recommend Grafana’s Loki for its effective management of large log volumes and LogQL, a language akin to PromQL. If you are familiar with PromQL, navigating through extensive log data with LogQL is easy and intuitive.

    Stack for Metrics

    Prometheus is a popular database for storing time-series metrics data. However, it has scaling-related limitations; it cannot scale horizontally. Alternatives like Thanos, Grafana’s Mimir, and VictoriaMetrics offer better out-of-the-box solutions for horizontal scaling.

    I conducted some research and ultimately chose Grafana’s Mimir to store metrics in a similar migration project. This decision was based on Mimir’s remote storage capability, as well as its scalable and highly available architecture.

    Stack of Tracing

    Distributed tracing is a must in a microservices architecture, for easily identifying bottlenecks in latency and for resolving performance-related bugs. Grafana’s Tempo could be a good option for several reasons:

    • It can seamlessly integrate as a backend for Grafana’s dashboard. Consolidating dashboards in Grafana helps avoid navigating between multiple applications. Switching platforms just for tracing while using Grafana for other aspects of observability would not be practical.
    • Tempo provides a similar experience to TraceQL when interacting with the database, streamlining the learning process and significantly reducing the learning curve.
    • Tempo is compatible with popular open source tracing protocols such as Zipkin and Jaeger. If any team already uses these protocols, transitioning to Grafana’s Tempo would be smoother.
    Capturing and pushing telemetry data
    Capturing and pushing telemetry data

    You have to install an agent on the system to capture and push the telemetry data. Those steps vary based on the system being monitored. Typical enterprise application setups involve monitoring cloud integrations, process monitoring, infrastructure hosts, Kubernetes clusters and application monitoring. Among the possibilities:

    • Cloud integrations: This includes monitoring for cloud services such as SQS, SNS, EMR and EC2.
    • Process monitoring: This involves monitoring processes running on bare-metal machines. With the advent of dockerization and Kubernetes, there is now a standardized way of starting the application. In the past, there was no fixed mechanism. For example, to run a Java application, you could use a Java application, the ‘java -jar’ command, Tomcat, or OS systemctl. In the case of node, it could be npm or PM2. Each team or service may have had its own way of starting the process.
    • Infrastructure host: This entails monitoring the machine itself for metrics such as CPU usage, memory, disk I/O and Network IO or checking if the machine is offline.
    • Kubernetes monitoring: You regularly need to monitor a Kubernetes cluster, such as instances where Kubernetes is unable to schedule a pod due to insufficient resources.
    • Application monitoring: This monitoring focuses on overseeing the services the team created. Each service may differ in its development approach and choice of tech stack; but from an observability perspective, they usually are treated the same.
    • Browser and mobile monitoring: These metrics ensure optimal performance and user experience across different platforms. Browser monitoring includes tracking page load times, rendering performance, JavaScript errors and resource usage. For mobile, it includes monitoring app crashes, latency, battery usage, network requests and device-specific metrics.

    Before the advent of OpenTelemetry, there was no standardized method for monitoring applications. OpenTelemetry emerged from the merger of two earlier projects, OpenTracing and OpenCensus. It stands as a vendor- and tool-agnostic framework to instrument applications or systems irrespective of language, infrastructure or runtime environment. OpenTelemetry represents a significant community effort, and its popularity and stability are steadily growing.

    Validate observability stack on application architecture

    Applications vary in architecture and development stages. To address this diversity, you need multiple proofs-of-concept (POCs) across different systems, such as infrastructure, cloud service and backend and frontend applications.

    Migrating an observability platform from one tech stack to another is simple when the application architecture is a monolith. However, when the underlying architecture is microservices, it becomes difficult.

    While the microservices architecture offers flexibility in choosing different tech stacks for building services, devising a standard solution for capturing telemetry data becomes challenging due to the diverse range of tech stacks involved.

    Conducting POCs for various tech combinations is necessary to build a self-service tool that individual teams can follow to migrate their services easily. For instance, if your service uses Java 11, Spring Boot 3.x.x and PostgreSQL, these POCs can provide standardized steps to enable application monitoring.

    Migrate core components

    Setting up the observability platform involves configuring the stack for metrics, logs and traces, as well as installing the necessary agents. One advantage of migrating the observability platform is that there’s no need to transfer old telemetry data. During the testing phase, you will have an overlapping period to accumulate enough useful data to create specific dashboards and alerts.

    Migrating alerts and dashboards to the new system is essential, even when data migration is not necessary. This is because changes in the underlying techniques for capturing metrics may modify the names of the metrics and subsequently change all query expressions used in alerts and dashboards. Some metrics may not be available in certain scenarios, especially derived metrics that can be recreated from underlying metrics.

    While migrating query expressions manually is an option, a manual process is error-prone and time-consuming for a large number of alerts. I had experienced a similar situation with alert numbers ranging from 100 to 400.

    To streamline the migration, we developed a Node.js script that programmatically converted New Relic’s query expressions to Prometheus expressions. The script performed the following high-level steps:

    • Connected to the New Relic API server and fetched all the alerts configured for cloud integration
    • Converted New Relic alert expressions into PromQL alert expressions
    • Wrote all the Prometheus alert expressions into the YAML file

    Implementing this technique allowed us to successfully migrate all alerts and dashboards in four or five days, a process that would normally demand a month’s manual labor. Additionally, scripting significantly minimized the risk of human error.

    Test the migration

    Verify each alert and dashboard. Run both old and new platforms during testing. Parallel operation permits thorough testing of the metrics.

    However, running both systems concurrently may lead to a performance hit due to services sending telemetry data to two locations. Additionally, there may be a slight increase in costs until the complete transition.

    Running both systems in parallel provides an ideal setup to ensure the migrated dashboards and alerts are functioning correctly.

    Testing alerts that trigger during this process is straightforward, but evaluating those that have not yet triggered poses a challenge. In one project, I reduced the threshold value of each alert and tested its functionalities. Approximately 90% of the alerts generated through custom scripts worked seamlessly, with only 10% requiring some manual tweaking.

    Migrate other related components

    Other systems depend on the data generated by the observability platform. For example:

    • Notification systems like email, Slack channel, etc., that alert in case of an incident
    • Incident management tools like PagerDuty provide a streamlined way to handle incidents.

    These systems rely on the alert’s payload to work properly. Their assets should be updated, as a change in the observability platform leads to a change in the alert payload. Update the templates of notification systems to ensure they seamlessly integrate with the new alert payload.

    Similarly, incident management tools like PagerDuty require modifications to routing rules, escalation policies, and scheduling. Fortunately, readymade open-source migration tools are available to facilitate easy migration from PagerDuty to Grafana’s OnCall. However, in other solutions, you may not have access to out-of-the-box migration tools. In such cases, manual migration or script writing may be required.

    Timeframe for the Migration

    Planning a migration involves finalizing key telemetry data and systems, selecting relevant stacks. and validating the observability stack on the application architecture. It typically takes around three weeks.

    The project duration depends on factors such as the number of teams involved and the quantity of active services. For instance, a migration to open source with 100 microservices and involvement from 10 different teams may take four months to complete.

    Migration Complete!

    Transitioning your observability platform to an open-source stack offers a promising avenue for cost reduction and increased control over telemetry data. However, accomplishing this migration demands meticulous planning and execution, encompassing essential steps like feature prioritization, stack selection, POCs, core component migration, testing, and the migration of related systems. Despite the challenges posed by diverse architectures and technologies, a systematic approach, comprehensive assessment, and collaboration among teams can facilitate a smooth migration process and guarantee its success.

  • Design for DevOps: Using AI in App Design and Enhanced CI/CD Pipelines

    Design for DevOps: Using AI in App Design and Enhanced CI/CD Pipelines

    In my recent article Revolutionizing the Nine Pillars of DevOps with AI-Engineered Tools, I explained that design-for-DevOps practices, a DevOps pillar, involves designing software in a way that supports the DevOps model and CI/CD pipelines. This can include aspects like microservices architecture, modular design and considering operability and deployability from the earliest stages of design.

    In this article, I explain how AI can be used in the software design phase to enhance the performance of DevOps and CI/CD pipelines.

    AI-Assisted Code Review and Quality Assurance: AI-engineered tools such as DeepCode and Kite can detect bugs and security vulnerabilities in the codebase and suggest improvements.

    Infrastructure-as-Code (IaC): IaC tools such as Terraform, Ansible or Chef enable automation and standardization of the IT infrastructure and enhance the efficiency of DevOps pipelines by supporting rapid, consistent and repeatable deployments and rollbacks.

    Serverless Architectures: Developers can build and run applications without thinking about servers. This means less time spent on managing infrastructure, updating servers and debugging system issues. AWS Lambda, Google Cloud Functions and Azure Functions are all examples of serverless computing platforms.

    Containerization and Orchestration: Tools like Docker provide an easy way to package and distribute applications across various environments using containers. Kubernetes, on the other hand, can help manage these containerized applications at scale. Containerization and orchestration help maintain consistency across environments, simplify scaling and speed up the CI/CD process.

    Microservices Architecture: Small, independently deployable services can significantly improve the speed of development and deployment cycles as well as the reliability of applications.

    A/B Testing and Feature Flagging: Aided by AI-engineered tools, A/B testing and feature flagging can help to test new features in production with a small subset of users, making the release process less risky and more controllable.

    AI-Powered Performance Optimization: Tools like Akamas use machine learning to autonomously optimize the configuration of software applications, dramatically improving the performance and efficiency of CI/CD pipelines.

    AI-Driven Test Automation: AI-engineered tools can help automate the testing process. They can predict which tests are likely to fail and need to be executed first, optimize test suites and automatically generate tests.

    Adopt Observability: Use AI-powered tools for monitoring, logging and tracing to gain a comprehensive overview of the system. This data-driven approach can provide insights that can lead to performance improvements.

    Predictive Analytics: Tools that use AI can predict possible failures in the development process or in the software itself, which saves resources and helps developers anticipate and mitigate problems before they occur.

    Challenges and Solutions

    Challenges faced when implementing each of these strategies, and recommended solutions for overcoming them are described below.

    AI-Assisted Code Review and Quality Assurance: Developers may resist due to fear of relying too heavily on automation and skepticism about the accuracy of the tools. Begin with smaller, non-mission-critical projects and gradually scale up. Continuous training and iterative feedback improve the accuracy of the tools.

    Infrastructure-as-Code (IaC): The learning curve can be steep and managing IaC can require new skills. Invest in training your team or consider hiring experts. Start with simpler projects and scale up.

    Serverless Architectures: Debugging can be difficult and there can be concerns about vendor lock-in. Use application performance monitoring tools specifically designed for serverless environments. To address vendor lock-in concerns, use abstraction and containerization methods.

    Containerization and Orchestration: Containers require a different mindset and skillset compared to traditional virtualization. The initial setup and learning curve of Kubernetes can be steep. Training or hiring specialists is key. Starting with smaller projects can help in getting familiar with this new way of managing applications.

    Microservices Architecture: Implementing microservices can add complexity, especially around inter-service communication, data consistency and managing multiple databases. Use tools and practices designed for microservices such as service meshes and API gateways. Also, ensure each service is as decoupled and cohesive as possible.

    A/B Testing and Feature Flagging: This requires a mature deployment pipeline, and managing feature flags can be complex. Tools that manage feature flags can simplify this process. It is also essential to ensure a strong culture of testing and to have good monitoring and rollback capabilities in place.

    AI-Powered Performance Optimization: The accuracy and effectiveness of these tools depend heavily on the quality and comprehensiveness of the data they receive. Ensuring good data hygiene practices and comprehensive observability measures is crucial.

    AI-Driven Test Automation: AI testing tools can be seen as a black box, and their effectiveness is heavily dependent on the quality of the data they are trained on. As above, good data practices and thorough understanding of how these tools work is necessary.

    Adopt Observability: Implementing observability can require significant changes to application design and development practices. Start small with key applications or services and gradually increase scope. Training or hiring for the necessary skills is also important.

    Predictive Analytics: Building effective predictive models requires high-quality, comprehensive data and skilled data scientists. Invest in data management and data science capabilities. Using pre-built models and tools can help to get started.

    Roadmap to AI-Assisted DevOps Culture

    Implementing these strategies can be complex and vary significantly depending on the specific context and needs of an organization. The following is a generalized roadmap that can serve as a starting point.

    Step One: Assessment and Planning

    Conduct a thorough assessment of your current state, including the technologies in use, the skills of your team and the specific needs and goals of your business. Prioritize the strategies that are most likely to deliver value for your organization, taking into consideration the investment required and the readiness of your team. Create a detailed plan for implementing each strategy, including milestones and metrics for success.

    Step Two: Build Skills and Infrastructure

    Based on your plan, invest in the necessary training for your team. This could involve in-house training, hiring new team members with specific skills or contracting with external consultants or service providers. At the same time, start building the necessary infrastructure. This could involve setting up new servers, purchasing software or services or configuring existing resources.

    Step Three: Pilot Implementation

    Begin by implementing the chosen strategies on a small scale, ideally in a non-critical project or environment. Monitor the progress closely, gathering data on the impact of the changes and any problems that arise.

    Step Four: Review and Iterate

    After the pilot implementation, conduct a thorough review of the outcomes. Based on this review, iterate on your strategies and plan.

    Step Five: Scale Up

    Once you are confident in the effectiveness of your strategies, begin scaling up.

    Step Six: Continuous Improvement

    Regularly review your progress, keep an eye on new developments in the field and be prepared to adjust your strategies as needed.

    Benefits

    Implementing the roadmap as described will bring several benefits to the organization:

    • Improved Efficiency: Automation and streamlined processes, reduces manual effort and leads to increased productivity and more efficient use of resources.
    • Enhanced Quality: By using AI-assisted tools for code review, testing and performance optimization, the quality of the software can be significantly improved.
    • Increased Agility: Strategies like IaC, serverless architectures and microservices make it easier to adapt to changing requirements and market conditions.
    • Greater Reliability: By implementing robust testing, monitoring and rollback capabilities, the reliability of the software is enhanced.
    • Better Decision Making: By adopting data-driven strategies like observability and predictive analytics, the organization gains deeper insights into its processes and outcomes.
    • Risk Reduction: Through A/B testing, feature flagging and predictive analytics, potential issues can be identified and addressed before they cause problems.
    • Skills Development: Investing in an organization’s people has many lasting benefits.
    • Competitive Advantage: Adopting leading-edge practices and technologies will create competitive advantages.

    Summary

    This article provided guidance on crucial strategies for optimizing application design and development processes to enhance DevOps CI/CD pipelines. AI-enhanced strategies included AI-assisted code review, IaC, serverless architectures, containerization, microservices, A/B testing, AI-powered performance optimization, AI-driven test automation, observability and predictive analytics. Each of these strategies, while powerful, poses unique challenges such as resistance to adoption, complex learning curves and data dependency. Solutions to address these challenges focused on the importance of training, initiating less complex projects, maintaining good data hygiene practices and potentially hiring specialists.

    To practically implement these strategies, an example roadmap starts with an initial assessment and planning phase to understand the existing status and prioritize strategies. This is followed by skill development, a pilot implementation phase, a review and iteration phase, finally scaling up successful strategies. A successfully executed roadmap promises benefits such as improved efficiency, enhanced quality, increased agility, greater reliability, better decision-making, risk reduction, skills development and a competitive edge. The implementation of this roadmap necessitates careful planning, continuous learning and iterative improvement but holds the potential for a transformative impact on the organization, truly embodying the principle of ‘Design for DevOps.’

  • Technical Debt? No Sweat!

    Technical Debt? No Sweat!

    As a product manager, I dread the moment a developer says, “Wait a minute; I need to refactor …” (I wish it was just a minute). Something that should take two days starts taking three days and then a week. Over an application’s lifetime, the app starts accumulating technical debt. At that point, innovations become a smaller and smaller percentage of the work due to the vast efforts invested in the extra time required to support new developments.

    It is okay and natural to get into technical debt. As in finance, some people will take out loans to invest in something because they know that later they will be able to sell it for a higher price and pay off the loan with ease. Same with code. You take on technical debt because you want to develop the application faster and get the product or updates out as soon as possible. But in the end, the technical debt has to get paid. This creates friction between R&D and product, and although we both understand at some point that modernization is needed, it is difficult for the team to quantify. Due to all the long cycles, the complex QA, the increasing number of bugs and security issues, engineers start to feel frustrated. And as a product manager, I also feel frustrated when dealing with missed deadlines and inflated estimations.

    It’s not that we don’t want the developers to be happy and to invest in the code (and, let’s face it, in their own mental health, too), but we never know how much time and money is actually spent on technical debt versus how much is reallocated to innovation. For me, that was always a big question, but I never managed to move the conversation from, “I have a feeling,” or “The code looks ugly …” to “For every $1.00 I invest, X% is dedicated to maintenance.” How do we stop guessing and feeling we are in debt and actually start measuring it? And once we make technical debt tangible, when and where do we start modernizing?

    Every application’s innovation cost is affected by its level of technical debt. It’s important to determine how much money invested in the application is put toward innovation and how much is used to repay technical debt. In addition, there are classes of debt that add more complexity and risk overall.

    The newest versions of a monolithic application’s framework can be tagged as modern, aging or unknown (if the jar file isn’t found). This adds another layer of information when deciding what a modernization effort would entail and helps you focus first on aging frameworks that pose the greatest risk to enterprises due to the accumulation of technical debt and security concerns.

    Complexity, Risk and Debt

    The complexity of an application is determined by the degree to which class dependencies are entangled, reducing the level of modularity. A code risk relates to the length of the dependencies: How might a change in the application affect some of its seemingly unrelated components?

    These two metrics affect the architects’ ability to decouple functionality and create independent, isolated microservices in the future. At the end of the day, that is what forms the overall technical debt. Using the average of these three metrics, we can further prioritize applications in the portfolio. This provides insights into immediately actionable areas, such as our next metric.

    The process of modernizing takes time and money and, unfortunately, is a high-risk and often unsuccessful project. To make this process successful, it is first necessary to understand the cost of innovation, the complexity of the application and the risks involved. With these metrics at their disposal, R&D and product are well positioned for a comprehensive, data-driven conversation about modernization.

  • Four Causes of Technical Debt in DevOps

    Four Causes of Technical Debt in DevOps

    Ideally, DevOps should retain a lean footprint, but avoiding technical debt is easier said than done. As such, over half of IT leaders report technical debt is a big or critical problem. Without routinely addressing technical debt, DevOps teams can easily face inconsistencies during deployments. Versioning can get out of hand without consistent upgrades and aging legacy components can be a roadblock to development fluidity.

    Simply put, letting too much technical debt pile up isn’t all that great.

    I recently met with Kurt Andersen, SRE architect at Blameless, and Matt Davis, SRE advocate, to gather insights on the sources of technical debt in the field of DevOps. According to Davis, “Tech debt is something that you really want to keep chipping away at.” Below, we’ll highlight some common causes of technical debt and suggest ongoing practices to help tame it.

    1. UI-Based Deployment Patterns

    UIs are great for quickly configuring DevOps, but if your deploys aren’t codified, this reliance on UIs could come back to haunt you in the form of technical debt. A lot of the time, explained Davis, infrastructure teams have a tendency to just use the GUI of their given cloud provider to initiate deployments. Perhaps the team is wrapped up in feature velocity or a deadline to release.

    For example, you could use a UI to quickly create a database, but this is likely not a repeatable and robust process. Especially as an organization scales its cloud adoption and uses multiple clouds, you start to produce “snowflake” deployment patterns across teams, says Andersen. This could lead to inconsistencies around different deployment options per region.

    It’s not easy to catalog a configuration if it’s not written in code, and the more undocumented UI-based deployment patterns are used, the more silos of knowledge you create. “If not codified with Terraform, you have to document what you did—code gives you that documentation,” said Davis.

    Solution: Rely less on the GUI and codify your deployment patterns with infrastructure-as-code (IaC).

    2. No End-of-Service Life Cycle

    Development is typically more concerned with feature velocity than planning for service deprecation. Yet not envisioning the entire life cycle or setting an off-ramp from the start can produce more technical debt later on. “No one pays attention to planning for retirement, and at the end-of-life, services are hard to retire,” described Andersen.

    What you end up with are these “senile services” that aren’t doing that much but remain critical to the business’s operations. These services may be challenging to migrate. Or, they may be the product of unknown shadow or zombie APIs. For example, a marquee customer may depend upon a certain legacy endpoint, making the service difficult to evolve.

    Not planning for the end of the service lifecycle can hold up your development from more efficient ways to work. For example, if one “senile service” has never used a particular commit strategy before, it could stall agility when revamping the deployment pipelines, says Andersen. Thus, it’s best practice to set clear deprecation timelines and plan for the future.

    Solution: Plan the end-of-service life cycle from the upstart.

    3. Lengthy Dual-Track IT

    Another area that can produce technical debt in DevOps is dual-track IT. This is when engineering teams maintain one core stack in addition to an experimental structure and shift toward adopting the experimental structure over time. Development is constantly overseeing migrations to new technologies, yet they rarely plan for the coexistence of both stacks.

    While splitting an old and new stack into distinct units sounds like a temporary measure, some of these large transitions simply take longer than you think. For example, SoundCloud’s journey to refactor its monolith into microservices was an eight-year process.

    Solution: Realize dual-track IT might take longer than you think and plan accordingly.

    4. Intermittent Version Upgrades

    Third-party software is constantly upgrading to new versions. Especially if you’re integrating many open source dependencies into your stack, you’ll find the cadence of version upgrades to be quite fast. These upgrades are often imperative to plug new vulnerabilities as they emerge in the software supply chain.

    But upgrading versions and base images and having a patch management scheme that works from environment to environment requires a lot of work, Davis cautioned. Kubernetes version upgrades, for example, can take a lot of time. Yet, if your upgrades are not matching the pace of change, added Andersen, they can quickly pile up and leave you left behind with a mountain of work. “If you’re not upgrading monthly, you’re in danger.”

    Solution: Have a continual upgrade process in place.

    Technical Debt: Keep Paying, Cleaning, and Pruning

    Technical debt is something you need to grapple with before it gets out of control. But it’s not always apparent where it lives. Looking toward the future, automated tech debt scanning could help discover where technical debt is and provide remediation points as part of ongoing software stack auditing.

    You don’t want to get to the point where you accumulate and accumulate technical debt, only to burn it all to the ground in one disastrous fell swoop, said Davis. Similar to the way you slowly pay off a mortgage each month, technical debt is something you must continually keep an eye on and make reducing part of your team’s continuous workflow.

    Or, consider the old camping mantra of always leaving the campground cleaner than you found it. You pick up a little bit of extra trash and take it out with you, making the environment better for everyone. Or, consider how a gardener must prune the branches of a fruit tree to help it grow. Pick the analogy that works for you and see if you can apply it to continually reduce tech debt in your DevOps processes!

  • Microservices Explained: Not Your Father’s SOA

    Microservices Explained: Not Your Father’s SOA

    Microservices are frequently referred to as a variant or derivative of service-oriented architecture (SOA), if not essentially the same thing. While there are similarities and both are designed around the concept of services, that’s where the similarities end. Each was created around a different set of principles and intended to address different problems.

    Microservices architecture is built around key concepts that, when applied, not only differentiate it from other architectures but deliver advantages that accelerate software delivery and help to scale large, complex applications. To deliver on the promise of cloud-native, microservices must be loosely coupled so that, ultimately, they are independently deployable. Any microservice can be updated and deployed—just that containerized microservice—without requiring changes to other microservice(s). Loosely coupled microservices mean they are not sharing databases or maintaining state, for example.

    How big should a microservice be? Or, in other words, how much should it do? The answers range from ‘a single thing’ to ‘a small set of related code with high cohesion’. Another factor is that getting too granular can overrun a microservices-based application with large numbers of microservices, increasing complexity and making triage through observability and tracing very challenging.

    Scaling microservices-based apps is another important factor. Autonomous microservices can be replicated and scaled for performance and workload using container orchestration tools such as Kubernetes.

    Microservice communications are achieved through well-thought-out APIs created around the business or operational capabilities the microservice provides to anyone or anything engaging through the API. The API, and data provided through the API, are often referred to as ‘technology-independent.’ It’s probably better stated that microservice APIs are built using approaches like RESTful and GraphQL over networks that are not tied to any one specific operating environment, technology or programming language. JSON, YAML and XML similarly represent data that is transferable across technologies.

    The following diagram of a media application demonstrates the principles of microservices architecture. Microservices for scheduling media, digital rights management, tracking impressions and adding new ad insertions are loosely coupled, autonomous and have well-defined API interfaces. Each microservice can be changed, enhanced and deployed rapidly and independently of other microservices.
    Microservices SOA

    Service-oriented Architecture, or SOA, emerged to solve a very different problem; the overwhelming size and complexity of monolithic applications. Monolithic applications have very large codebases that often don’t do a good job of compartmentalizing functional or business logic. This makes changes to the codebase challenging even to developers who know much of the codebase well.

    Services in SOA were often used to gather a collection of similar business logic together and then share them as a service with other parts of the application, as needed. Technologies like message buses are used to make requests of a service and operate as traffic managers for requests across multiple services and other parts of the application. While reusability was a critical design consideration, SOA services were still quite large, and deploying services at high velocity was not an important design consideration. SOA services often take considerable time to code and test the service including interdependencies across other parts of the application before deploying as part of a larger software release.

    One important note: There are benefits and drawbacks to microservices and SOA architectures; neither is ‘better’ than the other. Which architecture to use when mainly depends on the purpose of the application you are building. For larger, more complex enterprise application environments that require integration with many other applications, you might choose SOA. That’s a better fit than for smaller applications that don’t require middleware elements for managing the requests within the app or between other applications. Microservices, on the other hand, are better-suited for smaller and well-partitioned web-based systems. They are becoming the standard for today’s cloud-native applications, and also are a great fit for developing a mobile or web application because they give developers more control.

  • Moving From Lift-and-Shift to Cloud-Native

    Moving From Lift-and-Shift to Cloud-Native

    Analyst firm Forrester recently predicted that 2022 “will see big organizations move decisively away from lift-and-shift approaches to the cloud, embracing cloud-native technologies instead.”

    According to Gartner, more than 85% of enterprises “will embrace a cloud-first principle by 2025 and will not be able to fully execute on their digital strategies without the use of cloud-native architectures and technologies.”

    As the Gartner analysts put it, “cloud-native platforms improve on the traditional lift-and-shift approach to cloud, which fails to take advantage of the benefits of cloud and adds complexity to maintenance.”

    What’s happening here? Is lift-and-shift–long seen as a relatively quick and inexpensive way to migrate existing workloads to the cloud–really going the way of the dinosaur? Has the cloud-native future really arrived?

    I think the true answer is somewhere in the middle right now. Yes, many companies have adopted a cloud-first strategy, turning to the cloud as an assumed starting point for most or all of their application needs. But many others still have a mix of on-premises infrastructure and public cloud infrastructure with opportunistic lifting-and-shifting from one to the other rather than a holistic cloud-native model.

    Lift-and-shift has been and remains a perfectly natural and effective step in many organizations’ cloud journeys. All you do is redirect a copy of an application from an on-premises data center to the cloud–no need to redesign the app’s architecture or code.

    This method offers a fast and efficient way to leverage the cloud’s benefits: The ability to focus IT dollars on operational (rent) rather than capital (own) expense and take advantage of the extensible computing power, storage and other services in the cloud.

    In contrast with lifting and shifting, a cloud-native approach takes longer and is more labor-intensive because it takes many moving parts to redesign the entire app ecosystem. The payoff comes later with lower total cost of ownership and more flexible, responsive infrastructure.

    If many companies are still lifting-and-shifting, why are the analysts so bullish that it is on its way out? Because lift-and-shift isn’t as simple and inexpensive as it looks. It essentially defers the eventual re-engineering to cloud-native and yet still requires an investment in capacity, people, money and time.

    First, despite lift-and-shift’s promise as an easy way to migrate existing applications to the cloud, it is common for organizations, no matter how much they plan, to hit some technical roadblocks in the execution. An app that worked a certain way in the legacy environment might not work exactly the same way in the cloud, and these details must be worked out.

    Second, companies are often caught off guard by cloud “sticker shock”–the unpleasant billing surprises that occur when workloads exceed the capacity agreed on with the cloud provider.

    Third, while lift-and-shift is a way to advance on the cloud path, it’s not the ultimate destination.

    The Cloud Native Computing Foundation defines cloud-native technologies as empowering organizations “to build and run scalable applications in modern, dynamic environments such as public, private, and hybrid clouds. Containers, service meshes, microservices, immutable infrastructure, and declarative APIs exemplify this approach.”

    That’s a much bigger vision than the intermediary steps that lift-and-shift entails.

    What should companies still engaged in a lot of lifting-and-shifting be doing to prepare for their cloud-first future?

    1. Containerize like crazy. Virtualization was a game-changer because it allowed companies to abstract away hardware and run multiple virtual machines (VMs) on a single piece of hardware. This allowed a move in best practices toward a VM-per-function. Process containers, made famous by Docker and Kubernetes, are a logical extension of this concept: Stripping out redundant pieces of an operating system so that each logical unit contains only what is needed for the function it is designed to achieve. That, combined with a more deliberate approach to separating application and data, is the secret sauce of a cloud-native enterprise. Container adoption has been growing rapidly in enterprises–Gartner has predicted that containers will be the “default choice for 75% of new customer enterprise applications” by 2024. This trend bodes well for the move away from lift-and-shift to cloud-native and brings organizations closer to “write once, deploy anywhere” as each of the major cloud platforms and many on-premises tools provide mechanisms to run containers as first-class citizens.

    2. Consider the skills equation and where you want to focus your efforts. Every company embarking on a cloud-native strategy needs to carefully examine to what extent they’ll need architects and other skilled pros to carry it out. They need to think about what makes sense in terms of hiring people in-house, outsourcing to third-party experts and leveraging public cloud offerings such as serverless computing that reduce labor requirements.  It may be more sensible, for example, to focus on migrating application development to containers but rely on public cloud container platforms, low-ops Kubernetes or managed data center Kubernetes services rather than trying to build that competence in parallel.

    3. Rely heavily on automation. One of the advantages of containers encapsulating everything they need is that it makes it easier to build, test and deploy them as part of a CI/CD pipeline. Given they are also normally easier to scale horizontally, it is possible to automate how the application will scale to respond to external factors. Taking a model-driven approach to cloud-native applications can help DevOps teams and developers understand the conceptual pieces and relationships between complex software deployments while automating some of the details and life cycle management. Monitoring microservices brings its own set of challenges, so it is important to ensure that the observability tools you are using were designed to be effective with cloud-native applications. Cloud-native can bring great scalability benefits, but only with sufficient automation to limit friction in the cloud-first journey.

    4. Have a strong update strategy. Moving to containers distributes your software provenance and update problem across a much greater number of pieces; containers are not normally updated but instead are replaced with an updated version. This changes your traditional update approach. It is more important than ever that the pieces you are putting into those containers at build-time have a good software provenance and update story.

    5. Think holistically. Ruthlessly evaluate what apps can be cloud-native and which should remain in the data center and then consider the true benefits of hybrid cloud. Some organizations get caught up in thinking they need to move everything to the cloud wholesale. Maybe cloud-native isn’t right for everything.

    The industry-wide transition from lift-and-shift to cloud-native is accelerating. By keeping these five points in mind, companies can feel confident they’re moving forward, too. 

  • Some Change is Bad

    Some Change is Bad

    Some time toward the end of the year, I start considering the volume of change we, as practitioners, have been under for … literally years, even decades. And I start to try and think of ways to keep you all from drowning in change. And then I write something that I hope helps you all focus on good change, and keeps moving your environment forward.

    This year I’m going to say “consider the reasons for the change.” I will attempt to find examples that do not require mentioning a specific product or vendor, so apologies if these read a bit convoluted as I attempt to illustrate this point without castigating.

    There are three basic reasons that a market or marketers want you to consider a change. There are, of course, variants and cases where it is a bit of this reason and a bit of that, but most demands that we change what/how we are doing things can be lumped into “mostly one of these”. They are:

    1. A great idea that is really a game-changer for some subset of the market.
    2. A shifting of who is in control.
    3. Locking customers in or expanding revenue.

    All of these happen at the vendor/project level, and all of them happen at the market level.

    Number one is best illustrated by any of the waves of server virtualization that have come through. From virtual machines to containers, each has solved problems and changed the way we do business. Notably, I’m only talking about server virtualization efforts here. Most of the other virtualization attempts have really not fit the “great idea that is a game-changer” category, though some have limited usefulness. Personally, I think the new version of storage virtualization will be in the game-changer category but am waiting to see it in use.

    Number two is one to watch out for and is most obvious when big-name OSS projects are forked. It is rarely about the technology being implemented (after all, a fork is a copy of the original; at first it is not at all about the technology), but rather about who is calling the shots. There is a bit of this in every public cloud vendor implementing their own version of container management (though this example is more about lock-in, in my opinion).

    Number three is multi-pronged. If your vendor went from selling you hardware or software to selling you a service, they want that recurring revenue and they want you to be linked into that service so deep that you can’t walk away. The much-reviled 1990s mantra of “embrace and extend” is the poster child for this kind of change. There might be a value-add in there somewhere and sometimes the added functionality makes the move a no-brainer. Often, though, the change is simply to the vendor’s advantage, not their customers. As most major Linux distros have shown, open source is not immune to this one, as most of them are making OSS users the de facto beta testers for their paid offerings.

    None of this is to say that the change in front of you is bad—even if the reason it was originally spawned is bad. It is reminding you that, after a constant stream of change, we’re more open to it than maybe we should be and you should remember the only important thing about new changes—do they make our environment more secure, faster, more agile? Everything else is just noise. Yes, all the cool kids are switching to coding in [insert flavor du jour], but does it offer your organization anything new? Yes, it seems everyone is using [insert current CI/CD flavor], but does it address the weaknesses of your current toolchain?

    You all are nailing it. Keep doing it. And don’t be afraid of change, but make sure you know if that new OSS database system is really new, or just a lot of installing the same code under a slightly different name. Because someone didn’t like the new owners.

  • Popular iOS Apps Request Excessive User Data Permissions

    Popular iOS Apps Request Excessive User Data Permissions

    Most apps require some sort of user data to function properly. Google Maps needs location data to offer routing services. Twitter needs photo library access to upload a photo, and so on. Many users are quick to allow access to personal information without hesitation. However, in recent years, it’s become apparent that many apps are collecting (and leaking) an excessive amount of personal data, resulting in serious privacy issues. This has led Apple to give user privacy a heightened focus in recent iOS updates and marketing campaigns.

    Often, user data is being collected in the background for legitimate use cases, such as tailoring personalized user experiences and refining app performance. But, many apps are also monetizing user data by reselling it to third-party advertising data brokers without explicit user consent. More seriously, recent studies show that commercially available “anonymous” data can be de-anonymized. If location data is exposed, it could put at-risk people in actual danger. These are nuanced privacy violations that U.S. regulators have yet to respond to and address.

    To shed light on the data that apps are collecting, a recent study conducted by Jamf analyzed the iOS permissions requested by nearly 100,000 popular apps on the App Store. The study found the four most-requested mobile app permissions to be photo roll, camera, location data and microphone. The findings also revealed that popular apps are consistently requesting access to data that does not serve the application’s core purpose.

    Users should consciously be aware of the data they allow apps to access. Yet, the onus is also on business leaders and app developers to limit unnecessary data collection and reduce the potential for data overexposure. In the wrong hands, access to device hardware, such as a microphone or camera, could be used to steal sensitive material. And, if leaked, personally identifiable information (PII) exploits could be disastrous to the business.

    Below, I’ll review the key takeaways from the Jamf study and consider if the constant barrage of permissions requests is exacerbating privacy issues during the application development process.

    Four Most-Requested App Permissions

    The Jamf research found the top four types of app permissions were photo library access, camera access, location data and microphone access. In addition, other popular areas included calendar information, contacts and Bluetooth. Less-requested app permissions included voice processing, health data and local network access. The study arranged apps by their App Store categories, such as business, education, entertainment, news, shopping, travel and other areas.

    user data permissions

    1. Photos

    By far, the most requested data access type is photos. At least half of apps across all categories request access to user photo libraries. Naturally, this request is most common among photo and video apps such as YouTube, FaceApp or Splice; 96% of such apps request access to photos. This is followed by 87% of shopping apps (Amazon, Shop, eBay, etc.), and 84% of social networking apps (Facebook, Instagram, Twitter, etc.).

    At issue here is that the level of intended photo library access can be highly variable. For example, granting access to an entire camera roll along with decades of old personal photos just to upload one picture grants a rather invasive privilege. This has led Apple to enhance privacy controls—users can now choose to allow access to select images only or their entire roll.

    With these new constraints in mind, app developers should take steps to respect user privacy. Be aware of potential photo limitations and design apps to only collect necessary photos for the task at hand.

    2. Camera

    The next-most requested permission is for camera access. This is most common among photo and video apps, among which 90% request camera access. This is also common among shopping and social networking apps (83% each) and business apps (75%) like Zoom, Slack or WebEx. Similar to findings about photo library access, enabling camera access is ubiquitous. However, it is also one of the most dangerous permissions to grant indefinitely. If a bad actor obtained account access, this vulnerability could enable them to spy on users.

    Again, developers should consider introducing camera functions only when it’s essential for the task at hand. Obviously, it’s unethical to invoke camera access when users are unaware. Even camera-related bugs can have extreme repercussions. For example, a 2020 lawsuit against Instagram argued the app was spying on users. Due to its threat potential, high-security facilities have disabled camera hardware entirely.

    3. Location

    Location tracking is another permission that can be very useful but is, at times, overprescribed in modern app development. Location data includes cellular, Wi-Fi, GPS and Bluetooth data used to determine a user’s approximate location. The categories that collect location data most often include shopping and food and drink, both at 81%. Social networking and photo and video app categories follow at 72% and 68%, respectively.

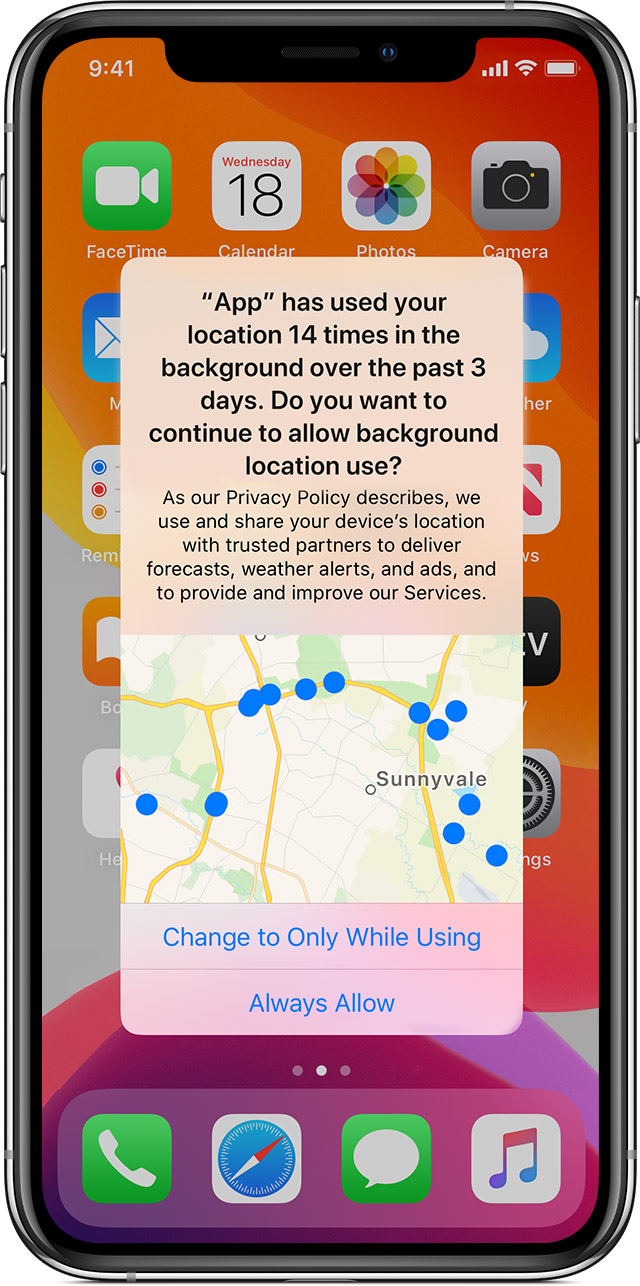
    Nowadays, iOS privacy settings offer a check against tracking location data in the background. iOS users can now choose between: ‘Allow While Using App’, ‘Allow Once’ or ‘Don’t Allow’.

    user data

    When an app tracks data in the background, a blue indicator now displays in the status bar to increase user awareness. iOS also reminds users when apps use significant amounts of location data and offers ways to turn location services completely off. Android has followed suit with an ‘Allow only when the app is in use’ function, too.

    user data

    Location tracking feels a bit creepy. In the wrong hands, it could easily be leveraged for nefarious purposes. Out of all the permission-granting options, location data presents much more of a physical safety concern for the end user. From the user’s standpoint, they should only enable access to location tracking while using an app. From a developer’s standpoint, they should be extremely careful when collecting and storing such PII to ensure regulations aren’t broken.

    4. Microphone

    Lastly, access to the user’s microphone is the fourth most commonly requested permission. The survey found 69% of social networking apps, 64% of photo and video apps and 41% of both business and productivity apps (Asana, Google Calendar, TimeTree, etc.) all want to be handed the mic.

    Here, potential privacy concerns are similar to those involving camera access. Bad actors could potentially activate the mic to listen to private conversations, record ambient noise and sell findings to advertising brokers. To increase user awareness, iOS 14 now requires an orange dot to display, indicating when the mic is in use.

    Other User Privacy Concerns

    User behavior tracking and app-to-app information exchange is another ongoing area of privacy concern. Companies often resell such information to data brokers, which is then used to refine highly targeted ad campaigns on third-party sites. This is how your search on Google results in product advertisements popping up in your Instagram feed. Apple is just starting to counter this practice with their App Tracking Transparency feature. In iOS 14.5, app devs must ask whether they can track your activity.

    Recent analysis has confirmed that commercially available consumer data, though labeled as “anonymized,” can successfully be used to piece together an accurate picture of a user by corroborating behavior on other apps. For example, users were able to track and pinpoint behavior that resulted in the outing of a catholic priest on Grindr. Smartphone app data could similarly be used by predators to spy on celebrities or politicians, posing a tangible security threat.

    Another cause for concern is metadata associated with photos. People often enable GPS-embedding into images to help organize their photo memories. If this is inexorably linked to photos, it essentially permits location data sharing to parties with photo library access who might not otherwise have location tracking permissions.

    From Big Data to Big Problem

    Perhaps the most curious finding of this report is that all apps are requesting permissions that seem irrelevant to their core value proposition. For example, why do 87% of shopping apps need access to a user’s entire photo library? Do 46% of food and drink apps really need access to a user’s personal contacts to place a food delivery order? Do navigation apps really need your personal calendar information to calculate a route downtown?

    The answer is not a pretty one. There has been a business imperative, for years, to track and collect large amounts of user data. There is undoubtedly an argument to be made for enhancing the user experience with innovative features and the role of big data in AI. However, this ongoing practice continues to creep into ethical gray areas. The fact is, the more personal data an app collects, the more potential privacy issues and security threat vectors are created in the process.

    Requesting permissions to on-device hardware and data collection is not always necessary. Thus, to stay safe and limit data overexposure, don’t overprescribe data collection. If it’s not fundamental to your app’s core function, don’t collect it, and don’t store it. Think twice before requiring many device permissions, and regularly audit app permissions requests to keep them to a minimum. As iOS and Android introduce new platform guidelines to elevate user privacy, developers should be prepared for users to grant fewer and fewer data collecting permissions. This is their right.

    It would be great if tech companies invested in honest, ethical business models that didn’t rely on harvesting and reselling user data to shady advertisers. And for those that mine user data but say it’s anonymous, I would point to reports that show anonymous data is nothing but pure myth.