Category: Blogs

  • A Puzzle – Gradle or Maven

    A Puzzle – Gradle or Maven

    Build Tool

    Gradle vs Maven (or Both)

    The world of build tools evolved from simple compilation (gcc) to make files, then evolution of ant(+ivy) and Maven, now the latest build tool is Gradle.

    It’s always a puzzle which build tool to choose – Maven, Gradle or both. Sometime it’s first time project setup or it could be migration from existing tool, but it’s always a debate to choose one or the other.

    There have been lot of talks and discussions on Gradle, Maven (and/or Gradle vs maven). There is buzz around that Android/Google adopted Gradle as its standard build tool.

    Here, I would like to explore the possibilities of adopting Gradle or Maven (Or both), Intentionally i am keeping ant+ivy out of this talk.

    Lets take a look at the details on why Android may have adopted Gradle

    Key points for Google to go ahead with Gradle for their android development are:

    • Create multiple APKs for your app with different features using the same project.(create several variants of an application)
    • Reuse code and resources.
    • Customize, configure, and extend the build process.
    • Customized integration with their own IDE Android Studio.
    • Single build tools to support multiple languages.

    They had some special requirements for their diverse eco system, they worked with gradleware development team to include customized feature for the android application. They even have customized IDE for android developers build around Gradle.

    What we may be looking from build tools

    • How easy is the learning curve?
    • How fast are different builds with each tool?
    • How complex is it to create and maintain the build script?
    • How many plugins exist and how simple is it to customize your own plugins?
    • How good is the community and documentation for each tool?
    • How well does each tool integrate with developer tools? (IDE, App Server, CI server).

    Lets take a look at Maven and Gradle build tools on basis of above points and give them score as per our use case.

    Here is the Tabular comparison for each point between Maven and Gradle.

    Points Maven Gradle Score
    How easy is the initial learning curve 1) Maven is XML based tool, XML is very commonly used/known.2) If existing project are using maven then developers are comfortable with the system. 1) Gradle is DSL based system and need to learn explicitly.2) Developers need to learn new system from beginning if they are not familier Maven – 8/10Gradle – 5/10
    How fast are different builds with each tool Taken a report from zeroturnaround, they have done detail analysis of the speed of builds with both built tools and found maven and gradle are close enough on build timings. Maven – 8/10Gradle – 9/10
    How complex is it to create and maintain the build script? Maven build scripts are xml based, which has predefined structure and only one way to write.So it makes it more standard and less flexible. Gradle has its own DSL which is introduced by Gradleitself and tightly connected to Gradle internals But its flexible and simple and short Maven – 5/10Gradle – 7/10
    How many plugins exist and how simple is it to customize your own plugins? Maven is called “plugin execution framework” Hundreds of plugins exist for Maven and you can create your own plugin is simple. Gradle’s architecture is also plugin-based, It’s easy to write plugins But availability of plugin in community may not be ease. Maven – 8/10Gradle – 6/10
    How good is the community and documentation for each tool? Maven is in the market for very long time, Documentation is good, Lots of resources and help available in open community and forum. Gradle is very recent. It is open source but still under control of gradleware. They have option for commercial support. Maven – 9/10Gradle – 8/10
    How well does each tool integrate with developer tools? (IDE, App Server, CI server). With many years of background Maven has full support to almost each tool and every category (IDE, App Server, CI). Lacking in the App Server and CI ServerCategories, mainly due to newness. Maven – 9/10Gradle – 5/10


    (Note – I haven’t given any tool 10/10 because there is always room for improvement).

    My scoring is based on following fact.

    • One is already using maven for all their projects.

    Total Score

    Maven – 47/60

    Gradle – 40/60

    One can decide the score on the basis of their user case and requirement.

    Choices

    • Gradle

    You may not be using other features which are used by Google for android development as those features may or may not match with your needs, however Gradle is essentially emerging as a popular tool and you may definitely want to have a look at it.


    • Maven

    Maven is widely used and has robust defined workflow around it. Developers are very familiar with the system. However this may not be a viable option as android development needs to use Gradle.


    • Maven and Gradle (both)

    This would be the one option for a company with a wide range of development options. It may give developers flexibility to adopt tools as per their choice with a given workflow.

    Reference #1

    References #2

  • Business Value of Log Analysis

    Business Value of Log Analysis

    The modern software delivery pipeline breaks the mold of traditional process and tool acquisition, but doesn’t warrant any less consideration. Measuring the impact of log analysis for your ops and dev teams (and the organization overall) is more of an exercise in measuring process improvement—not hard ROI.

    The soft ROI components of log analysis are:

    1. Wasting Less Time: IT Operations wastes dozens of hours each week hunting down system events that relate to a problem. Log analysis not only eliminates the lost time, but also this reactive approach to addressing problems. Identifying system issues is an arduous task, especially when it’s not clear if the problem is on the application layer or the infrastructure. If the issue is a combination of the two, a delayed release is the likely outcome. With log analysis, you’ll discover issues either before or as they happen and avoid both lost time and unnecessary delays!
    2. Responding and Resolving Issues More Quickly: Developers working with IT provided analytics respond to and resolve bugs more quickly. This helps improve the stability of production and frees up developer time to focus on adding new functionalities that will ultimately increase the value of your application.
    3. Reducing Customer Churn: Modern customers demand stable applications with regular updates. Without this positive user experience, they’ll move on and find a different application to meet their needs. Frequent outages and poor product quality result in churn even in previously entrenched industries. For instance in financial services, a few bottom-up constructed DevOps teams are blowing traditional organizations out of the water. Some of the older institutions have stepped up their game but only by thinking ahead and using better metrics.
    4. Accelerating Releases: You cannot do agile if you are always playing catch up with production. Often organizations delay six or more planned releases a year due to unexpected issues. When a publicized release is delayed, customers are particularly unhappy and prone to jumping ship. In agile, with the expectation of regular bi-weekly or fast sprints, delays are a major let down. If your goal is continuous integration or delivery, delayed releases are not acceptable.
    5. Optimizing Production Infrastructure Costs: Growing infrastructure quickly is easy, but how fast is too fast? Because of its low visibility, bad infrastructure can control your organization without you even realizing. Using log analysis, you can attack server sprawl head-on, track workloads assigned to specific machines and identify underutilized or dead assets. You can also use that data to restructure your on premise or cloud infrastructure spend!
    6. Exploratory Infrastructure: Log analysis builds confidence that server logging is happening automatically, freeing IT resources and providing them the time to consider how and where your system can be improved. From identifying infrastructure configurations that will enhance the environment to auto-scaling initiatives or simply engaging in more productive activities than justifying outages, your IT department will have the time to focus on higher-level thinking and tasks.
    7. Improving Communication: With better reporting, comes better communication to both the team and executives. Presentations are built more quickly, analysis showing what went well and poorly is generated easily and action items for improvement are implemented in more detail and without any additional effort. Consistent presentations means standard dashboards and greater efficiency across the board for the team.

    Forget the ROI

    You may have noticed the absence of any ROI calculation in our benefits analysis. This is intentional, because in the end, the calculations don’t matter. The point of implementing log analysis is to replace your existing procurement model with a system that your team already knows is better. Unfortunately, those who continue to use old ROI calculations to evaluate these tools will miss these benefits.

    Cloud-based log analysis sometimes seems too easy, but it is the future of the modern software delivery pipeline. The processes and tools that drive log analysis are simplified and seamless, adding value to your culture, team and processes that cannot be measured in dollars.

  • Shift Left: Can you be left out?

    Shift Left: Can you be left out?

    One of the most popular terms bandied about in DevOps is “shift left”.  I was at a workshop last month at IBM InterConnect conducted by Sanjeev Sharma and Mustafa Kapadia. They put on a great workshop which was a preview of an exercise they perform in the field for clients.  A central theme of their talk was the idea of shifting left to address issues earlier in the development process.

    iBM, Sanjeev and Mustafa (both of whom write here on DevOps.com) are not the first or only people who speak about shifting left in DevOps.  Derek Weeks of Sonatype wrote a blog post about it back in September of 2013. Almost a year to the day later, Dibbie Edwards of IBM (and the focus of a good article by George Hulme) wrote a good article about shifting left with continuous testing. Andrew Storms wrote a post here on DevOps.com some months back about shifting security left in DevOps.  Indeed shift left is generally regarded as a basic foundation of DevOps.

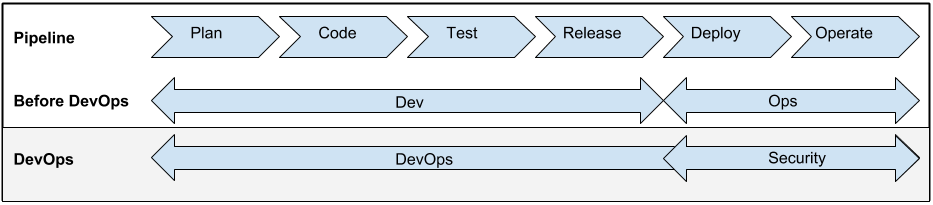
    Before we dive into what this means to you, we should make sure that we all understand what shift left really means.  For me looking at a standard flow of the development/deployment process is the best illustration of this. I think Andrew Storms used a good one in his article, so let’s repurpose it here:

    left 1

    Pay no attention for now to the before DevOps or DevOps rays for now.  Take a look at the top line which is the pipeline.  You can see the flow of an app from plan to code and all the way to operate.  The flow runs from left to right.  At its simplest shift left moves tasks further left.  Security, continuous testing, continuous integration, continuous delivery are all shifted left.

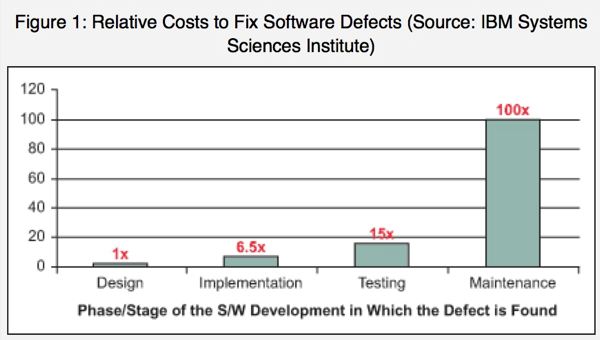
    In doing so potential issues are addressed earlier in the lifecycle. What is this a good thing?  A chart from Dibbie Edwards article gives us the obvious answer:

    left2

    As can be seen the earlier you can get to issues, the cheaper it is too fix them.  That alone is a reason to shift left.  But also concepts such as addressing security issues before it effects your customers is appealing. The same can be said for many other functions you can shift left.

    For me though the question is by shifting everything left, do we just wind up with a big pile at the very left?  How do we prioritize all of these left shifted functions?  You can only shift left so far before you come to the beginning of the time line. This is not the birth of the Universe where you had a big bang which defies the laws of physics.

    At some point can you shift too much left? This is a question I am going to pose to Sanjeev and Mustafa. I also pose it to you the reading audience.

    I recognize that the concept of shifting left is not so efficient that everything that can be shifted is in fact shifted left.  But as we get more efficient, more and more tasks are left shifted in the process. At what point do we reach the point of diminishing returns?

    How do you feel about this? Can we shift too much left? I am interested in some of the different views on this. I am a big proponent of shifting security left, but are there other priorities?

    Let us know your feedback.

  • Automation, Provisioning & Configuration Management (CHEF)

    Automation, Provisioning & Configuration Management (CHEF)

    Introduction

    Chef is an influential configuration management and automation platform that transmutes the complex infrastructure and helps you in describing your infrastructure with code, by bringing your servers and services to life. Since your infrastructure is controlled and managed with code, it can be automated, tested and reproduced with efficiency and ease.

    Chef automates the applications configuration, deployment and management throughout your network regardless of its size, even if you’re operating in the cloud, on-premises or on hybrid.

    Chef is constructed around easy concepts: achieving the desired state, centralized modeling of IT infrastructure and resources primitives that serve as the building blocks. Chef’s biggest asset is that it saves the time in setting up virtual servers and other tasks. Through a multi part series I will be covering best practices in Automation, Provisioning & Configuration Management with CHEF.

    Why Chef?

    Being a system administrator is alternately inspiring as well as tedious, on the other hand is the thought to bring the best to your organization goes hand-in-hand with the idea that you require help to keep it all running. It is exceptional that a single individual is familiar about each and every complex problem and its essential solutions. Same goes with the tools also. Chef provides you with a framework which helps in evading these worn-tools problems. It even improves infrastructure management that can help you to solve every complicated problem.

    There are numerous reasons to use Chef:

    1). Chef immensely decreases the amount of documentation you ought to write.

    2). Chef doesn’t change the scalability of the Bash.

    3). Chef comes up with terrific technical approaches.

    4). Chef is a tool that grows with you.

    5). Chef can help you in holding back and stop you from reinventing the wheel.

    What are the fundamental principles?

    The main principle of Chef is to make users know best about their environment, what should be done and how it should be maintained. Chef-client does not come up with any assumptions. Only the individuals i.e. you and your team members on the ground is capable of understanding the technical as well the human problems which includes audit trails, skill levels and other internal issues that are unique to your organization and what are the required solutions to solve these problem plus whether any single technical solution is feasible.

    Main components of Chef

    Chef environment is typically made up of three components:

    1. Chef Server
    2. Workstation
    3. Chef Nodes

    Chef Server:

    The Chef server is the brains of the operation which acts as a hub to store configuration data that is available to every node and also administer access rights. It preserves all the information regarding your infrastructure. All the client nodes are registered within the server.

    The Chef Server stores and holds all the cookbooks, recipes and metadata that illustrates each and every registered node which is being managed by the chef-client and the policies that are applied to nodes. Clients communicates with the server in order to get the correct configuration details from the server such as recipes, templates, file distributions and apply it to the nodes. This type of flexible and scalable approach distributes the configuration effort throughout the organization.

    Workstation:

    Workstation is the development machine from where users run all configuration related tasks which includes creation of cookbooks and recipes, updating chef-repo, interacting with the single Chef server and many more. Workstation is the place where user will spend most of their time with Chef and will do most of their work that includes:

    • Development of the cookbooks and the recipes
    • Retaining the chef-repo synchronization with version source control
    • Making the use of knife to upload items from the chef-repo to the Chef server
    • Configuring organizational policies i.e. defining roles as well as environments and ensuring that critical data is stored in data bags
    • Communicating with the nodes whenever needed, such as carrying out a bootstrap operation

    Chef Nodes:

    A node can be a physical, virtual or cloud machine that contain the chef-client which performs all the infrastructure automation. Nodes are the computers that we manage using chef and it act as server in our infrastructure.

    chef-fig1 Fig:1

    How Chef Works?

    As already mentioned above, Chef converts infrastructure into code and make your infrastructure easily versionable, testable and repeatable as the application code.

    Chef is totally dependent and certain about the reusable definitions named recipes to automate infrastructure tasks. Recipes make use of the building blocks called resources. These resources explain a certain pieces of infrastructure like a file, a template or a package to be installed. You can make use of these resources whenever required or even built up your own so as to manage and accomplish unique configurations and legacy systems. Together, Recipes are fully responsible for describing what your infrastructure comprises of and how each portion of your infrastructure should be deployed, configured and managed.

    The Chef server holds up all the recipes as well as other configuration data. Now the Chef client is installed on all the nodes in your network. As explained before these nodes can be a physical server, a virtual server or a container instance. The Chef client at regular intervals polls the Chef server for the most recent recipes and examines whether the nodes is in compliance with the policy defined by these recipes. If a situation arises where a node is outdated then the Chef client runs them on the node so as to bring it up to date.

    chef-fig2

    Fig 2

    Conclusion:

    Through Chef you will be able to:

    • Manage servers by writing recipes.
    • Integrate tightly with applications, databases and more.
    • Configure applications that require knowledge about your entire infrastructure
    • Create perfect clones of QA environments, pre-production environments, partner preview environments and more.

    Chef is evolving fast and taking your first steps with Chef can be a little bit daunting. Chef comes up with new concepts to learn and best practices to understand. Chef provides you help with the infrastructure management and solves complicated problems.

  • IBM’s DevOps Journey

    IBM’s DevOps Journey

    Companies that want to better address market demand and more efficiently deliver value through speed, quality, and agility are embracing DevOps. This includes retailers, insurers, defense contractors, and most certainly software makers.

    Consider the DevOps journey within the IBM Software Group, which is unarguably larger than most enterprise software groups: currently 519 major software product titles, 36,000 software engineers, 116,000 virtual machines supporting development and testing, and 44,000 physical servers. “This is DevOps at scale,” said Matt Ellis, vice president mobile and cloud DevOps at IBM, recently at InterConnect 2015.

    Getting teams and processes of that size – while cutting waste associated with outdated ways and duplicate toolsets – is no easy feat. But if it can be done, the benefits are substantial. For IBM, the efforts do appear to be paying off – if the results recently shared over the past six months at the DevOps Enterprise Summit 2014 and the IBM InterConnect 2015 conferences are any indication.

    According to Dibbie Edwards, VP DevOps for hybrid, continuous engineering and application lifecycle management development at IBM, IBM has gone from spending about 58% of its development resources on innovation to about 80%.

    What did that shift in focus do to IBM’s time frame? In 2008, IBM’s time to project initiation took 30 days. That was reduced to between two and three days in 2014. Groomed backlog was reduced from 90 days to one day and sprint test times from five days in 2008 to 14 hours today. Overall time to development went from 120 days to three, with time between releases reduced to three months from 12.

    “IBM is seeing the value of DevOps, and as you heard themes through each one of those sessions, it’s really about speed,” said Edwards at the DevOps Enterprise summit this past fall. Speed has always been important, to be sure, but with the rise of cloud, analytics, mobile, and social, it’s become more important now than ever.

    How did IBM begin its DevOps journey?

    According to Edwards, it was systematic. The teams examined the work they were doing: all of their processes – from how they worked with their business stakeholders to how they were working with clients – and eliminated all of the inhibitors and friction points. It hasn’t been a swift journey – a couple of years – but it has been a meticulous one.

    According to Edwards, during her talk at the DevOps Enterprise Summit 2014, Real-life Experiences Leading Large Organizational Transformation at IBM, the software group focused on uncovering every manual process that it could – things such as how the tests were being created, building more efficient testing tools, and building a page object framework in selenium that its developers could leverage. “That framework itself has allowed us to more than double the number of automated test cases that we have,” she said. “That very significant ability gave us the option to do our function verification testing alongside our development.”

    With manual inefficiencies identified and senior leadership agreement to prioritize how processes would be improved and how much will be invested on clearing technical debt, the IBM Software Group then had a foundation on which it could build development processes based on DevOps principles and current business objectives. “We proceeded to build a groomed backlog based on those business priorities and on the size of the development work,” Edwards said. “And if the teams came up against work that they didn’t understand, they would run an exploration phase within their sprint to better understand what needed to be implemented.”

    With that groomed backlog in place, IBM could then make more informed decisions at the end of each development sprint – and even pivot, if needed. “If we had a customer need or a business change where we need to shift the focus of the individual teams, we had the flexibility to do that,” she said.

    That ability to pivot had been a big benefit for the IBM Software Group. “I recall just how many times we would just churn over these decisions and remake them and make them again,” she said.

    Continuous Testing Automation

    The culture at IBM has moved to full automation ahead: everything should be automated, and it’s an exception if it isn’t. “I think this is so critical. I saw a real shift in our team as it started to see the value of this and recognized that doing things manually just was not acceptable and really not sustainable, given the level of speed that we were trying to achieve,” says Ellis.

    Previously, IBM completed testing in following sprints, because testing teams just could not keep up. Getting to this point was an effort that took focus on continuous improvement. “One thing I always share with the team is how critical learning at the end of each one of our sprints is. And then planning for the next sprint to eliminate the friction points and the areas where we were less efficient than we should have been,” she said.

    Finally, IBM automated the testing of its more complex customer usage scenarios. “It literally used to take my team 30 hours to set up an environment to do the testing because we did everything manually,” she said. “We would have to set it up, break it down, and reset it up, because we had all the different databases configurations. By using patterns and automation, we were now able to deploy automatically within three hours.”

  • The ROI of Enterprise DevOps

    The ROI of Enterprise DevOps

    Ever since the 1996 film Jerry Maguire, I can never think about any technology development without hearing Cuba Gooding Jr as professional footballer Rod Tidwell screaming out, “Show me the money!” So I was not surprised when the CIO of a large enterprise recently asked me the enterprise exec version of that famous line:

    Q. Where is the ROI in Enterprise DevOps?

    Fortunately there is plenty of evidence to show enterprise executives exactly where to look when trying to determine the ROI of DevOps.

    “Show me the money!”

    Here on DevOps.com, Rajat Bhargava has posted on talking to your CFO about DevOps, outlining four key areas of financial impact: generating cash, reducing expenses, enabling growth, long-term stability. I also had some ideas about financial aspects of getting executive support for DevOps in a great article by Erica Chickowski. And site editor Alan Shimel has posted some excellent insight on vendor-sponsored research from IDC on the cost-benefit of downtime avoidance.

    “Show me the money!”

    Not enough? Well, we also have several years of research on ROI factors associated with DevOps adoption in both small businesses and large enterprises. The company I work for, CA Technologies, has commissioned independent third party research into enterprise DevOps adoption since 2013; Puppetlabs has run similar research [PDF] with good data on all sized organizations, but especially mid-sized businesses.

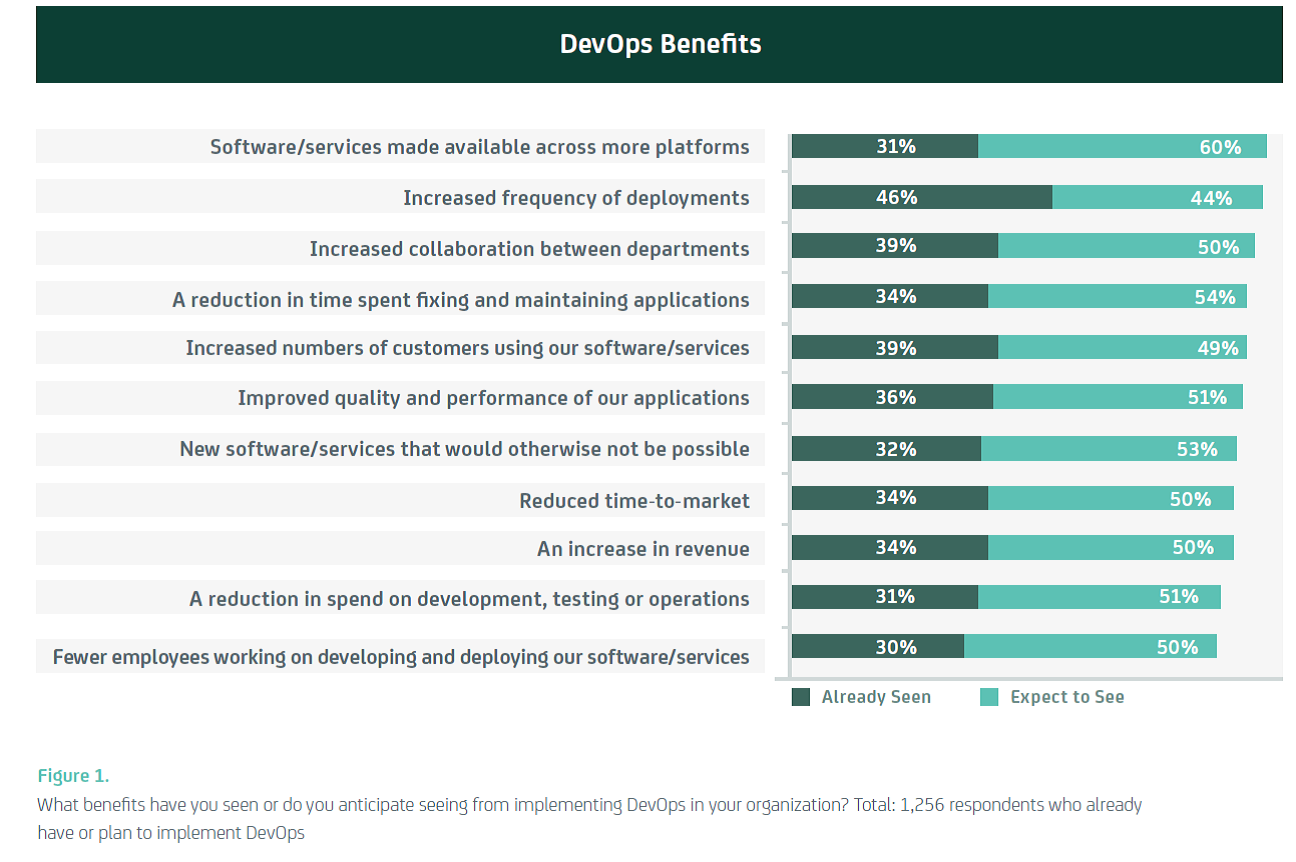
    You can see in the chart below the areas where benefit accrues through the adoption of DevOps (taken from CA Technologies/Vanson Bourne research released in November 2014):

    Image 1

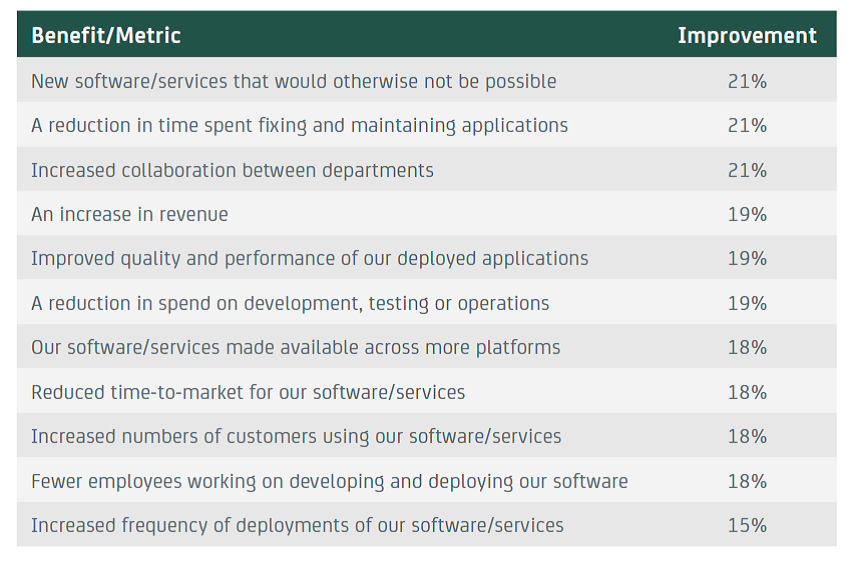
    Still need more? No problem! There is also good data on how much of a return you can expect from DevOps. Again, the following chart is taken from the same CA Technologies/Vanson Bourne research:

    Image 2

    Figure 2 Respondents report seeing double-digit improvements in key technology and business areas. Total varies by benefit. Figure 1 & 2 Source: Vanson Bourne/CA Technologies 2014

     “Show me the money!”

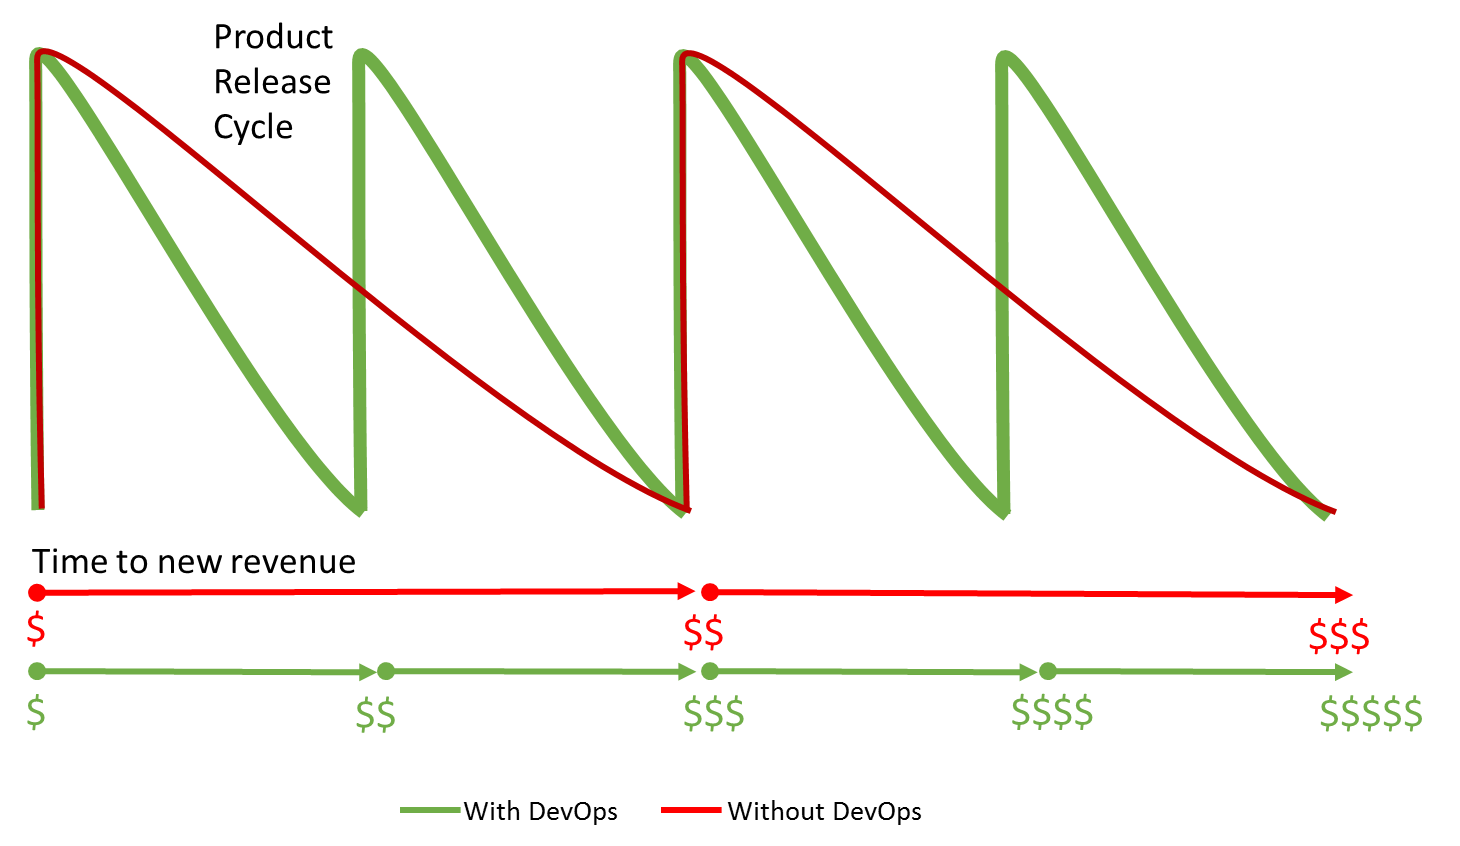
    Okay, I get it – you still want more, and you want a straight answer – a single, simple heuristic to work with. In talking with many enterprise CxOs, faster application delivery is a pressing goal, so just this one factor can act as a key ROI driver. At the Continuous Delivery (CoDe) conference in Copenhagen in October, Jan Bosch (Professor of Software Engineering at Chalmers University of Technology) showed very elegantly how faster delivery acts to reduce (i.e. shorten) the ROI period.

    His theory is based on the premise that for many (most? all?) businesses, time to revenue is dictated substantially by product release cycles. Maximum revenue accrues around product release, then tails off before spiking again for the next new product release. For example, a smartphone manufacturer will get revenue in 6-month peak and trough cycle as they release a new device twice a year; a software vendor will get a revenue peak with a new game release, which tails off until new DLC is released or a new game hits the stores.

    Because DevOps can accelerate business cycles, Jan theorized, business can bring in revenue faster, which in turn makes a DevOps-based business more profitable over the mid- to long-term. This is especially critical in the modern application economy where almost every business is a software business.

    So, for example, if DevOps allows a business to release twice as fast, they can effectively double their annual revenue, as seen below.

    Image 3

    Figure 3 Proportional revenue acceleration from doubling product release frequency with DevOps

    The impact is exaggerated for this illustration, but based on actual data (see above), a 20% increase in annual revenue would be on par with enterprise averages.

     “Show me the … costs!?”

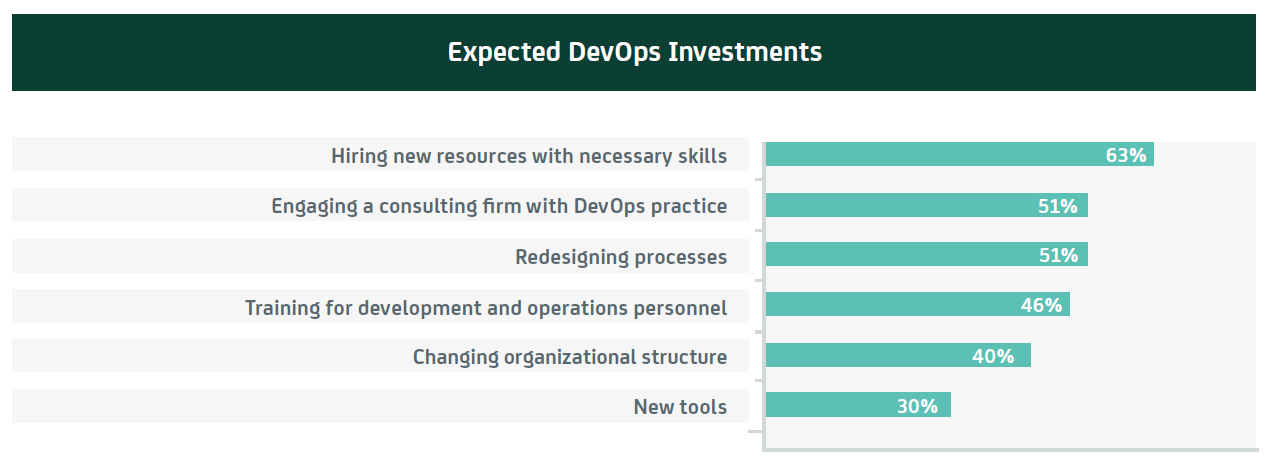
    Of course, any discussion of ROI must realistically reflect costs too. Adopting DevOps in a large enterprise is not free – it requires investment in people, process, and technology. On the people side, even just a small cultural change often requires new activities and other behavioral shaping. Process change requires training and often impacts short-term revenues. Technology investment includes procurement of automation and measurement solutions – key components of a CAMS (Culture, Automation, Measurement, and Sharing) approach to DevOps, especially in a larger enterprise.

    Many of the investment factors can be seen in the following chart, again using CA Technologies/Vanson Bourne research:

    Image 4

    Figure 4 Which of the following is your organization likely to invest in over the next year as part of your implementation of a DevOps methodology? Total = 499 ITDMs who have already or plan to implement DevOps in the next two years. Source: Vanson Bourne/CA Technologies 2014

     “Show me … my own ROI!”

    These ROI factors are of course a combination of averages, research data points, and anecdotes. As with all generalizations, when it comes to a specific enterprise your mileage may vary. However, this is certainly a good starting point when building a business case to prove the expected ROI for your organization.

    You may find other areas for ROI too – upstream in the PMO, DBA, or downstream in NetSec, training, documentation. If you have additional data points on finding the ROI for DevOps, I would love to hear about it. Add your ideas here in the comments, or connect with me and/or DevOps.com on Twitter – at @AndiMann and @DevOpsDotCom respectively.


  • Q and A with Carmen DeArdo: DevOps at Nationwide

    Q and A with Carmen DeArdo: DevOps at Nationwide

    Just before the IBM Interconnect show in Las Vegas last week, we had a chance to speak with Nationwide’s Carmen DeArdo and talk about some of the challenges he has faced at Nationwide as DeArdo and his team work to bring DevOps and Agile principles to their delivery value stream.

    DeArdo is no stranger here at DevOps.com, and recently shared his column Nationwide banks on DevOps to drive towards Continuous Delivery. At Nationwide, DeArdo is the director of application development tools and technologies. DeArdo is responsible for driving continuous delivery utilizing DevOps, Lean and Agile techniques across mobile, distributed, mainframe and other technologies.

    Here, we interview DeArdo on the importance of transparency into DevOps processes and the importance of attaining efficiencies throughout the delivery value stream.

    DevOps.com: Talk to us about how, as you optimized certain aspects of your delivery value stream, you found wait states in other areas of the chain created delivery backlogs?

    DeArdo: If you actually look at the entire delivery value stream, we started out optimizing the middle because we started with Agile design, development and acceptance testing. We gained a lot of benefit out of that. If you take a step back and think about your entire delivery stream, and your continuous delivery efforts, what you realize is that on the upfront process you end up with wait states and lack of visibility flow at that end.

    What is happing is that as your teams get better, they actually run out of things to do. There’s nothing for them to pull forward anymore.

    Then, on the downstream side of delivery, you still have the issues through your path to production – especially if you have managed test environments. You still have manual processes, manual testing steps in deployment. Even if you’ve automated some of them, you still have manual processes. And you end up moving at the speed of the lowest common denominator. What you find is that you’re going to get diminishing returns now unless you start to address those wait states or contention points on either side of design, develop, and test.

    These inefficiencies, on the planning side, start to bleed back into the business. Many times your business areas still have a fixed mindset in terms of their budget and yearly cycles. They’re not used to determining how to continuously feed high priority work into the backlog of your Agile teams. And then on the other side of the pipeline, how can you take what’s being produced by these teams and move that more quickly into your path to deployment?


    DevOps.com: That’s interesting. Your challenge is taking your continuous deployment and continuous improvement mindset and then feathering that into the annual and quarterly planning mindset of the business?

    DeArdo: On one side, what you’d like to have is more of a continuous planning, continuous flow so you’re not dumping a lot of stuff in a bursty way onto your teams. They’re going from wait state to being overburdened. You don’t have that continuous flow. And then on the downstream side, how do you start to automate some of the things and get rid of some of those manual practices? We’re very good at deploying to our continuous integration and deployment to our dev environments.

    But then beyond that, things tend to get bogged down. We sort of go slow at the beginning and slow at the end and go very fast in the middle. Well, if you’re going to improve your overall speed, you need to look at those beginning and end spots and say, “How can I try to address those?”


    DevOps.com: To improve throughput throughout, it sounds like you need more feedback, more planning throughout the year with the business.

    DeArdo: There are a couple of things we need to do, and part of it is around driving more towards continuous planning. The other side is about of having an automated deployment capability. Giving the business more capability, it goes faster if it makes sense from a risk and value capability perspective.

    We’re actually focusing more on that latter part right now. We are building this automated delivery pipeline, which starts with release planning and then goes all the way through deployment.


    DevOps.com: What are some of the high-level challenges that you’ve had optimizing that last mile phase?

    DeArdo: I think one of the biggest challenges, although people like to talk about tools, is is around the variance in your own processes. If you have too much variance in your own process, then you don’t want to instantiate that into a tool because all you’re taking is a bad current state and making it a permanent current state.

    So we have meetings with vendors. The last one we had, we’re pretty far along this path, but the last one we had, we probably spent 90% of the time just talking about the variance in our own process and the fact that it’s not one-size-fits-all, but you have to have a small number of patterns that you’re trying to instantiate and implement. You have to be able to tell the difference between business value-added variance and waste variance.

    I sometimes quote “The Wizard of Oz.” It’s like are you a good witch or a bad witch? Are you good variance or are you bad variance? Everybody wants to think what they’re doing differently has value, but in reality, most of it is arbitrary. There might have been a good reason for it at one point, but at this point, there is no value add in having that variance.

    One of the variances we have is our path to production: what environments, what phases and things like that. One pattern might be an urgent need to get a business capability out very quickly. So I have a certain environment, a certain way to get certification in an expedited way. It’s not about going through an environment. It’s about proving that you have the quality that you need to deploy.

    That one pattern might have a lot of automated testings run in one environment that you can get to very quickly to certify the quality and then release it. Another pattern might be around a record keeping system which is managing financials. You just have things that you have to go through. The system will have dependencies. So you’re going to go through a more elongated path to production.

    That’s just an example of two patterns you would use based on a technology and a business need, not just because I’m in Organization A versus Organization B or Organization C. I don’t care what organization you are, if it fits this pattern and this technology, if it fits this pattern, use that and then if it fits this other one, use that. Those are good variances based on the fact that there’s a business need. There’s a technology driver that defines how you’re going to deploy.


    DevOps.com: That is an excellent explanation. I think many people get caught up in their “one right way” of doing things and have a tough time looking objectively at alternative ways.

    Let’s talk about your “hidden factory” metaphor. Is the “hidden factory” a metaphor for a lack of transparency into different areas of IT?

    DeArdo: Right, and the fact that you really don’t have a model. You have views. One of the things I point out is that you have a business development view, you have a project planning view, and you have release metrics, project metrics, and you have a release view. You have a path to production. None of that is visible. Some of it is hard to find. Some of it is visible if you’re in the tool of choice. But there is no visibility and no linkage or integration of that as you move from putting in your business needs at one end and seeing the code moving into production at the other end.

    DevOps is about shining the lights on that. My view is you can’t manage what you can’t see. Another example sometimes I use is a basketball coach. Let’s assume you’re a basketball coach but you’re not allowed to watch the games. What you get after every game is a score sheet. It has the score. It has maybe your shooting percentage and turnovers, assists, but that’s it. Now you have to practice for the next game to work on improving something. Well, how do you know what to improve? So let’s say your shooting percentage was low, assuming you have enough metrics to know what low is.

    Maybe your shooting percentage is bad. Maybe you think, “I’m just going to practice shooting.” Well, maybe that’s not it. Maybe the wrong people took the shots. Maybe you took contested shots, bad shots. There are a number of reasons you can have a bad shooting percentage, none of which have to do with the fact that you have bad shooters.

    But that’s sort of the way we manage IT today. We’re asking executives to manage things they can’t see based on a set of metrics, but they don’t really watch the game.

  • Functional Testing for IoT

    Functional Testing for IoT

    The Internet of Things (IoT) is becoming a bit more than a fun three letter acronym. And while internet connected devices have been around for a while, turning it into a practice is an important evolution. It allows the establishment of best practices, better integration into standard software development, and thus more robust applications, sometimes too robust. And because software drives everything, and software quality is key. How can you ensure quality in all those connected devices?

    (more…)

  • Comparing DevOps to traditional IT: Eight key differences

    Comparing DevOps to traditional IT: Eight key differences

    You can make the argument that in the Software Delivery Life Cycle (SDLC) value is created in two places.  First, when the software is created (development) and second, when the software is delivered to the customer and feedback received.  The rest is transportation.  The faster one can move code from the hands of the developer to the customer and receive feedback, the more value can be realized by both.  Don’t get me wrong, there is benefit to various “transportation” activities (testing, QA, staging etc.).  But those are not value creating activities, they are risk mitigating processes.

    A DevOps organization understands this value equation.  They focus on the processes that add value, organize themselves around those actions and do the best to minimize the risk.  Traditional IT gets it too – at least conceptually.  However they treat all stages in the SDLC with equal importance or worse emphasize the wrong stage(s).

    In general, when comparing DevOps organizations to traditional IT, DevOps will have policies and practices that differ from those of traditional IT along the following eight key dimensions,

    mustafa

    Planning & Organization

    1. Batch Sizes: Go from Big to Mirco

    Traditional IT has a bias for going big and for good reason.  First, most development shops grew out of the waterfall method which by its inherent nature takes a lot of time.  Second, since releases are costly and disruptive, operations allows developers only a few windows a year to release software.  And third, its simply not sexy – doing big is how you get promoted.  As a result, development organizations maximize productivity, by planning big projects, that involve a lot of code, bundled (hastily at times) into a release, and jammed into production.

    A DevOps organization takes the opposite point of view and believe that small is beautiful.  They understand that large batch sizes are inherently complex, risky (since there are so many moving parts), and hard to coordinate.  Small batches sizes, on the other hand, are simple, easy to understand and test rigorously, and less risky.  If things go wrong the impact is minimal and it is much easier and faster to fix.  In other words, by going small organizations are able to perform more frequent releases and become more responsive to the customer. 

    1. Organization: From Skill Centric Silos to Dedicated Cells

    Traditional IT is organized around skill centric silos.  For the most part silos work, they band like skills together, drive greater utilization, and benefit from economies of scale.  However, where these “cost optimized” silos break down is at the hand offs.  In a typical IT environment, a new feature has to go through at least 3 – 4 silos before the customer gets it.  It is not uncommon for an idea / code to spend 80% of its time waiting or ping-ponging back and forth between silos.

    A DevOps organization also operates in a silos but at a different cross section.  Here teams are arranged in “cells”, consisting of dedicated cross functional teams, and focused on only one application.  By creating this self-sufficient cell that consists of developers, testers, business analysts, and operators, an idea can move from one stage to another without hand offs, promotes cross-training / understanding (key to collaboration), focuses the team on the end goal, and encourages the “shift left” thinking.  As for utilization and scale benefits, the rules for response states that for every ¼ reduction in cycle time, productivity will improve 2x, and operating costs by 20%.

    1. Scheduling: Centralize to Decentralize & Continuous

    Efficient scheduling is at the heart of a Traditional IT organization.  Since resources are pooled, projects are usually clamoring for access to SMEs and / or infrastructure.  To get around this, enterprises have invested in sophisticated scheduling planning systems.  And while these systems are quite sensitive, they are inherently inaccurate, take up to much time to manage, and in some cases become the very bottleneck that they are trying to alleviate.

    In a DevOps organization scheduling is pushed to the local cell level.  The combination of smaller batch sizes, dedicated teams, and automated processes makes scheduling more simpler to operate. How? First, forecasting is limited to the very near future (2 – 3 weeks) where the teams have better insight.  Second, there is no fighting for people’s time since it is a dedicated team.  Third, there is no waiting for infrastructure since it has already been defined and automatically provisioned.  And fourth, it eliminates time consuming loop backs to management for escalations and decisions.

    Performance & Culture

    1. Release: Turn a High Risk Event to a Non Event

    In a Traditional IT organization, releasing software into production is a high risk proposition.  It is fraught with issues, escalations, and constant fire-fighting.  The process is tightly managed, governed from the highest levels, and requires participation from all parts of the organization.  It is not uncommon for IT to set up war rooms staffed 24×7 for weeks before and after the release.

    DevOps organizations, on the other hand, make the release of software into a non-event much as possible.  They reduce risk by daily integrating code into the trunk, automating testing, ensuring all environments are in sync, reducing batch sizes (as mentioned above) etc.  In other words, they only promote code from one stage to another after they are confident that it will work in production.  Thus eliminating all the hoopla about release windows and they are able to move new functionality into production at a much faster clip.

    1. Information: Focus is on Dissemination vs. Actionable

    Both types of organizations generate and share a ton of data.  The difference lies in how the teams uses data.  In Traditional IT, information is generated by specialists (e.g. operations team), bundled together with other data into a massive report, goes through management approval, is then shared with other managers, who then send it out their specialist (testers, developers etc.).  In most cases the report goes unread, simply because there is too much data, not timely enough, and / or not the right data.  In other words, information is shared but poorly consumed, and rarely used to take any actions.

    Within a DevOps organization, it’s the team cell that gather and creates the data.  Since the data is to be consumed locally they only collect the data (also automated) that the team deems is necessary.  And since the data is processed within the team, it eliminates the time lag of creating lengthy reports, manager approvals, and queue time (sitting in some ones email box).  As a result, the team is quickly able to read and react to the data – resulting in faster feedback time.

    1. Culture: Do Not Fail vs. Fail Early

    Traditional IT is fundamentally a risk averse organization.  A CIO’s first priority is to do no harm to the business.  It is the reason why IT invests in so much red tape, processes, approvals etc.  All focused on preventing failure.  And yet despite all these investments, IT has a terrible track record – 30% of new projects are delivered late, 50% of all new enhancements are rolled back due to quality issues, and 40% of the delay is caused by infrastructure issues.

    A DevOps organization is risk averse too but they also understand that failure is inevitable.  So instead of trying to eliminate failure they prefer to choose when and how they fail.  They prefer to fail small, fail early, and recover fast.  And they have built their structure and process around it.  Again the building blocks we have referred to in this article – from test driven development, daily integration, done mean deployable, small batch sizes, cell structure, automation etc. all reinforce this mindset.

    Measure

    1. Metric: Cost & Capacity to Cost, Capacity, & Flow

    Silos work for Traditional IT because they are directly tied to its measurement model – cost and capacity.  IT is measured on how much can it get done (capacity) for the least amount of money (cost).  It is no wonder that cutting cost, while trying to keep capacity constant, has been all the rage in IT over the last two decades.  It’s one of the reasons why outsourcing became so popular.

    And while this model works great for stable legacy applications, the newer “system of engagement” applications require an additional metric – the element of time.  DevOps organization understand this paradigm shift and have added “flow” as an additional metric.  Flow forces an organization to take a look at its end to end cycle time, identify areas of waste, calculate true productive time, quantify quality, and focus on activities that add the most value.

    1. Definition of Done: “I did my job” vs. “it’s ready to deploy”

    Another source of measurement difference is in how the two types of organizations define done.  In Traditional IT, done is defined as the specialist doing “just” their part and handing it off.  In essence, their done is more focused on meeting the hand off deadline vs. making sure what is done is deployable.  This varying definition leads to some bad habits such as sub-par work, quality loss, finger pointing, and an overall sub-optimized process.

    To get way from the finger pointing mentality is another reason why a DevOps organization prefers to create a dedicated cross functional team.  With every member of the various parts of IT represented in this “cell” structure and all of them being held accountable for one and only one thing, they all end up having just one definition of done – bring quality software to market.

    If you would like to learn more about this topic, please join me at IBM InterConnect 2015.  I will be hosting several workshops on DevOps.


    About the Author/Mustafa Kapadia

    Mustafa KapadiaMustafa Kapadia is the Service Line Leader for IBM’s DevOps practice, a business advisory practice focused on helping large enterprises transform their software & application delivery.  He has over 17+ years of experience in the tech. space, both as a service provider and a management consultant.

    Prior to joining IBM, Mustafa was a management consultant with Deloitte’s Strategy & Operations practice. He lives in San Francisco Bay Area, is an avid blogger (when time permitting), a speaker, and adviser to start ups.

    Connect with Mustafa LinkedIn| Twitter

  • The real cost of downtime

    The real cost of downtime

    Stephen Elliot and the IDC team recently released a report (registration required) sponsored by AppDynamics that examines the true cost of downtime and infrastructure failure, as well as DevOps adoption. The headline numbers are pretty eye-opening:

    • For the Fortune 1000, the average total cost of unplanned application downtime per year is $1.25 billion to $2.5 billion.
    • The average hourly cost of an infrastructure failure is $100,000 per hour.
    • The average cost of a critical application failure per hour is $500,000 to $1 million.

    Let those numbers just sink in a moment. Between $1 to $2.5 billion lost to application downtime a year!  That is a big number, but if you look at the follow on numbers you can see how you can get there. Infrastructure failure has an average hourly cost of $100k per hour, critical application failure has an average hourly cost of $500k to $1m per hour. It doesn’t take a lot of hours for those numbers to add up. You can read in the report the actual math IDC applied to reach these conclusions based on the responses to a survey they undertook.

    There was also some good insight into DevOps and DevOps tools adoption.  Remember this was aimed at the Fortune 1000 market segment, so large enterprises. About 43% of respondents were using DevOps currently, with another 40% planning on adopting DevOps soon. That 83% number is in line with another recent survey by CA that showed an 88% number.

    But all is not as rosy as that picture paints.  When looking at the biggest impediments to DevOps, the usual suspects rear their ugly heads:

    • Cultural inhibitors – 56.7%
    • Fragmented processes – 43.3%
    • Lack of executive support – 26.7%

    All three of these topics have been the fodder for stories here on DevOps.com. There are specific strategies to overcome each of these, but the fact is they are still major obstacles to successful DevOps adoption despite overwhelming desire to do so.

    There was another interesting metric in the study that bears noting as well. It is about companies who try to use their existing tool sets in a DevOps setting. There is something like an 80% failure rate for companies who try to adapt their existing tools for DevOps practices.  That screams out something that many a man already knows, “you need the right tool to do the job right.”  The moral of that story is if you are going DevOps you damn better be buying some DevOps specific tools to get the job done right.

    Again in line with other surveys I have seen the biggest initiatives driving DevOps adoption are:

    • Automation 60%
    • Continuous delivery 50%
    • Continuous integration 43.3%
    • Automated testing 43.3%
    • Application monitoring/management 43.3%

    DevOps was being initiated by slightly more development teams that IT Ops teams by about a 40% to 33% margin respectively.

    You can download the full report from the link at the top of the story to get the rest of the data.  Ultimately like similar surveys there are some assumptions that you have to swallow in order to give credence to the findings. For me the biggest grains of salt to consider are:

    1. This survey was based on a relatively small amount of respondents. On average like 50 per question and some of those not from organizations in the scope of the survey. With that small a group trends could be skewed by a handful of outlier responses.
    2. While IDC is a very reputable company, the fact is this was a sponsored survey by a DevOps tool vendor. AppDynamics likewise is a reputable company (and in full disclosure a sponsor here at DevOps.com), nevertheless it is something you should take into consideration.
    3. Perhaps the biggest grain is: Do you buy their math in calculating downtime? According the report’s authors here is how they arrived at their numbers:

    To examine application downtime impact per year across the Fortune 1000, we conducted the

    following analysis:

    • 1,000 companies multiplied by an average of 250 critical applications per company equals 250,000 total applications. 250,000 multiplied by an average of $500 to $1 million per hour of downtime cost equals $1.25 billion to 2.5 billion of unplanned application downtime costs per year.

    That sounds like back of napkin stuff to me. But really at the end of the day whether the number is $1b, $2b or more, suffice to say it is a big number.

    Surveys like these continue to contribute to a broader understanding of the DevOps market. It also provides cover to IT executives seeking support to kick off DevOps in their own organizations. Hopefully we are approaching a critical mass of data that will make the job of “selling” DevOps up the org chart an easier sell.

    UPDATE:

    Here’s a great upcoming webinar that will include thought leadership from Stephen Elliot, VP of analyst firm IDC on “DevOps and the Cost of Downtime” based on research of Fortune 1000 companies.  Register for it now, here.