Company CEO Joe Duffy said Pulumi Crosswalk for AWS provides a software-as-a-service (SaaS) application through which DevOps teams can automate the deployment of applications on AWS infrastructure using software development kits (SDKs) from Pulumi. The SDKs are based on programming tools such as JavaScript, Python, TypeScript and Go, which most developers already know how to use. That approach eliminates the need for DevOps teams to learn how to employ YAML files or to acquire tools such as CloudFormation or Terraform to deploy applications on AWS, he said.
Pulumi Crosswalk for AWS also embeds the best DevOps processes recommended by AWS directly within its SaaS tools, including patterns for containers and serverless computing frameworks, Duffy noted.
Pulumi Crosswalk for AWS is available on GitHub. It is designed to be integrated with existing Team and Enterprise Editions of Crosswalk that come with support and training provided by Pulumi.
In addition to AWS, Pulumi Crosswalk supports other cloud platforms, including Microsoft Azure and Google Cloud Platform (GCP). The company also plans to provide support for private clouds and leverage Kubernetes clusters to automate deployments across hybrid cloud computing environments.
Duffy noted that despite all the enthusiasm for DevOps, many IT operations teams have been left behind. While much time and effort has been put into unifying backend cloud services, the operational experience in the cloud still revolves around low-level application programming interfaces (APIs) or specialized tools that are challenging for IT operations teams to employ. That situation often creates a backlog of applications for IT operations to deploy. Crosswalk enables IT operations teams to leverage the skills developers have to deploy applications they approve on AWS, he said.
As cloud computing evolves in the age of DevOps, the relationship between developers and the IT operations team is becoming more nuanced. IT operations teams still need to put guardrails in place, but they can’t afford to be perceived as a bottleneck slowing down the rate at which applications can be deployed in the cloud. The challenge IT operations teams must overcome is finding a way to enable developers to self-service their application deployment requirements as much as possible within a set of policy guidelines defined by the internal IT team. That approach will enable developers and IT operations teams to get out of each other’s way.
It may be a while before IT operations and developers find the right DevOps balance that best suits their organizations. Individual teams within enterprises tend to define their own best practices based on the expertise available within the team. Ideally, those best practices are then shared and implemented as appropriate across the rest of the enterprise.
In the meantime, it will be interesting to see how aggressively cloud service providers embrace tools such as those from Pulumi. Cloud service providers have a vested interest in getting as many workloads deployed in their clouds as quickly as possible. They tend to be a little less enthusiastic about anything that makes it easier to move those workloads anytime a DevOps team sees fit.
DevOps teams seeking to step up their mojo in developing cutting-edge artificial intelligence (AI) features are facing a big skills bottleneck when it comes to data analytics and machine learning modeling. As a result, the market is seeing an influx of self-service machine learning models and machine learning-as-a-service offerings designed to help development teams more easily integrate AI capabilities into their software.
This is coming in direct response to an explosion in demand for AI capabilities in the enterprise. According to Gartner analysts, AI adoption in the enterprise tripled in the past year. A report last fall from MIT Sloan Management Review and Boston Consulting Group found that 91% of enterprises believe that AI will deliver new business growth to them by 2023.
The trouble is that folding AI functions and predictive analytics into software requires a whole new level of expertise in data science and machine learning from cross-functional DevOps teams. They need added skills to choose the right algorithmic approaches, acquire and manage data, train the models and integrate them into the code base and underlying infrastructure so that everything works properly under the hood.
“We have heard from customers everywhere that they want to adopt machine learning but struggle to actually get models into production,” said Eric Boyd, vice president of cognitive and AI for Microsoft.
Ali Farhadi, Xnor.ai CEO
DevOps leaders today already face an uphill battle to keep their developer ranks staffed with well-trained software engineers. Piling on additional requirements for very specialized machine learning and data science expertise further strains those recruitment efforts. According to the most recent Harvey Nash/KPMG CIO Survey, the top one and two technical realms that suffer the biggest skills shortages today are in data science and AI, with 46% and 38% of CIOs respectively reporting recruiting pain in those areas.
“There’s a huge imbalance between the demand in the market and the supply of the very best AI experience to actually train these models,” said Ali Farhadi, CEO of Xnor.ai, a Seattle firm that just last week released a self-service platform for developers. Called AI2Go, the platform provides pre-trained deep learning models to quickly integrate AI features such as facial recognition and object classification directly into their software.
“We want to enable anyone who can code to benefit from AI,” Farhadi said.
The Xnor release comes just a few weeks on the heels of a big launch from Microsoft of several self-service machine learning model tools aimed firmly at MLOps teams—those DevOps teams implementing machine learning capabilities. The new services from Microsoft roll out capabilities to manage the code, data and environments used by MLOps teams throughout the machine learning deployment life cycle.
“Azure Machine Learning service’s MLOps capabilities provide customers with asset management and orchestration services, enabling effective ML lifecycle management,” explained Jordan Edwards, senior program manager for Azure MLOps, in a blog post on the topic. “With this announcement, Azure is reaffirming its commitment to help customers safely bring their machine learning models to production and solve their business’s key problems faster and more accurately than ever before.”
Tools such as these are not always going to obviate the need for data scientists and machine learning/AI specialists on DevOps teams. As Farhadi noted, even a simple service like AI2Go requires development teams to choose the right models for the right situations. Nevertheless, this burgeoning market could take the pressure off teams by minimizing the scale of specialized recruiting, while reducing bottlenecks and dreaded re-work.
“Machine learning projects usually involve several people—data engineers, data scientists, DevOps and others. Conventionally, at each stage of the machine learning life cycle, most, if not all, of these people end up doing an excess of custom coding, redundant work and manual trial and error,” said Craig Stewart, senior vice president of product management and product marketing for SnapLogic, which last fall introduced a self-service machine learning add-on for its integration platform. He noted that one of the primary goals is speed, to help cross-functional teams “build, train, validate and deploy high-performing models faster.”
I first learned the term “deployment pipeline” when I read “Continuous Delivery: Reliable Software Releases through Build, Test and Deployment Automation,” by Jez Humble and David Farley back in 2009. End-to-end automation of the build, deploy, test and release processes kick in each time a team member commits a change to the source code repository.
Chapter 5 of the book notes that the forms of testing common to all projects include manual test stages which “… assert that the system is usable and fulfills its requirements, detect any defects not caught by automated tests, and verify that it provides value to its users. These stages might typically include exploratory testing environments, integration environments, and UAT (user acceptance testing).”
Humble and Farley include these manual stages in the deployment pipeline, also known as a continuous integration (CI) pipeline, build pipeline or delivery pipeline. However, from what I observe, I think a lot of times people forget about these important manual stages.
Though we can do more and more with test automation, thanks to improving technology, manual testing activities are here to stay in most business domains. My own previous team realized this as we started to move toward continuous delivery (CD) a couple of years back, with twice-weekly deploys to production. Smaller changes and more frequent deploys means lower risk of regression failures. Yet, we still struggled with how to fit in important manual testing activities.
Whenever my cross-functional delivery team has a problem, I look for a way to make it visible, to help us talk about it and brainstorm ideas to solve it. My “aha” moment around manual stages came when I learned techniques to visualize our pipeline from Abby Bangser and Ashley Hunsberger. My team knew we had these manual testing activities and that we wouldn’t feel confident about releasing changes without them, but we weren’t really thinking about them as stages in the pipeline.
Visualizing Your Pipeline – Including the Manual Stages
Figure 1: A Continuous Delivery Pipeline (my diagrams are inspired by Katrina Clokie’s pipeline diagrams in “A Practical Guide to Testing in DevOps”)
Getting your team together to visualize your pipeline is a great method to find ways to improve it. Gather around a table with cards or sticky notes, or draw on a whiteboard—what are all the steps in your pipeline, including the manual ones? In Figure 1, the manual stages in a team’s CD pipeline are shown in yellow. All the automated and manual things need to happen before the business decides to push the button and deploy to production. It’s easy to see that these manual stages can become a bottleneck. Manual exploratory testing is likely to take longer than the automated test suites. If user acceptance testing needs to be done by certain business stakeholders and they aren’t available at the right time, that holds up the release. If the team is looking to move to continuous deployment, where every change to the product goes out to production as soon as all stages complete successfully, these manual stages will be in the way.
When you get your whole team including developers, database experts, operations specialists and product owners involved in solving these problems, you may discover innovative ways to approach them. In my team’s case, we decided everyone on the team needed to help with exploratory testing so we could do it in a timely manner. Testers helped the developers learn exploratory testing skills with hands-on workshops and by pairing with them. Then, each developer pair working on a story was tasked with doing the exploratory testing at the story level before declaring the story finished. We wrote exploratory testing charters at the epic or feature level as stories in our backlog. When enough stories were complete, anyone on the team, including testers and product owners, could pick up those charters.
If we couldn’t complete all the necessary exploratory testing before the next production deploy, we used feature flags to hide the changes from customers until we could complete the testing. We could go ahead and deploy the changes and wait to release them once we felt confident they would not cause any customer pain.
Asynchronous Testing Stages
Using feature flags or toggles is a good way to allow the team to approach some manual testing activities asynchronously, so they don’t hold up the deployment pipeline. If some required manual accessibility, testing takes an extra day to complete or the UAT has to be postponed for a week, the deploy still happens. A change could be toggled on for a small percentage of users and observed in production to see if any unexpected behavior occurs. Whatever activities are needed to safely release a particular change don’t have to hold up other changes that are ready for customer use.
Figure 2: Asynchronous stages in a deployment pipeline
Figure 2 is an example of a continuous deployment pipeline, but this asynchronous approach to the manual stages works for continuous delivery as well. Each time a team member commits a change, if all the automated stages in the pipeline pass, the release candidate build will be deployed to production. The manual testing activities are not inline with the other steps and don’t hold back the deployment.
If we’re ready to deploy a feature but need to finish those manual testing stages before we release it, developers can put in a feature flag set to “off” to prevent it from being exposed to customers. When the asynchronous manual stages are all complete and successful, the feature flag can be flipped on in production. This is the actual release, customers can now use the feature. The feature flag should be removed as soon as possible, as too many feature flags at once has serious risks.
Using feature flags or toggles to permit deploying changes to production before all testing stages are finished is one way to avoid bottlenecks and succeed with continuous delivery or deployment. Continuous delivery and deployment success depend on doing frequent small changes, not big-bang releases. A lean approach to feature flags, keeping the inventory low, is advisable.
Visualize It With Your Team
We’ve looked at one way to keep manual pipeline stages from holding up deploys, but there may be other solutions for your team. And there are lots of other key success factors for CD, such as keeping changes small and frequent. There’s lots to discuss and brainstorm about as your team, or a representational cross-section of it, gets together and experiments with a visual model of your pipeline. Talk about what you need to learn from each pipeline stage, who needs to know it and whether the pipeline is providing actionable feedback.
As a tester, I’ve sometimes questioned aspects of the pipeline that nobody else had thought about. Having team members with development, operations, database and other skills present means more potential for creative solutions. Our pipeline provides a major feedback loop and we want that feedback as fast as we can get it. Writing each stage on a card and arranging them on a table or wall often triggers ideas for parallelizing more stages or realizing a particular stage isn’t necessary or can be done locally by developers.
Automate all the things where it’s feasible. Use the time you save to optimize the way you accomplish manual testing activities and possibly automate more of them. Master techniques such as feature flagging so that you can take the time needed to feel confident about every new feature you release.
References
“Continuous Delivery: Reliable Software Releases through Build, Test and Deployment Automation,” Jez Humble and David Farley, https://continuousdelivery.com
One of the trickier issues IT vendors in the age of DevOps are dealing with is that very few organizations have standardized on a platform from a single vendor. Not only do organizations mix and match tools as they see fit, but different departments within the same organization also embrace different tools to automate the same tasks. That DevOps reality requires collaboration between IT vendors that normally would prefer to not work together, whether they like it or not.
Case in point is a move by CircleCI, a provider of a continuous integration/continuous delivery (CI/CD) platform, to provide integration with the Jira project management software developed by Atlassian. While Atlassian makes its own CI/CD platform, customers and business partners alike have made it clear they needed CircleCI to support Jira, says Tom Trahan, head of business development for CircleCI. In some cases, those organizations have adopted Jira without having Atlassian’s CI/CD platform in their environment, while in other cases, a department within one part of an organization has opted for CircleCI while others are employing a CI/CD platform from Atlassian.
At the same time, Trahan notes that many DevOps projects now span multiple organizations that have standardized on different DevOps platforms. Jira provides a way for teams in differentorganizations to manage those projects collaboratively, he says.
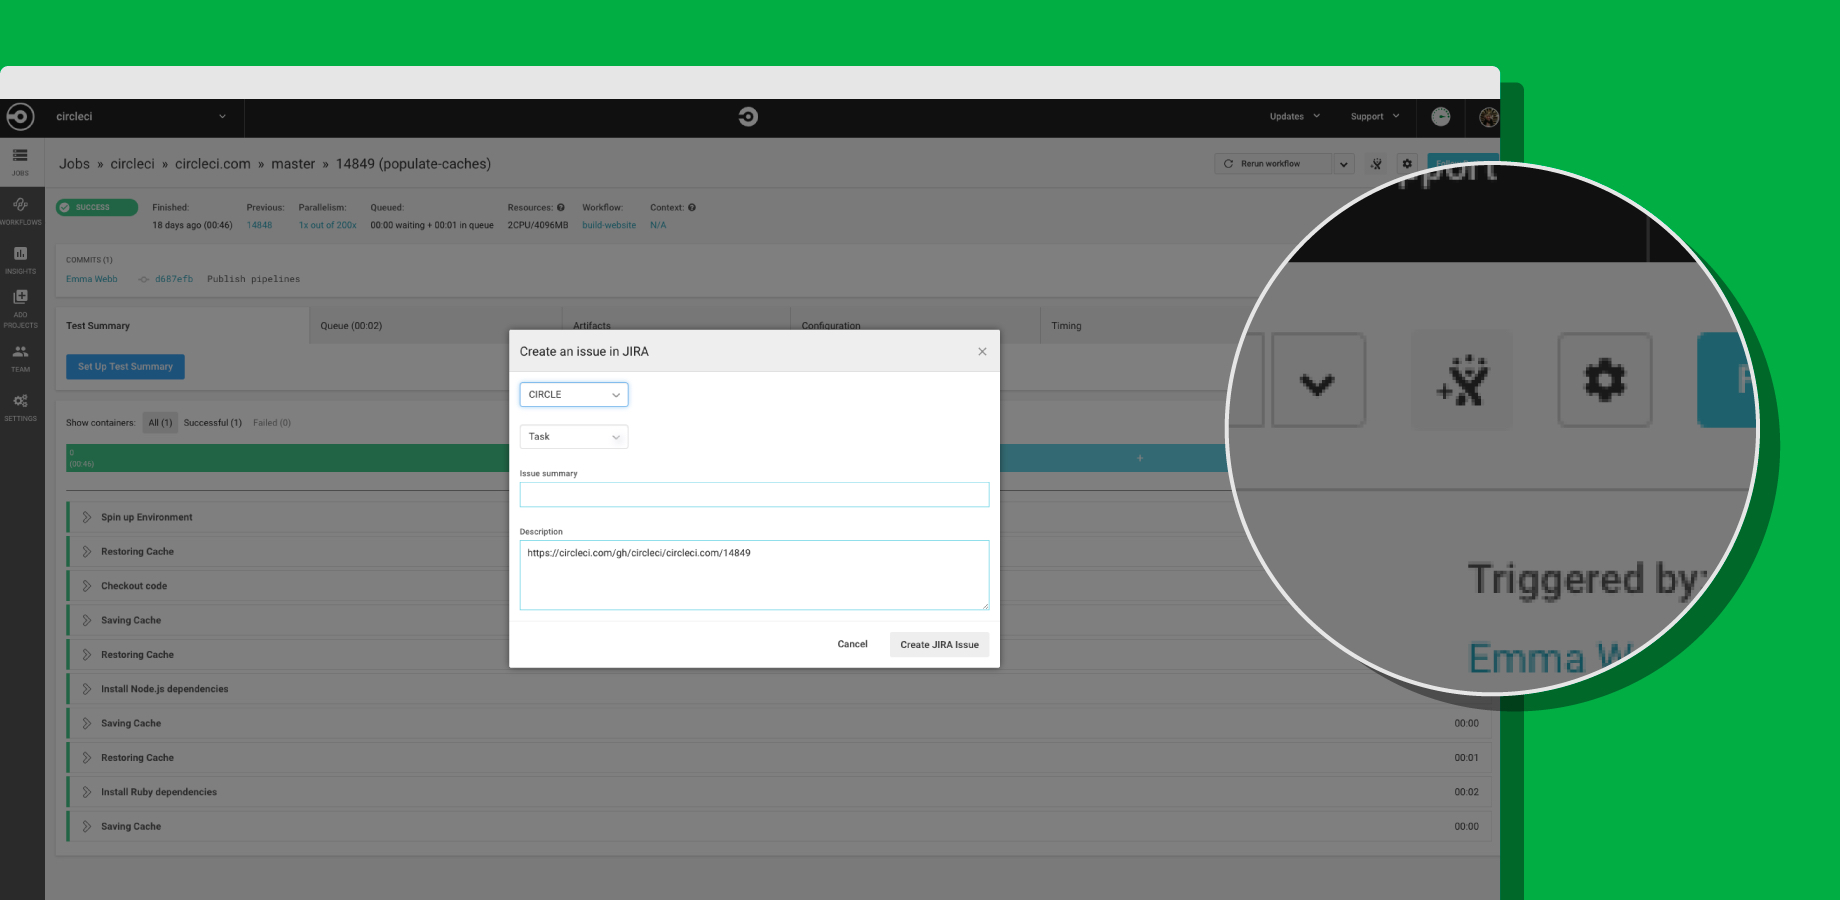
To achieve integration with Jira, CircleCI now offers its CircleCI for Jira module, through which teams can assign new tasks and fixes based on job status with CircleCI orbs, a set of reusable configuration packages that allow CircleCI customers to integrate external tools into their workflow. That capability also makes it possible to launch new Jira issues directly from the job page within the CircleCI user interface.
Trahan says that in the polyglot world of DevOps, it is apparent vendors are being required to expose open application programming interfaces (APIs) that enable organizations to build and integrate various DevOps platforms anyway they want. Organizations won’t consider IT vendors that are too rigid in terms of what level of integration they enable, he says.
As DevOps continues to evolve, it’s clear that a wave of merger and acquisition activity is makeing the IT vendor landscape somewhat volatile. Providers of DevOps tools that organizations have standardized on are being acquired at a rapid rate. IT organizations can’t be certain that any given tool or platform they are using won’t be scooped up by a vendor they might not want to engage. In that kind of environment, it’s critical for IT organizations to leverage open APIs that not only make it easier to collaborate, but also replace elements of their DevOps stack whenever they deem necessary.
The challenge, of course, is that IT vendors are always trying to lock customers in as much as they can. Those efforts are not as heavy-handed as they once might have been. But almost inevitably, the extension being offered to access functionality will disappear if the underlying platform that enables it suddenly disappears. IT organizations, therefore, need to determine whether those extensions are worth any potential trouble they might cause somewhere down the DevOps road.
At its ChefConf 2019 conference today, Chef extended its core platform in ways that collectively serve to automate further the management of applications and the IT infrastructure they are deployed on.
Extensions to the Chef Enterprise Automation (EAS) Stack include the addition of Application Operations Dashboards, Migration Accelerators for moving applications to the cloud and tighter integration between the Chef Infra and Chef InSpec modules within the Chef Habitat management framework.
Brian Goldfarb, chief marketing officer for Chef, said these latest additions to Chef Enterprise Automation Stack are part of an ongoing Chef initiative to make it easier to seamlessly unify the management of infrastructure and applications in keeping with best DevOps practices, which Chef refers to as the “Coded Enterprise.”
As part of that effort, Chef Application Operations Dashboards provide visibility into both applications and infrastructure to simplify troubleshooting and compliance, said Goldfarb. For example, IT teams will be able to see how individual security and compliance controls are performing across a heterogeneous computing environment that now includes Microsoft Azure and Google Cloud Platform (GCP) alongside Amazon Web Services (AWS), he said.
At the same time, Chef is trying to make it easier to lift and shift applications to the cloud. EAS Migration Accelerators automate an application migration process that today requires most organizations to spend considerable time and effort to accomplish manually, said Goldfarb.
An EAS Migration Accelerator for Windows, for example, will scan existing .NET applications running on IIS to discover configuration and dependency details and then package that information as code. That approach significantly reduces the time required to build application packages in Chef Habitat.
Within Chef Habitat, the integration between Chef Infra, for automating infrastructure configuration, and Chef InSpec, a tool for automation compliance, is now more unified via pre-configured compliance profiles and cookbooks that make it easier to customize and modify which security and compliance controls are tested and enforced.
Finally, Chef has also added support for high availability to the EAS platform to make sure the environment is always accessible.
Goldfarb said the goal is to continue to make automation more accessible to IT generalists versus requiring them to hire and train dedicated specialists. One of the primary reasons that DevOps practices have been adopted so unevenly within IT organizations is the bar to master them has been set too high. By making it easier to automate the management of both infrastructure and applications, Chef is moving to lower that bar and make it easier to manage IT by unifying the management of applications and infrastructure, said Goldfarb.
It’s too early to say to what degree IT automation will advance the adoption of DevOps. What is apparent is that IT environments are becoming too complex for mere mortal IT administrators to manage manually. IT organizations are also expected to be able to respond faster to any issues that arise, which requires IT teams to have a unified view of applications and the infrastructure o which they are deployed. In fact, as IT organizations continue down that IT automation path, many of them one day may discover they have embraced DevOps without even realizing it.
DevOps has evolved from its infancy into a mainstream focus area for a majority of CIOs. DevOps has become a main focus and has been shaping the world of software and infrastructure engineering and operations for the last few years.
Some of the key DevOps trends include:
DevOps assembly lines automation.
Smart, actionable alerts from monitoring tools.
Monitor and orchestration infrastructure.
Improved Collaboration
With the increase of DevOps adoption, organizations today face many challenges in the end-to-end service delivery life cycle.
For applications with complex environment configurations, creating, setting up and deploying a new environment is costly, time-consuming and prone to errors.
Due to manual interventions, moving/promoting code across environments involves risks and may give rise to outages.
Development teams are looking to maximize change by writing new code or enhancing existing code, while operations teams are looking to minimize change to keep up with key performance indicators (KPIs) and service level agreements (SLAs). These goals are opposing in nature and create a culture of blame between dev and ops teams.
Organizations are unable to keep dev, test and production in synchronization due to process and tool gaps. A manual process cannot bridge this gap in consistency; thus, outages in production are common.
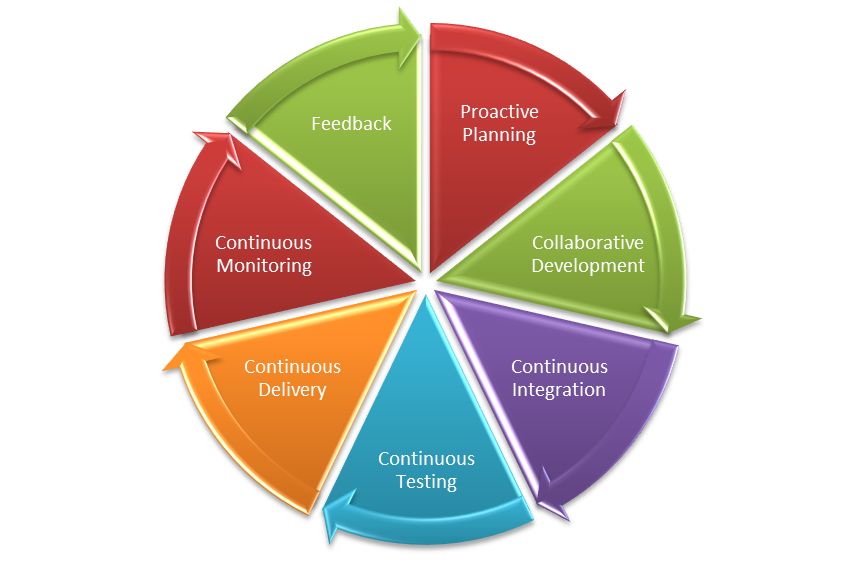
Various collaboration mechanisms let teams work and learn together to produce better results. The figure below depicts the end-to-end life cycle of DevOps. Collaboration across the phases is essential to the success of your enterprise DevOps transformation.
What are ChatOps and Bots?
ChatOps is a term coined by GitHub to describe “putting tools in the middle of a conversation.” In a typical CI/CD pipeline, there are multiple tools that you interact with that have varied functionalities, such as source code management (SCM), defect management, continuous integration, continuous deployment and others. These are all discrete tools, but there is nothing that bridges them together. This is where ChatOps comes into play.
A bot is a bridge between the collaboration tool and the DevOps tools. The bot receives a request from the user in the form of a chat command through a collaboration tool, analyzes the request and executes a set of commands on the target DevOps tool.
The main components of ChatOps and bots are:
Chat app/collaboration tool: This is the front-end chat system that connects the various stakeholders and enables them to interact between themselves and the systems around them.
The bot: This is the core of ChatOps. A bot is the glue between your collaboration tool and your systems. It facilitates a two-way communication channel where you can fetch relevant information from the systems and act on the information received. A bot fits in between your collaboration tool and the DevOps tools, e.g. Hubot, Lita, ErrBot or AWS Lex.
Target platform/infrastructure: Integration with the target platforms/DevOps tools is a key ingredient to a successful implementation of bots. These are the target tools and platforms on which the bot will execute the required commands. The tools integration allows your bot to communicate with tools and execute actions such as build, deploy, test, provision and scale infrastructure directly from the chat window.
Where Bots Fit in the DevOps Pipeline
Bots can prove to be an accelerator in various stages of the CI/CD pipeline. Below are the details of the integration with various DevOps tools in each phase of the life cycle:
Proactive planning – JIRA
Requirements management – JIRA
Continuous integration – Jenkins
Continuous deployment – Ansible, Chef
Continuous monitoring – Nagios, Grafana, Splunk
Continuous feedback – JIRA
A chatbot plays a major role in bringing the different teams together into a single, persistent chat room to triage and resolve the issue at hand. In addition to just troubleshooting and triaging issues, bots can be used for various other business-as-usual jobs including:
Cleaning up servers.
Kicking off build and deployment jobs.
Rotating server logs.
On-boarding application on the monitoring tools.
Collecting metrics from tools such as Nagios or AppDynamics.
Bot Technical Blueprint
To achieve the aforesaid targets, we need to have a supportive bot platform in place. How closely the tools integrate with the bot ensures the quality of the implementation and opens new opportunities of automation. As the diagram depicts, the chatbot is hosted on a chat tool such as Slack. This can be on the cloud platform or an existing chat/communicator application. The bot is integrated with a key-value pair reference database, which is fed with the responses depending upon the activities or capabilities that have been fed to it. The key could be the name of the application to retrieve data from or any unique ID that would reduce the number of reads. A lookup of the defined key corresponding to the secondary key is performed on the response database and a response is sent back to the chatbot. Depending upon the number of outputs, the queries can be defined and stored in the response database.
DevOps Bots: Use Cases
Below are some examples of use cases for bots. This includes the complete life cycle of DevOps:
Proactive Planning Create new user stories in sprint planning tools and assign sprints to teams. Update sprints and product backlogs.
Build and Continuous Integration Execute build jobs and report back statistics of the build job. Perform daily/nightly builds and report on the status of the build to the relevant teams.
Continuous Deployment Run deployment jobs and perform deployments across environments. Roll back deployments in case of failures, status checks, perform post-deployment actions such as JVM restarts.
Infrastructure Provisioning and Configuration Management Kick off Chef jobs to provision infrastructure or provision application environments. Enable monitoring and restarting services and servers.
Continuous Monitoring Provide application statistics or performing daily data lookups and grabbing metrics.
Continuous Feedback Monitor application health and perform analytics.
Key Measurement Metrics
To achieve optimization and enhance performance of the continuous delivery process, metric measurement is the key. These indicators will help in taking certain corrective and preventive actions based on the results. Below are some of the key metrics indicators that can be measured.
Effort Reduction Indicates the reduction of human/manual efforts for tasks such as triggering a build or deployment or collecting metrics from monitoring tools.
Human Error Reduction Rate Reduction in the effort required due to rework caused by human errors.
Reduce Issue Triaging time Indicates the time taken to resolve issues where multiple parties are involved and triaging of problems is required.
Conclusion
DevOps bots can significantly improve team efficiency, as well as a team’s ability to respond to emergencies. They save time and money, are fun to build and use and can have a positive impact on team morale, as well as increases the overall productivity of teams. This applies to both the engineering and operations teams. Enterprises embracing digitization are looking for partners with an engineering mindset who know how to bring in collaborative agile teams with the very latest knowledge of open source platforms and DevOps toolchains.
As enterprises continue to play catch-up when it comes to meeting their internal demand for new software services and applications, more enterprises—but still, only a minority—are turning to low-code development platforms to try to fill the gap.
Low-code development platform provider OutSystems released its sixth annual “State of Application Development Report.” The report is based on surveys conducted in March of 3,300 IT professionals.
The report found that a sizable minority (41%) of respondents are already using low-code platforms, while another 10% stated they were about to start using a low-code development platform. For comparison, in the 2018 report, 34% of respondents said they were using low-code development platforms and 9% said they were about to start using these platforms. Clearly, interest in these platforms is rising, if not modestly.
Low-code development platforms strive to make software development more accessible. They do so by removing traditional coding interfaces with graphical user interfaces. And they typically target development toward a specific functionality, whether that be web applications, business process automation, IoT and, quite often, databases. The low-code development platform market is expected to grow to $27.2 billion by 2022 from $4.3 billion in 2017, an annual growth rate of 44%.
The demand for software has never been higher. According to the OutSystems report, 64% of IT professionals said they have an application development backlog. For 19% of respondents, that backlog is deeper than 10 apps. While 50% said their backlogs have remained the same, 39% report that their app backlogs have improved over the past year.
The time to deliver web apps and mobile apps is mixed. The 2018 OutSystems report found that 54% of respondents took four months or less to deliver a web application. This year, 61% said it takes them four months or less to deliver a web application. Mobile app development has changed a little: 55% on average said they deliver apps in four months or less.
According to OutSystems, enterprises using low-code development platforms are 12% more likely to report that their backlogs have improved year over year.
Those findings echo similar surveys. For instance, a survey released earlier this month from low-code provider Appian found that nearly 80% of its respondents believe that using low-code can free developer time to work on higher-level projects. That survey also found 86% of IT developers agree that emerging technology is increasing the pressure on the IT organization.
One thing is certain, the demand for software isn’t going to let up anytime soon. According to the OutSystems report, the number of applications respondents plan to deliver this year is 60% higher than last year. For those with more than 500 employees, 65% said they had plans to deliver 10 or more apps, 38% plan to build 25 or more apps and 15% said they plan to develop 100 or more apps this year.
Despite the high demand for enterprise software, only 36% of organizations have larger development teams than they did a year ago. However, that’s likely not due for lack of trying to hire and retain development talent. The OutSystems survey found only 15% of respondents described developer recruitment as easy. “For many organizations, retention of developer talent appears to be an equally grave challenge,” according to the report.
With conditions like that, it’s only reasonable to expect low-code development platform popularity to continue to rise.
Enterprises are rapidly embracing a cloud-first strategy and microservices play a pivotal role in this journey. But enterprises are achieving various levels of success, measured by many factors includingmaturity of DevOps in the enterprise, ability to identify the right candidates for microservices, selecting the appropriate container management platform, adequate tooling and, finally, cultural shift in design thinking.
As there is plenty of material around microservices adoption and strategy, this article focuses on the container management ecosystem, which plays a critical role in the success of microservices adoption. Today, Kubernetes has become the de facto platform for container orchestration. Most public cloud providers offer Kubernetes as a service in some form to abstract the complexities of managing Kubernetes as a platform.
Currently, we see three broad patterns of how enterprises are adopting Kubernetes within their organizations.
Pattern 1: Kubernetes as a Managed Service
While Kubernetes makes container management somewhat simple, it is still a complex beast to understand and manage as a platform. Enterprises that have already embarked on a cloud strategy find it easy to test the unchartered waters of Kubernetes by leveraging Kubernetes-as-a-service provided by their cloud providers. It enables them to understand the impact of Kubernetes on their respective application architecture strategy and identify the gaps in their systems (such as the maturity of DevOps management, security management and release management) as well as their monitoring capabilities.
Pattern 2: Kubernetes as a Turnkey Solution
Certain enterprises driven by industry regulations and are technology-focused (with considerable experience in other container technology solutions), have shown interest in setting up Kubernetes as part of a private cloud or on–premises with a view to avoid vendor lock-in and limited control associated with managed Kubernetes. There are many such turnkey solutions out there to choose from.
Pattern 3: Self-hosted Kubernetes Platform
This category is small compared to the other two categories. However, there are a few enterprises that fully embrace the open source software development model and contribute to Kubernetes community. There are tools and frameworks that can enable the enterprises to setup and manage Kubernetes on their own.
There are advantages and constraints in adopting any of the above approaches. The decision regarding which strategy to choose depends on the maturity of the enterprise and their business strategy.
Challenges in Adoption
Some of the key challenges to be considered, irrespective of the adoption pattern selected, include:
Namespace management: Namespaces play a key role in managing the isolation across application domains and environments, providing controlled management of resources and user management. Bounded contexts can be linked with namespace definitions and standards. It is important to define proper naming guidelines to drive namespace management across clusters.
Resource management: It is necessary to define resource utilization (resource quota) guidelines to ensure the containerized applications co-exist without being eliminated due to resource violations at runtime.
Policy management: It is critical to define appropriate policies including cluster access controls, service access controls, resource utilization controls and secret access controls.
Audit and compliance: It is important to audit the platform for patch levels, secret stores, compliance against the security vulnerabilities, encryption of secret stores, storage volumes, cluster policies, role binding policies and user management controls.
Chaos testing your platform: It is necessary to subject the platform to chaos testing to ensure the robustness of the cluster. It also helps to test the stability of the containerized applications and the impact of crashing these containers. It will also provide vital information about how the platform behaves during high loads or when resources are unavailable for the platform.
Managing the deployment manifests: Kubernetes follows declaration-based management, which means that every object or resource instruction is described through declarative manifests. This leads to versioning complexities, prone to human errors and data corruptions. It is necessary to leverage tools or create custom utilities to manage these manifests.
Observability of the platform: While Kubernetes provides various mechanisms to monitor its own internal components, it does not recommend a standard monitoring approach. It is necessary to introduce well-defined health management standards while designing the microservices. Include appropriate probes for liveness and readiness probes in every containerized application deployed on Kubernetes cluster. Integrate the probe-generated metrics and platform-generated metrics with an external monitoring platform to have comprehensive observability of the cluster.
Continuous deployment of services: It is not recommended to use kubectl-based deployments in a large-scale production setup. Instead, use some of the established open source frameworks specifically built for Kubernetes (such as Helm or JenkinsX) to manage seamless deployments.
Archiving and backup: Kubernetes uses etcd as its internal metadata management store to manage the objects across clusters. It is necessary to define a backup strategy for etcd and any other dependent persistent stores used within the Kubernetes clusters.
Container security management: Kubernetes deploys the applications by downloading the respective images from a pre-defined image repository. It is the responsibility of the repository ecosystem to ensure the image provenance of the images being deployed. Continuous security must be included as part of DevOps pipeline to ensure containers are well-managed.
Service mesh support: Service mesh plays a critical role in streamlining the service to service communication. It abstracts the service level access controls and security management between services through externalized policies. It also provides routing and load balancing features. It is necessary to choose an appropriate service mesh that is compatible with the Kubernetes cluster as well as the underlying infrastructure.
Conclusion
Kubernetes makes the container operational aspects simpler, but it requires a methodical approach and best practices to ensure smooth maintainability, as well as seamless developer interaction. For any enterprise which are in a transition journey toward adopting Kubernetes, it is imperative to have a strategy for Kubernetes adoption to ensure success.
Despite the risk of unplanned downtime, many organizations that develop software and services push them live without adequately testing for bugs that will manifest against production traffic. This is a huge gamble: Those bugs could lead to errors that bring down the service altogether. Pushing live without sufficient testing can be detrimental to your business.
The Problem of Going Live With Bugs in the Code
Software downtime leads to loss of revenue and of reputation. In fact, Gartner analysts have estimated that the average cost of downtime is $5,600 a minute—that’s well over $300,000 an hour. To provide a real-life example of what this looks like, Microsoft Azure suffered a major outage in November 2018 caused by issues introduced as part of a code update, lasting for 14 hours and affecting customers throughout Europe and beyond. With migration from legacy systems to micro-environments in the cloud, outages and downtime pose a growing and serious problem.
As companies switch to DevOps and CI/CD models to move faster and provide application updates sooner, software developers continually release new features and often push code updates as fast as they’re written. The classic six-month development timelines of dev, quality assurance (QA) and beta testing have been compressed to days and sometimes hours. Gone is the time when teams could beta test with customers for extended periods to flag real-time bugs.
With current quality testing tools, developers don’t know how a new software version will perform in production—or whether it will even work in production. The Cloudbleed bug is an example of this problem—in February 2017, a simple coding error in a software upgrade from security vendor Cloudflare led to a serious vulnerability discovered by a Google researcher several months later.
Flaws can lead to serious security issues later, in addition to having the immediate impacts mentioned above. Heartbleed, a vulnerability that arose in 2014 and stemmed from a programming mistake in the OpenSSL library, left large numbers of private keys and sensitive information exposed to the internet, enabling theft which otherwise would have been protected by SSL/TLS encryption.
Standard QA Testing Isn’t Enough: Test With Production Traffic
The way QA testing is typically done is no longer sufficient for today’s increasingly frequent and fast development cycles. Traditionally, DevOps teams haven’t been able to do side-by-side testing of the production version and an upgrade candidate. The QA testing used by many organizations is a set of simulated test suites, which may not give comprehensive insight into the myriad ways in which customers may actually make use of the software. Just because upgraded code works under one set of testing parameters, doesn’t mean it will work in the unpredictable world of production usage.
As in the case of the Cloudflare incident, the error went entirely unnoticed by end users for an extended period of time and there were no system errors logged as a result of the flaw. Just as QA testing isn’t sufficient, relying on system logs and users also has a limited scope for what can be detected.
It is estimated that fixing flaws after a software release can be five times as expensive as fixing them during design—and it can lead to even costlier development delays. Enabling software teams to identify potential bugs and security concerns prior to release can alleviate those delays. Clearly, testing with production traffic earlier in the code development process can save time, money and pain. Software and DevOps teams need a way to test quickly and accurately how new releases will perform with real (not simulated) customer traffic and while maintaining the highest standards.
By evaluating release versions side by side, teams can quickly locate any differences or defects. In addition, they can gain real insight on network performance while also verifying the stability of upgrades and patches in a working environment. Doing this efficiently will significantly reduce the likelihood of releasing software that later needs to be rolled back. Rollbacks are expensive, as we saw in the case of the Microsoft Azure incident.
Some organizations stage rollouts, which requires running multiple software versions in production. The software teams put a small percentage of users on the new version, while most users run the status quo. Unfortunately, this approach to testing with production traffic is cumbersome to manage and costly, and still vulnerable to rollbacks. The other problem with these kinds of rolling deployments is that while failures can be caught early in the process, they are—by design—only caught after they’ve affected end users.
This brings more questions, including: How do you know whether the new software is causing the failures? and, How many failures does the business allow before recalling or rolling back the software, since the business does not observe side-by-side results from the same customer? This disrupts the end user experience, which ultimately affects business operations and company reputation. And staging may not provide a sufficient sample to gauge the efficacy of the new release versus the entire population of customers.
Cost is still an issue as well. If you stage with 10% of customers on the new version and a failure costs more than $300,000 an hour, then a failure affecting 10% of users could potentially still cost more than $30,000 per hour. The impact is reduced, of course, but it’s still significant—not counting the uncertainty of when to rollback.
Looking Ahead
Standard QA testing is no longer enough. To reduce the risk injected into the software development life cycle by today’s rapid iterations, DevOps teams can test in production and evaluate release versions side-by-side. This will help prevent costly rollbacks or staging while still releasing a quality, secure product. The old way of doing things is not sufficient, but fortunately, there is a better way.
As Gene Kim, one of the leading thinkers in DevOps, once said, “DevOps is not about what you do, but what your outcomes are.” What he’s telling us is that DevOps is about enabling a rapid flow of work that transitions from development to testing to operations, but the bottom line is that it’s about achieving results. Unfortunately, this too often gets lost in modern-day DevOps practices.
In this article, I will discuss five common pitfalls that occur in DevOps if you don’t pay attention to the endgame and how your organization can avoid falling victim to them.
DevOps and Automation: Measuring the Wrong Outcomes
Some people believe that, at its core, DevOps is about trying to automate everything. But ask yourself this: Once you automate, are you really delivering a better outcome?
The answer is not always yes. While metrics such as deployment frequency or mean time to repair (MTTR) are interesting DevOps indicators, they are no more interesting to determining if your team is delivering actual value than measuring the number of lines of code submitted or counting the number of keystrokes by the development team. You measure outcomes by determining a baseline from where you start and compare that with where you end.
We need to understand that DevOps is about much more than automation; it’s about the entire pipeline and how your team moves from ideation to delivery to production. Even large companies with world-class DevOps teams don’t always clearly see the problem and can struggle managing the value stream and putting together multiple pipelines. An anonymous but real-life example of this is an organization I know that had been doing DevOps for 18 months, yet hadn’t delivered anything into production in that span. Are they really doing DevOps? DevOps is a process, but if it produces zero value, it’s not delivering on its promise.
The key is focusing on delivering value and measuring value delivery into production. However, before you can begin measuring value, you have to define what it means to each individual deliverable. Common metrics include the number of story points, actual revenue from product comparison and customer satisfaction. With your clearly defined metrics in place, you can measure value as it gets delivered to the customer.
DevOps and Fragile Environments
One Achilles’ heel in the DevOps process is the pre-production environments where code gets deployed and tested. Automating a delivery pipeline relies completely on code being built and deployed to various environments. Fragile environments mean that the developers and testers are wasting time dealing with problems originating from the environment and not the code itself.
While we wish all environments could be on-demand; the fact is, most are not. Another DevOps expert, Randy Bias, has an analogy about pets versus cattle in describing servers, and the same analogy can be used for environments. If environments are not standardized and repeatable, you have to be willing to move on from it like a farmer moves on from livestock; you can’t hold onto sentimental attachments like we have with our pets. What’s most important is that in no case can an environment be singular in nature.
One element of the solution is to create code and automate, but the key is building up environments that are complete. Every environment needs proper builds, proper data and proper tests validating the environment. Additionally, the automation must have the stability to perform successfully every time. If you have piece of automation that fails even just 5% of the time, that’s unacceptable.
The only way automation works in an environment is if you can trust the environment. When the environment is unstable, it’s like playing Russian roulette: No one knows exactly where the danger lies. It could be in the environment, the code, the data, the middleware … a number of places. When a problem arises, developers are often the last line of defense, but dealing with an issue such as this pulls them away from getting real work done.
Disconnected Teams
On this point, I’d like to share a warning: Disconnected toolchains lead to disconnected teams. The planning, development and testing teams can lack cohesion, and the release and operations teams often struggle to be on the same page. Each of these groups have their own tools and management, but they need to be able to communicate with each other effectively to make things work smoothly. In an ideal world, planning initiatives would flow into features for the development and testing team, which would flow into release pipelines and operational changes. Every team still can speak its own language, but the tools need to be interconnected and unified across the teams.
Mismanaging Hybrid
The term “hybrid” has many different uses in the software development space. Hybrid methodology refers to combining waterfall, agile and DevOps practices. Hybrid environments means your environment is housed in multiple locations such as the cloud, on-premises, virtual or code. There’s also hybrid geography, hybrid architecture, hybrid style—the list goes on.
The key to transitioning to DevOps is properly managing the different types of hybrid. If you can’t manage hybrid delivery, you can’t manage your entire delivery and you can’t improve your delivery holistically. Organizations must learn to manage in a world of hybrid delivery and be able to handle cloud and on-prem, as well as teams all over the planet.
Fixing Non-Constraints
The Theory of Constraints is about pinpointing the bottlenecks in your process and fixing them. Any work that’s not focused on eliminating the constraint will not result in improvement and could be considered a waste of time.
It’s important to remember that if you haven’t fixed the bottleneck, you haven’t improved anything. At the same time, if you’re automating the non-constraints, you’re wasting efforts by trying to improve what doesn’t need improving.
As we’ve pointed out, DevOps does not equal automation. If an organization has messy processes and tries to automate them, they’ll be left with an automated mess. Therefore, organizations will see the best results from automating their constraints and just as important, not automating the non-constraints.






 As part of that effort, Chef Application Operations Dashboards provide visibility into both applications and infrastructure to simplify troubleshooting and compliance, said Goldfarb. For example, IT teams will be able to see how individual security and compliance controls are performing across a heterogeneous computing environment that now includes Microsoft Azure and Google Cloud Platform (GCP) alongside Amazon Web Services (AWS), he said.