Category: Blogs

  • Logz.io Adds Prometheus Service to Observability Portfolio

    Logz.io Adds Prometheus Service to Observability Portfolio

    Logz.io announced today the general availability of a cloud service, based on Prometheus, that can collect and analyze metrics alongside its existing log management service.

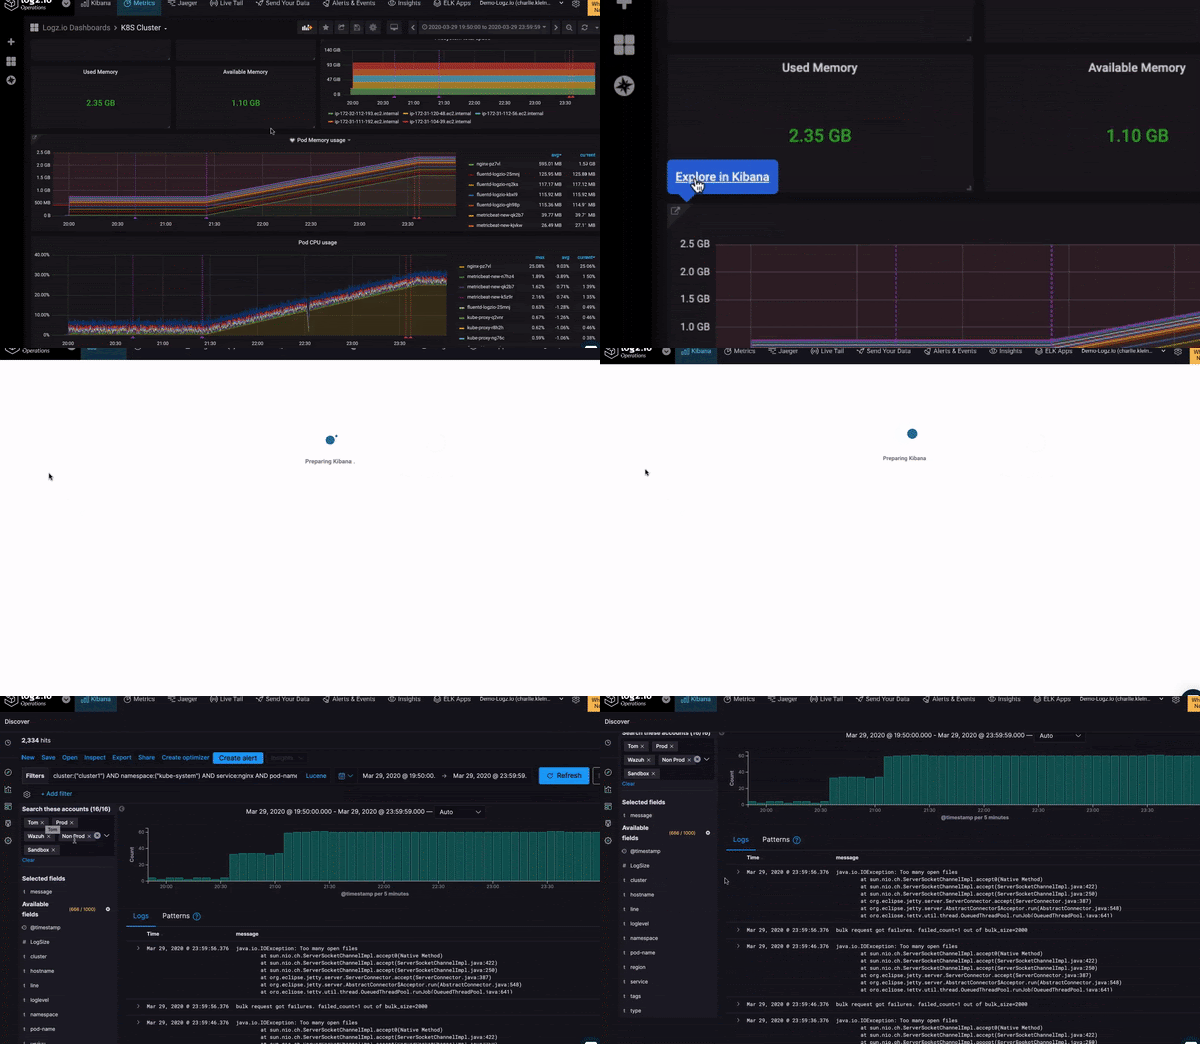
    Jonah Kowall, CTO, Logz.io, said the goal for Prometheus-as-a-Service is to provide IT teams with a centralized approach to analyzing data collected from instances of Prometheus running on local servers and clusters. While Prometheus is relatively easy to deploy, it’s not designed to scale horizontally, which means IT teams have to deploy multiple instances of Prometheus on a fleet of clusters and servers. The Logz.io service makes it easier to aggregate and analyze all the data those instances of Prometheus collected, said Kowall. That approach not only offloads the storage of those metrics, Kowall said, it presents an opportunity to correlate that data against logs and traces that Logz.io already collects.

    Logz.io, as part of that effort, is also making it possible to upload a Grafana dashboard, typically employed to visualize Prometheus data as a JSON file, to Logz.io, which will then convert the Grafana dashboards to dashboards based on the Logz.io user interface.

    While Prometheus is closely identified with Kubernetes, IT teams are starting to deploy the open source monitoring tool more widely to collect metrics. A recent Gartner report predicts that, by 2025, half of new cloud-native application monitoring deployments will rely on some form of open-source software to instrument applications. As part of that transition, Prometheus has already emerged as a de facto standard, Kowall noted.

    The primary focus, at least initially, is still on monitoring IT platforms, but as IT teams start to correlate metrics, logs and traces, they begin to benefit from additional context, otherwise known as observability, Kowall said.

    Observability, of course, has always been a core DevOps principle. However, as more applications become instrumented using open source tools and agent software, it’s becoming less costly to achieve. DevOps teams will still need to instrument each application, but the costs associated with collecting metrics and other data continues to decline. Most providers of monitoring tools and observability platforms are moving toward adding support for open source tools and agents to collect data alongside the proprietary tools and agent software they already make available. It will be up to each DevOps teams to decide whether to rely on open source tools or continue to rely on proprietary software that may be able to surface deeper insights or is simply easier to deploy.

    Regardless of the path chosen, the rise of microservices-based applications with numerous dependencies is forcing the observability issue. Microservices-based applications may not crash as frequently as a monolithic application because they are, ideally, designed to degrade gracefully in the absence of a single point of failure. The challenge is that, once they do degrade, it’s difficult to pinpoint the source of the issue; this may result in applications running sub-optimally for an extend period of time.

    The good news is that DevOps teams should now have the tools required to diagnose and resolve those issues long before any end user notices.

  • Why Developers Should Care About Resilience

    Why Developers Should Care About Resilience

    Recently, a friend reminded me of a joke we used to have when we were both developers at a huge software corporation (we won’t mention names, but back when printers were a thing, you probably owned one of theirs). We didn’t develop printers. We developed performance testing and monitoring tools.

    We were the dev team, which was completely separate from the QA team and from the Ops team (yes, I’m that old – we didn’t even call it DevOps back then). Support was part of a completely different organization and “business” was something that happened in an altogether different galaxy. That is, until a customer had an issue.

    When an important customer had an issue, we definitely felt it at R&D. Managers called hourly to check on status, and we would have intense conversations with the support team who would then, in turn, have intense discussions with the customer. If we, the software engineers developing the product, ended up on the same call with both support and the customer, it was a sure sign that things were bad. You knew that millions of dollars were on the line, and, consequently, that pressure was high. But most of all: you knew that we would do anything we could to solve the problem, because we needed those millions of dollars to be paid, so that we could keep getting paid. And so, we kept the coffee flowing.

    This is where the joke part comes in. We used to have a system for managing support tickets, collecting information, tracking time and assigning it to the relevant software or support engineer, so everyone would know who was in charge. Today, you probably use Zendesk, ServiceNow or one of their alternatives. We used a home grown system, of course.

    Our joke was this: the purpose of the system was not to track and measure and propagate the handling of customer issues. The purpose of the system was to indicate someone else is now responsible for solving the problem. Or, if you would rather paraphrase one of my favorite Douglas Adams jokes, the issue is now under a Somebody Else’s Problem field.

    Because solving customer issues is difficult and frustrating, and being pressured by business could ruin a software engineer’s day. This is because when you’re a happy code monkey, and all you want to worry about is writing beautiful code and releasing cool features and drinking some coffee, solving a customer issue gets in your way.

    You end up spending too much time sifting through endless logs, crossing your fingers and trying to reproduce an issue that only happens at 2 a.m. on a Friday, usually when a blue zebra is passing by. Spending your time on a heated support call is less fun than, say, drinking coffee quietly with your friends.

    As R&D managers, we understand that our developers want nothing to do with solving customer issues. We want to make sure they are motivated and happy and efficient, and that they are free to challenge themselves by learning the latest buzz-worthy technologies and thinking up ways to introduce those into our product in a way that will make our customers happy.

    Additionally, as R&D managers, we are far more likely to understand the business impact of having too many support tickets or having support tickets that take too long to resolve. We know that the loss on such cases is twofold:

    1. The customer that faced an issue and is waiting for a solution may become frustrated, and the company may lose their business.
    2. Our engineers are busy solving that customer issue instead of delivering new value to the business.

    Therefore, as R&D managers, it is our responsibility to make sure that our engineers have the tools to handle these issues as efficiently as possible when they come up. It is our responsibility to make sure they are motivated, and that they understand the business impact of solving a customer issue as quickly as possible. And whenever possible, it is our job to make sure that they make our application as reliable and stable as possible to begin with.

    That ensures that we have test coverage, and the right knowledge, practices and tools to ensure that we have as few customer issues as possible to begin with.

    Happily, changes in dev culture usually means that “support” and “business” and even “customers” are not as far away as they used to be. When developing a SaaS platform, your developers often have an almost intimate, real-time ability to track what users are doing and how it impacts their experience. The culture of DevOps has done a lot for breaking the silos that used to separate the dev team from the support team, and to make sure that all members of the team engage and understand how the code they write and the issues they resolve help our customers.

    I hope you already found the way to motivate your team to solve such issues, and that they have enough time to drink coffee. If you and your team are still struggling, we suggest bringing in a live debugging tool that can help them solve customer issues even faster, by making sure they have all the data they need at their fingertips, and that they can instantly reproduce any issue in a live, remote environment. Live debugging tools give your engineers a developer-friendly experience, and also gives them the power to reduce issue resolution time, too. Now, all you need to worry about is that your engineers have enough coffee.

  • Assessment of DevOps Capabilities: 5 Dimensions Explained

    Assessment of DevOps Capabilities: 5 Dimensions Explained

    In order for organizations and teams to move toward DevOps maturity, they need to understand their DevOps capabilities. An Assessment of DevOps Capabilities determines a baseline DevOps state, measures and accelerates continuous improvement.

    When we designed our Assessment of DevOps Capabilities (ADOC), the ambassador cohort brought a ton of ideas to the table around the high-level topics based on their experience performing this work for years. We talked about how important it was to cover the three aspects we have classically referred to in our industry; people over process over tools and many referred to the CALMS (culture, automation, lean, measurement and sharing) model widely known in the DevOps world and originally coined by Willis, Edwards and Humble.

    Our chief of research, Eveline Oehrlich, who led the 40-strong ambassador cohort who crowdsourced the model along with myself, had been conducting research for our Upskilling Report for several years. We looked at the models she’d been using there to drive comprehensive coverage of the different dimensions of DevOps. They aligned with the other models we were considering, resonated with the team and we all agreed that they gave us the best chance of ensuring the organizations that would use the assessment considered all the elements of these complex and sophisticated ways of working we call DevOps.

    The 5 Dimensions of the Assessment of DevOps Capabilities (ADOC)

    1. Human aspects
    2. Process and frameworks
    3. Functional composition
    4. Intelligent automation
    5. Technology ecosystem

    Our next job was to define the topics in each dimension and then to define Likert statements for each of the topics. These statements allow for data to be collected that provides teams with insights into where their capabilities are strong and should be shared, and where we recommend they experiment with improvements. Let’s look at each dimension in more detail:

    1. Human Aspects Dimension

    At DevOps Institute, we’re all about the human aspects. We know that culture is the biggest challenge for most organizations on a DevOps journey. Helping individuals and teams to understand and change behavior is a core purpose of ours.

    In this dimension, we address psychological safety and a culture of trust. We explore how leadership behaves, using transformational leadership as a model. We ask questions that explore how the team feels the organization is performing in terms of alignment, accountability, autonomy, empowerment and if and how they feel supported. We look at dynamic learning and constructive collaboration.

    Some topics focus on The Three Ways; we consider flow through the lens of customer focus and value stream thinking. We ask about how feedback is generated, received and reviewed in retrospectives. We explore how innovation and experimentation happens. There are some statements that help the teams learn about organizational design and team topologies. And we also include happiness and joy at work, and diversity and inclusion topics.

    2. Process and Frameworks Dimension

    Many years ago, I borrowed our esteemed leader Jayne’s phrase, “DevOps is the happy, polygamous marriage of ITSM, lean and agile.” Naturally, these frameworks are in this dimension – specifically, how they connect with DevOps activities.

    We also look at how the teams are experiencing scaling their activities and whether it’s working for them. We want teams to understand how to achieve high performance in continuous compliance, so we help them explore how they incorporate governance, risk and compliance (GRC) in all that they do.

    We take another look at value stream ways of working from a process perspective, and how well teams are transitioning from project to product. We look at a couple of frameworks very closely related to DevOps; site reliability engineering (SRE) and DevSecOps.

    We explore how the teams are leveraging systems and design thinking. We gather data on which elements of immersive learning, Holacracy and Humanocracy are helping them achieve their DevOps goals.

    3. Functional Composition Dimension

    In this dimension, we are looking at all the steps from ideation to value realization.

    We start with looking at how the teams collaborate and then where and how ideas are conceived, nurtured and refined through portfolio, backlog and product management and ownership.

    We look at change, whether the teams are using lower-level change advisory/approval board (CAB) patterns, and how far they have progressed towards peer-review. We explore with them how loosely coupled their architecture has transitioned, and how they build, develop and integrate. We ask them to rate their capabilities around test and validation, and deploy and release.

    Other capabilities we explore include operations and support, security, infosec and cybersecurity – helping them understand the patterns that create the safest environments to reduce business risk. We look at data lakes and how they manage data generally; its statefulness has always caused problems with DevOps at speed; for remediation and test data in particular. And we help them understand how to build in reliability and recovery patterns to counteract the risks associated with high-velocity working.

    4. Intelligent Automation Dimension

    This dimension is all about the DevOps toolchain; from artifact management and source control through CI/CD and into live.

    We also look at how tools are used to create a unified backlog, and how service and support happens post-release. We explore environment management and how well the teams are achieving continuous compliance and what this means for customer delight.

    We consider some of the key tool categories that help obtain feedback for improving customer experience; observability and monitoring and tie it all together by exploring how the team is using value stream management to gain visibility, traceability and insights into the end-to-end flow through the DevOps toolchain.

    5. Technology Ecosystem

    Our final dimension is designed to help teams understand how the infrastructure that surrounds their product, service or value stream influences their ability to work better, faster, safer and happier. This means understanding their capabilities for cloud, elasticity, serverless, containers, microservices and APIs.

    They rate their attitude toward open source, and how inner source does or doesn’t help them work better. It requires investigation into how they construct their route-to-live and how they architect the toolchain within these contexts.

    We look at security elements, such as secrets management, and some of the technology concepts that are currently emerging and that promise to drive us further forward; robotic process automation (RPA), blockchain and virtual and augmented reality.

    What to Expect From the Assessment of DevOps Capabilities

    This five-dimensional model allows teams and organizations to assess their current state on their DevOps journey. The data collected allows teams to self-discover improvements and accelerate progress, with the guidance of a qualified ADOC consulting partner. Organizations can compare team capabilities across their enterprise, pinpoint high levels of capability and turn local discoveries into global improvements. ADOC is a tool to measure and accelerate a DevOps journey.

    ADOC is now available as an exclusive benefit to Premium and Enterprise Members. Learn more about the assessments at: https://devopsinstitute.com/devops-assessment/

  • Without These 3 Things, You Don’t Have DevSecOps

    Without These 3 Things, You Don’t Have DevSecOps

    DevSecOps adds security to the DevOps software development and releasing paradigm. Everyone thinks this is a great idea, except actual Dev and Ops practitioners, for whom security can be a thankless, stressful time sink. Without the right approach and tools, an organization can run a DevSecOps process that actually contributes little to security. Security simply tags along after development and operations, ignored at every turn. The result is rapidly released, insecure code.

    Industry vendors will tell you they have a DevSecOps solution. You, in turn, may believe you have DevSecOps up and running. However, there can be a big difference between acquiring a DevSecOps solution and fielding a viable, effective DevSecOps program.

    What DevSecOps Isn’t

    1. Every task is manual, and done mostly by consultants.
    2. You send out myriad PDFs or spreadsheets and waste time in meetings.
    3. Your solution or program escalates a lot of security alerts, but never delivers a fix.

    DevSecOps, a Brief Overview

    DevOps, the merging of previously separate software development (Dev) and IT operations (Ops) workflows, has been a boon to businesses. When developers work directly with Ops, which releases and manages the code in production, the entire development-to-release cycle speeds up. This is great news, except when it comes to security.

    Rushing new code into continuous integration/continuous deployment (CI/CD) platforms invites risk exposure. DevOps can easily, but inadvertently, put vulnerable code straight into production on a daily basis. To mitigate this risk, the DevSecOps approach inserts a security function into the workflow.

    This is good, in theory. However, if this is all you have, you do not have a DevSecOps program; you have missed the bigger picture. Without automation, tool integration and results validation, simply injecting security processes into the DevOps workflow might actually make everything worse. Your code will be less secure. The security team will not move quickly enough for the DevOps team, which aims to rapidly release code, and will not always address the security issues raised.

    DevSecOps Requires True Automation

    DevSecOps has to include true automation in the security process. The practice of security pros copying code for security testing and then returning with a spreadsheet of remediation requests simply does not work. Good intentions aside, the Dev team does not want to deal with a long list of security problems, many of which are perceived to be low-risk or could generate false positives. Security is perceived as slowing everything down. There can even be organizational issues that keep the two groups in opposition to one another.

    Instead, code vulnerability assessments should be automated within the DevOps workflow. As code gets checked into Github and then compiled via the build pipeline CI tools, it needs to undergo automatic static, dynamic and interactive analysis. It should undergo a full stack assessment, too. The automated assessment must examine code for vulnerabilities at the mobile or web client layer, the API data transport application network layer and the back end cloud building block app services layer. Automated security testing can analyze microservices, serverless architectures, storage and databases. With this approach, the “sec” part of DevSecOps comprises a “build, set and forget” function. There will be security people involved, of course, but the majority of work is automated.

    This automated vulnerability assessment must then generate alerts and establish a priority hierarchy for their handling. Again, automation plays a pivotal role here, and needs to automatically, and in a meaningful way, triage the long list of findings based on issue severity, privacy concerns and app store blockers. If the assessment produces an overly long list of risks to fix, the DevOps teams commonly tune them out as noise that delays release schedules. However, if the automated process identifies the five or ten “must address” problems, developers are more likely to respond to a realistic, practical set of tasks that create an effective process and resolve issues at the roots.

    DevSecOps Must Integrate With Development and Security Tools

    Security processes are most effective if they integrate with the toolsets used by the DevOps team. These include development tools, cloud platforms and monitoring tools such as security incident and event management (SIEM) systems, as well as ticketing and remediation solutions. That way, security connects directly into the DevOps pipeline; it is neither a digression nor a bottleneck.

    For example, if issues get distributed via ticketing systems, they go directly into developer workflows. Developers might be accustomed to working on issues described in JIRA tickets, for example. If the alerts are suitably prioritized, the developers will likely not perceive the ticket as an imposition on their other work. As security issues appear in JIRA tickets, developers can work on them at a familiar, practical cadence. This improves security and DevOps team collaboration by providing details about issues, occurrences, recommendations and remediation. The results can help remediation of security vulnerabilities be more effective.

    DevSecOps Provides Validation of Results

    A viable DevSecOps program will also provide stakeholders with data about how the program is performing. Reporting and data visualization that documents the results of its vulnerability assessments, and the subsequent remediations, are critical to a successful program. While no application is always perfect on any given release, knowing the risks and having a measurable, clear course of action is critical to a solid DevSecOps program. Successful programs will feature reporting on metrics such as critical issues fixed before production, “business blockers” fixed before rejection, legal costs and regulatory fines avoided and security time and costs saved. Without such reporting and validation of results, there can be no actual DevSecOps. It will be DevOps with some ambiguous security activity surrounding it.

    Application security tools are essential to realizing these three tenets of true DevSecOps and an effective appsec program. The preferred tool should be, as these parameters suggest, highly automated and easy to integrate. It also has to have in-depth reporting capabilities. Armed with the right tools, a DevSecOps group can embrace an approach to the work that is fully automated and intuitively part of the DevSecOps workflow.

  • JumpCloud Brings Zero-Touch Provisioning to the Mac

    JumpCloud Brings Zero-Touch Provisioning to the Mac

    JumpCloud today announced it is adding a zero-touch enrollment for Macs capability to its cloud directory platform that will also be extended over time to applications.

    Greg Keller, JumpCloud CTO, said this new capability extends Apple Business Manager, formerly known as Apple Device Enrollment Program (DEP), all the way down to specific users by leveraging data that resides in the JumpCloud platform.

    Whenever a user logs into a new Mac, it can automatically be synchronized with the JumpCloud Directory, which then uses the identity of that end user to configure the device in addition to providing the appropriate access to all corporate resources via their JumpCloud credentials.

    Keller said the need for zero-touch approaches to IT administration has become more acute in the wake of the COVID-19 pandemic. With employees working from home more frequently even after the pandemic eventually subsides, Keller noted the days when IT teams could physically provision a Mac are on the wane.

    While Apple Macs still represent less than 10% of all the PCs shipped in a year, Keller noted small-to-medium (SMB) businesses are adopting Macs at a faster rate than large enterprises. As the endpoints become more diverse, Keller said the JumpCloud platform provides an alternative to Microsoft Active Directory for managing both Windows and Mac devices. Apple, of course, last year acquired Fleetsmith to gain access to provisioning tools. However, those tools are not yet integrated with any type of directory.

    Most recently, JumpCloud has added a tool that enables IT teams to remotely install software onto end user Windows devices, as well as integrations with Slack, Salesforce, Atlassian, GitHub and Amazon Web Services (AWS).

    Fresh from raising an additional $100 million in funding, JumpCloud is making a case for a zero-trust approach to managing endpoints using a directory that verifies the identity of each end user. JumpCloud, which makes a free edition of its platform available for individuals and small teams, is already being used by more than 100,000 organizations spanning more than a hundred countries. More than 3,700 of those organizations, including Cars.com, GoFundMe, Nimbus Therapeutics, Grab, Pulselive, SlimPay, Foursquare, Beyond Finance and Funding Societies, are paying customers.

    In the longer term, there may come a day when verbal commands are employed to provision endpoints for specific end users. In the meantime, the process of configuring and provisioning those endpoints is becoming more automated. IT teams are now able to remotely manage fleets of endpoint devices without having to physically touch them. In fact, there may be no need for IT managers to return to an office, as tasks become increasingly automated and able to be performed remotely.

    While there are a lot of options available to achieve that goal, Keller said the number of them that are tightly integrated with a directory to ensure the right system winds up in the right end user’s hands is few and far between. The challenge now is getting organizations to rethink their directory requirements at a time when IT teams are increasingly expected to deliver personalized, white-glove services regardless of where an end user is located.

  • Oracle Updates Java Development Platform

    Oracle Updates Java Development Platform

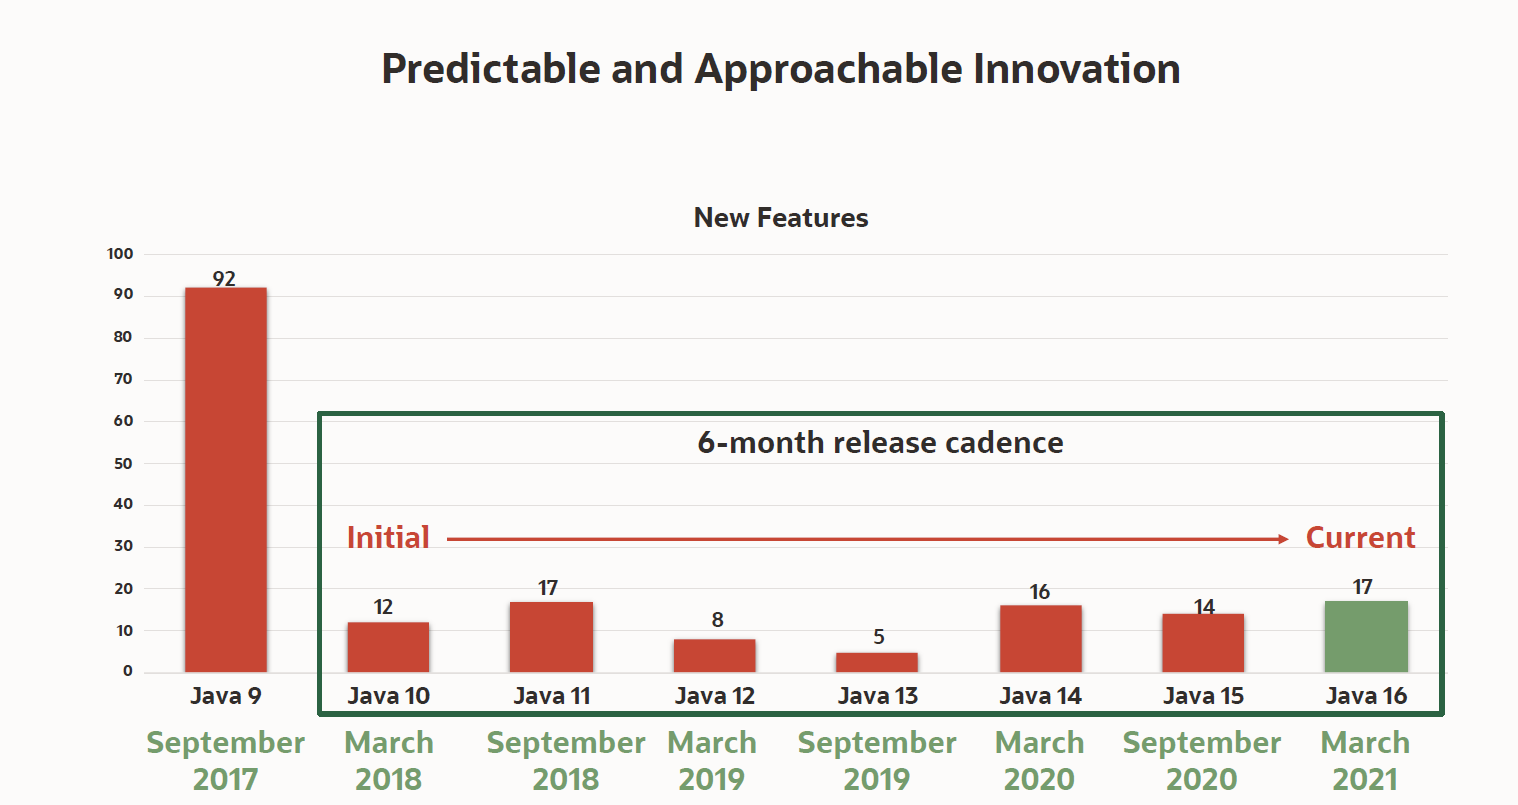
    Oracle announced today the availability of Java 16, which adds 17 enhancements to a software development kit that is now being updated every six months.

    Georges Saab, vice president of development for the Java Platform Group at Oracle, said while most Java development teams are still using Java 8 or earlier editions of the platform, the expectation is that many of them will soon move forward, as updates are made available in smaller increments that are easier to test and vet.

    At the same time, Oracle is committing to make available long term release editions of Java that won’t be updated as frequently. While there are many organizations anxious to take advantage of new capabilities as quickly as possible, Saab noted there are just as many that value stability more than innovation.

    The latest edition adds support for finalized pattern matching for instances and records, as well as other language enhancements that were previewed in Java 14. Developers can also employ a packaging tool to ship self-contained Java applications that will make it easier to deploy in modern IT environments, said Saab.

    Additional capabilities now available include the Vector application programming interface (API), the Foreign Linker API (JEP 389), and the Foreign-Memory Access API that are all available in incubations as well as a sealed classes capability that is being made available as a preview.

    In general, Saab said, one of the primary reasons many organizations don’t tend to update Java more frequently is the frameworks they rely on to employ it at a higher level of abstraction are still optimized for older versions. However, as Java updates are delivered in a more modular fashion, it will become easier for the providers of those frameworks to keep pace.

    It’s not precisely clear to what degree IT teams are employing Java to build next-generation applications based on microservices. However, a recent survey published by VMware, found 95% of respondents have either already used the open source Spring framework, based on Java, to either containerize an application (65%) or plan to do so (30%).

    A quarter of a century after its initial development, Java is still the dominant programming language relied on to build enterprise applications. In many instances, the lack of tools for building Java applications for Kubernetes platforms was a significant inhibitor of adoption for the cloud-native platform. In the last six months, however, the number of tools for building and deploying Java applications on Kubernetes clusters has increased.

    Despite the proliferation of alternative platforms for building and deploying applications on Kubernetes platforms, the appetite for retraining legions of Java developers is low. Most developers will rely on the programming tool they already know, especially when it comes to building mission-critical applications for the enterprise. That may mean some of those applications might not be as fast as they could be, but, given the level of risk, there’s always going to be a natural tendency toward being safe rather than sorry.

  • Sonatype Acquires MuseDev to Add Code Analysis

    Sonatype Acquires MuseDev to Add Code Analysis

    Sonatype today revealed it has acquired MuseDev, a provider of a code analysis tool, in addition to updating its Nexus platform for discovering vulnerabilities in software supply chains.

    Muse analyzes code each time a pull request is made, which makes it easier for developers to discover and address issues long before they commit code. Muse is integrated with 24 pre-configured code analyzers for GitHub, GitLab and Bitbucket repositories. It then analyzes each pull request to surface bugs, as part of automated code review, and includes analysis of interprocedural information flow and thread safety issue analysis, along with guidance to fix any bugs discovered.

    In addition to adding support for Muse, the latest edition of the Nexus platform integrates a container firewall from NueVector along with a set of tools for identifying and providing guidance on how to address misconfiguration issues that frequently arise when developers employ open source Terraform software to programmatically manage infrastructure as code.

    Finally, Sonatype added tools to provide better guidance on the implications of open source licensing terms attached to various projects, while at the same time starting its own community for organizations migrating from Bintray and JCenter, now that those tools have been sunsetted.

    Brian Fox, Sonatype CTO, said the expectation is Muse will create an opportunity to introduce the complete DevSecOps portfolio to developers as they analyze code. Most developers are keenly interested in both optimizing and securing their code. They would just prefer to achieve that goal on their own versus being informed of an issue after code has been committed to a repository managed by a larger DevOps team, noted Fox.

    An advanced development pack was added to the Nexus platform last year to make it easier to surface dependencies in code that are vulnerable to threats. It applies machine and deep learning algorithms to automatically identify and block software supply chain attacks based on typosquatting and malicious code injections. Collectively, these tools give developers control over third-party open source code, first-party source code, infrastructure as code and containerized code, Fox said.

    Sonatype claims it now counts 70% of the Fortune 100 as customers, and supports more than 2,000 commercial engineering teams. In 2020, it claimed it saw a 35% annual growth in Nexus repository installs, which now stands at more than 250,000 instances employed by nearly 15 million developers.

    Overall, it’s not clear how much progress is being made toward embracing DevSecOps best practices. Sonatype, however. is making a case for putting DevSecOps tools directly into the hands of developers to address software supply chain security. In the wake of some recent high-profile breaches involving software supply chains, that approach may soon gain additional traction. After all, for all the encouragement being provided by application development team leaders these days, there’s nothing quite as effective as providing developers with a set of tools that enables them to achieve that goal on their own terms versus requiring them to follow a set of procedures dictated by a DevOps management team.

  • IBM Unveils New Capabilities Designed to Accelerate Hybrid Cloud Application Modernization

    New and updated DevOps capabilities aim to increase agility for developers

    ARMONK, N.Y., March 16, 2021 /PRNewswire/ — IBM (NYSE: IBM) today announced a series of new and updated capabilities for developers designed to deliver intelligent application analysis throughout the DevOps pipeline, generally available on March 19.

    According to an IBM internal assessment, a bank with $1B in IT spend undergoing a hybrid transformation with integrating mainframe reported 2.5x the value of a single vendor cloud approach1. However, to fully realize that potential value with low risk and high ROI, clients will need DevOps tools that can assist them to help understand application complexity – a key step when planning their cloud transformation journey.

    To help clients unlock the value of DevOps across the enterprise, and help reduce risk around application modernization, today IBM is announcing new IBM Wazi Analyze capabilities to help bring IBM Z into the DevOps pipeline, unlocking uniform, enterprise-wide agile delivery processes and standards with transferable skills for non-Z developers.

    These new capabilities are included in:

    • IBM Application Discovery and Delivery Intelligence (ADDI) for IBM Z V6
      which allows developers to accelerate application development and modernization by enabling them to efficiently gain granular insight into their business-critical application estate. With the new version of Wazi Analyze, you can get updated analysis immediately after the code change is made. ADDI v6 has been engineered to improve the Assembler support by helping developers analyze the multi-level of dynamic assembler macro calls. A set of APIs are also made available to enable integration between the analysis and CI/CD pipeline.
    • New Analyze capability in IBM Wazi Developer V1.2, a subset of ADDI, helps enable developers to discover and analyze the relationships between components of their z/OS applications and understand the impact of a potential change. Wazi Analyze runs in a containerized environment to give developers the flexibility to run it in any environment.

    In addition, IBM is also announcing we have completed a licensing agreement with ITP Software Systeme GmbH, Munich (ITP) to enhance DevOps for IBM Z Hybrid Cloud capabilities. This includes IBM’s offerings IBM Application Discovery and Delivery Intelligence (ADDI) for IBM Z V6 and IBM Wazi Developer V1.2 and is expected to provide a strong foundation for our clients’ application modernization and cloud transformation initiatives, accelerating their journey to hybrid cloud. By working with ITP, IBM will introduce advanced application analysis on IBM Z and Red Hat OpenShift, as well as be able to provide on-demand project level analysis as part of a modern DevOps pipeline when and where developers need it.

    “We look forward to using the new IBM Wazi Analyze web user interface as part of IBM Application Discovery and Delivery Intelligence, said Armin Kramer, Software Engineer at DATEV eG. “With these new capabilities, our developers will gain deeper access to z/OS application analysis – a critical component to enhance productivity when maintaining and developing code in a hybrid cloud environment.”

    For more information, please visit: IBM Application Discovery and Delivery Intelligence and IBM Wazi Developer

    Statements regarding IBM’s future direction and intent are subject to change or withdrawal without notice and represent goals and objectives only.

  • VMware Enhances Management Portfolio

    VMware Enhances Management Portfolio

    VMware today rolled out a series of updates to its automation and monitoring portfolio as part of an ongoing effort to simplify management of highly distributed IT environments.

    Updates to the VMware vRealize Cloud automation portfolio include VMware vRealize Automation 8.4’s tighter integration with the open source Salt automation framework the company gained by acquiring SaltStack last year, in addition to a range of tools for provisioning and governing instances of VMware software running on Google Cloud, Microsoft Azure and VMware Cloud on Amazon Web Services (AWS).

    There is also a set of tools to enable organizations running NSX network virtualization software for vSphere to migrate to NSX-T, an instance of network virtualization software that can be deployed anywhere.

    VMware vRealize Operations, meanwhile, is being updated to support a total of 57 AWS services along with the ability to predict the cost of deploying VMware Cloud on AWS. The latter capability includes tracking potential savings generated by powering off idle or unused virtual machines as well as snapshots, orphaned disks and oversized virtual machines. There are also now ten additional dashboards for tracking various costs, including return on investment, total cost of ownership and potential cost savings. IT teams can also more easily track capacity utilization trends on AWS.

    VMware is adding support for the open source Telegraf Agent to enable IT teams to collect metrics from any platform, in addition to providing an update to VMware vRealize Log Insight 8.4 and vRealize Log Insight Cloud that enables these monitoring tools to store data collected from multiple cloud services more efficiently. IT teams will also be able to collect logs from both Microsoft Azure and AWS.

    Finally, VMware is expanding its network monitoring tools to provide greater visibility across multiple clouds.

    Fidelma Russo, senior vice president and general manager for cloud services at VMware, said the rate at which IT teams are consuming the software-as-a-service (SaaS) editions of VMware management and observability tools or full-blown managed services has increased sharply since the start of the COVID-19 pandemic, as IT teams managed on-premises and cloud instances of VMware software from home.

    It’s not clear what percentage of VMware’s installed base are now consuming the company’s automation and monitoring tools, but as the number of VMware instances deployed on public clouds increases alongside on-premises IT environments, so, too, do the management challenges. The choice IT teams generally have to make is deciding between automation and observability tools that are optimized for a specific platform versus adopting frameworks that work more broadly. With the acquisition of Salt and support for Telgraf, it is apparent VMware is moving to expand the reach of its management portfolio beyond its own software.

    In the meantime, IT teams are not only being asked to manage more complex IT environments, but the expectation that, through automation, they will be able to more effectively implement cost controls. This is happening at a time when many organizations have not been quite so sensitive to the total cost of IT. The challenge, of course, is those organizations are being asked to spend money on automation today in the hopes of spending less because of it tomorrow.