Category: Blogs

  • Sysdig Adds CSPM Module to DevSecOps Platform

    Sysdig Adds CSPM Module to DevSecOps Platform

    Sysdig today announced it added a cloud security posture management (CSPM) module to its Sysdig Secure DevOps Platform for monitoring application performance and security to enable IT teams to continuously detect threats.

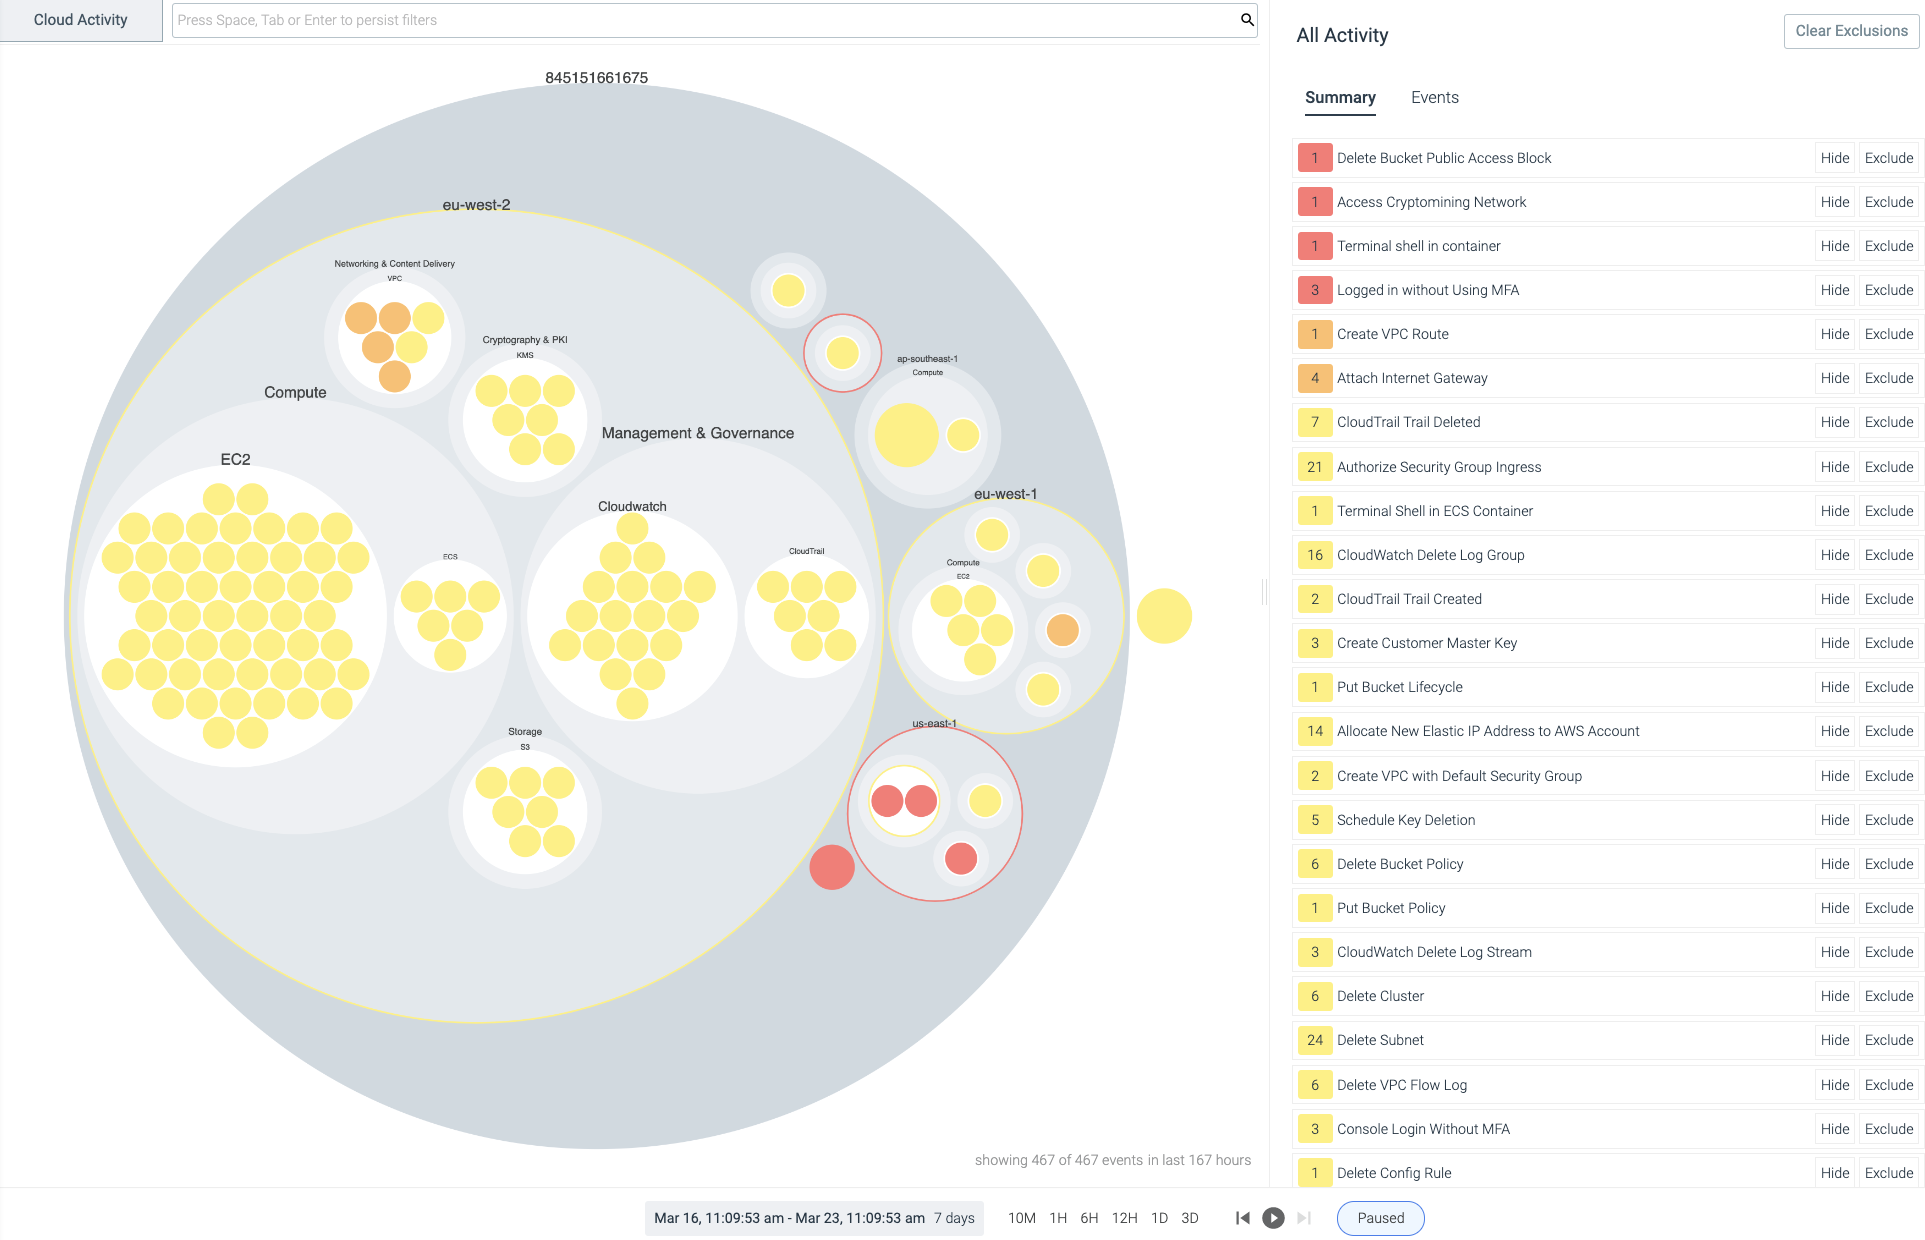
    Pawan Shankar, director of product marketing for Sysdig, said this CSPM capability is based on an open source Cloud Custodian tool that enables IT teams to define rules for accessing cloud infrastructure. In addition, the tool enables IT teams to collect utilization metrics that could be used to turn cloud resources off when they are not being employed. IT teams can now also automatically discover all cloud services being employed, including identifying which ones are misconfigured or might have compliance and regulatory issues that need to be addressed, via a software-as-a-service (SaaS) platform.
    The overall goal is to help reduce the friction that organizations encounter today as they embrace DevSecOps best practices, added Shankar.

    Sysdig is making its CSPM offering available for free, for one account, to encourage DevOps teams to make use of a CSPM capability along with Sysdig’s open source Falco threat detection capabilities. Sysdig today also announced that it extended its implementation of Falco to consume audit logs created on the Google Cloud Platform (GCP). Sysdig donated Falco to the Cloud Native Computing Foundation in 2018. More recently, Sysdig also contributed a sysdig kernel module, along with libraries for the Falco security platform for Kubernetes, that runs in the extended Berkeley Packet Filter (eBPF) microkernel to further improve Linux security.

    The free tier includes a daily check against CIS benchmarks as well as support for inline scanning of up to 250 container images per month running on either the Fargate or Elastic Container Registry (ECR) services provided by Amazon Web Services (AWS).

    Sysdig has been making a case for the convergence of traditional IT monitoring functions and security for several years now. In the wake of some recent high-profile breaches involving software supply chains, the company is betting that more DevOps teams will soon be revisiting how their software supply chains are managed at a time when it’s become easier for malware to move laterally across an entire IT environment. In fact, Sysdig cited research that estimates that malware moving laterally through an organization is involved in 70% of cyberattacks.

    Of course, with the rise of applications based on microservices, the average IT environment is about to become a lot more integrated, which naturally makes it easier for malware to move laterally. IT organizations now require greater visibility across an entire potential attack chain to combat those threats, Shankar noted.

    As DevSecOps continues to evolve, the relationship between developers and cybersecurity teams is also clearly evolving. Now that developers are being held more accountable for cybersecurity, many of them are gravitating toward tools that can be easily integrated within the context of a larger DevOps toolchain.

    It remains to be seen exactly how security tools will be integrated within those tool chains, but for DevOps teams that already rely on Sysdig to monitor their IT environments, the ability to access a raft of additional security services is only a few mouse clicks away.

  • Celebrating the One-Year Anniversary of TechStrong TV

    Celebrating the One-Year Anniversary of TechStrong TV

    A year ago today, we started a new streaming project called “TechStrong TV” to provide the audience with an alternative source of information and entertainment, focused on delivering great tech content, during the unusual times of the COVID-19 pandemic. Little did we know back then what this would mean for all of us.

    In less than a year, TechStrong TV became an award-winning broadcast with thousands of videos, hundreds of thousands of views and more than 600 guest appearances by tech thought leaders, business leaders and industry experts. Our mission is to provide the best in-depth analysis on current industry issues and to deliver the most relevant tech news and the latest information on software development, DevOps, cloud-native, digital transformation and cybersecurity. Most importantly, we started doing this to help our community stay tech strong in times of uncertainty. We are committed to our community and we believe it is our duty to keep everyone informed and updated on everything that’s buzzing in the IT industry.

    TechStrong TV features a variety of video series that make up our daily show, including:

    • DevOps Unbound: A bi-weekly/monthly roundtable sponsored by Tricentis, providing a deep dive into DevOps, with an emphasis on automation, continuous delivery, accelerating transformation, testing and quality.
    • Analyst Corner: Hosted by Mitch Ashley and seasoned industry veterans, focusing on the latest trends and opportunities businesses see during these unprecedented times.
    • CISO Talk: A bi-weekly video series that explores the issues and topics that CISOs are dealing with today and how they prepare for the future.
    • The Lab, by GitLab: This monthly segment features GitLab Sr. Developer Evangelist Brendan O’Leary as he shares the latest GitLab updates.
    • The H4unt3d Hacker: A weekly podcast hosted by cybersecurity researcher and ethical hacker Mike Jones, one of the founders of Anonymous, and featuring like-minded cybersecurity professionals who discuss ideas and topics relevant to the industry.
    • Ambassador Insights: A monthly panel discussion featuring members of the DevOps Institute Ambassadors sharing their expertise and insights on various topics in the DevOps space.
    • WFH Fitness with Jeremy Jones: Jeremy, a member of the MediaOps sales team as well as a certified personal trainer, brings his knowledge of fitness to TechStrong TV with a 20-minute home workout for any level of fitness, from beginner to advanced.
    • Something Old: Replays of some of the most memorable presentations by top industry analysts and IT practitioners from past in-person and online events and virtual summits.

    We’ve had the pleasure to conduct executive-level discussions with outstanding thought leaders such as Sid Sijbrandij of GitLab, Shlomi Ben Haim of JFrog, Sacha Labourey and Stephen DeWitt of CloudBees, Ashok Reddy of Digital.ai, Sandeep Johri of Tricentis, Emmet B. Keeffe III of Insight Ignite and many more.

    Today, we not only celebrate the show, but we also celebrate each and every one of our hosts, guests, sponsors and, of course, our viewers, for being tech strong and supporting our community. We wouldn’t have made it this far without you. So, thank you for being a part of TechStrong TV and stay tuned because we have a lot of great content coming your way. We are only getting started.

    All the episodes of TechStrong TV are available on demand. You can watch our weekly TechStrong TV livestream on Monday, Tuesday and Thursday at 9:30 a.m. ET on the web, or on YouTube at DevOpsTV Channel, Facebook Live, LinkedIn Live, Twitter or on Roku, Apple TV and Amazon Fire TV via the DevOps.com TV app. Also on Android and iOS devices via the DevOps.com mobile app.

  • Tricentis Aquires Neotys to Gain Load Testing Tools

    Tricentis Aquires Neotys to Gain Load Testing Tools

    Tricentis announced today it has acquired Neotys as part of an effort to expand the scope of its tools portfolio into the realm of load testing. Terms of the deal were not disclosed.

    Neotys provides application testing teams with automatic test design and maintenance, user behavior simulation and root cause analysis capabilities using a set of tools that are designed to be integrated within a DevOps toolchain.

    Sandeep Johri, Tricentis CEO, said the Neotys platform will extend the scope of Tricentis’ Tosca testing platform that today enables DevOps teams to employ machine learning algorithms to test the functions within an application.

    In general, Johri said there’s now a lot more focus on load testing, thanks in part to the rise of microservices-based applications that are starting to be deployed at scale. DevOps teams are, first, trying to identify, as early as possible, a single point of failure that might bring down an application. Second, modern microservices-based applications are designed to degrade gracefully when there is no single point of failure. Identifying what issues are leading to that degradation can be challenging, given all the dependencies that might exist within a microservices-based application.

    Neotys claims to have more than 600 enterprise customers, including BNP Paribas, Dell, Lufthansa, McKesson and Verizon. Tricentis claims to have more than 1,800 customers, including McKesson, Accenture, Nationwide Insurance, Allianz, Telstra, Rockwell Automation, Moët Hennessy-Louis Vuitton (LVMH PCIS) and Vodafone. The acquisition of Neotys will reduce the number of vendors that an organization needs to engage to gain access to a portfolio of testing tools, Johri noted.

    As IT organizations embrace DevOps best practices, more responsibility for application testing is clearly shifting left toward developers. However, it’s not quite clear to what degree that shift is either eliminating or reducing the need for dedicated application testing teams at the back end of the application development process.

    At the same time, many rote testing tasks are now being automated using machine learning algorithms. Those algorithms don’t completely eliminate the need for humans to test applications, but they do significantly reduce the testing time required. They should also create more time for developers to collaborate with one another to review more complex interactions within an application that machine learning algorithms are unlikely to be able to automate any time soon.

    The amount of time organizations devote to application testing has always been constrained. As deployment deadlines approach, often the first thing that gets reduced is the amount of time allocated to application testing. In many cases, developers deliberately don’t address some known issues until the first or second update to an application that has already been deployed in a production environment.

    Of course, integrating application testing within a DevOps process enables organizations to identify more potential issues earlier when they are easier and less expensive to fix. The challenge has always been getting developers to appreciate the value of testing early and often in the application development process.

    Regardless of how application testing continues to evolve in the age of DevOps the one thing that is certain is no matter how automated it gets developers are going to be more involved than ever.

  • Getting Started With Continuous Monitoring

    Getting Started With Continuous Monitoring

    DevOps continues to gain traction among organizations as demand grows for digital product and platform development. According to Gartner, 87% of business leaders believe digitalization is a priority. Every DevOps transformation requires a dedicated, continuous learning process and effective implementation to reach maturity. If a practice or pattern is passed over or ignored, it can put a damper on DevOps success. Continuous monitoring, for example, is a very important part of every DevOps life cycle that is often overlooked.

    Through effective continuous monitoring efforts, organizations can scale and deliver digital products and platforms faster and more securely. In fact, these continuous monitoring advantages tie directly to modern customer needs. If they haven’t already, business leaders must embrace continuous monitoring along every point of the DevOps life cycle. These best practices can help you get started.

    Understanding Continuous Monitoring

    The practice of continuous monitoring helps to collect and analyze outcomes, statuses, exceptions and key metrics within each step of the DevOps process – from development to deployment and production. Additionally, it offers deep insight for DevSecOps teams by enabling compliance triggers and security alerts configuration. It allows the organization to detect issues or security concerns throughout every phase of the DevOps lifecycle.

    Understanding what continuous monitoring does is a good start. However, to effectively adopt continuous monitoring, the organization must know what to monitor.

    What Should Be Monitored

    An effective continuous monitoring process collects enough data to gain sufficient understanding of both successes and failures of the organization’s systems and processes. Some of the events collected by the continuous monitoring systems will require immediate attention, while others may lead to longer-term strategy discussions.

    Collecting the right information is always tricky considering the number of endpoints that generate logs and events. One should rank the significance of each source in relation to the type of data it produces, the functional area it supports and the impact it has on the system’s performance, as well as on organization’s goals and commitments (requirements posed by SLA’s, regulations, contracts, etc.).

    A combination of technology and strategy helps ensure that the right data is collected at the right time. The next step, and perhaps one of the most significant challenges, is finding the balance between monitoring and analysis.

    How to Achieve Balance

    Balance is, by far, one of the most difficult decisions in log monitoring and analysis. Gather too little data and risk missing early trouble indicators or important alerts. Collect too much and get buried in analysis paralysis – essentially, leading to the same situation of overlooking items of significance. Striking the right balance requires understanding the system’s continuous monitoring processing capacity and using its full potential. This may also involve data preparation steps during intake to ensure optimal processing and storage of the collected material.

    Offloading mundane tasks and parts of the analysis to machine learning and artificial intelligence (ML and AI) and fuzzy logic systems will enable big data processing gains. With this approach, the continuous monitoring capacity can be significantly increased, along with the semantic quality of the alerts and notifications produced by the system. As a result, security operation center (SOC) staff can devote their attention to the analysis of events which are more meaningful to the system and operations, leading to a more efficient continuous monitoring process.

    A DevOps transformation will likely not reach full maturity unless the organization applies continuous monitoring to the DevOps life cycle. Although often overlooked, it remains central to DevOps success. With this in mind, a basic understanding of continuous monitoring, what to monitor and finding the balance between log monitoring and analysis, serve as a foundation for getting started with continuous monitoring.

  • Achieving Reliable Observability Part 1 – Making Cloud-Native Observability More Robust

    Achieving Reliable Observability Part 1 – Making Cloud-Native Observability More Robust

    I was having a conversation with a CxO level customer as part of an AIOps/Observability workshop, and from what I could tell, most are confused about how to properly operationalize cloud-native production environments – especially the monitoring/observability portion. Here is how the conversation went.

    “Andy, we are thinking about getting [vendor] to use for our observability solution based on your recent research. What do you think?”

    “Well, I don’t want to endorse any specific vendor, as they are all good at what they do. But let’s talk about what you want to do, and what they can do for you, so you can figure out whether or not they are the right fit for you.” The conversation continued for a while, but the last piece is worthy of being called out specifically.

    “So, we will be running our production microservices in AWS in the ____ region. And we are planning to use this particular observability provider to monitor our Kubernetes clusters.”

    “Couple of items to discuss. First, you realize that this particular provider you are speaking of also runs in the same region of the same cloud provider as yours, right?”

    “We didn’t know that. Is that going to be a problem?”

    “Not particularly. However, you may get into a ‘circular dependency’ situation.”

    “What is that?”

    “Well, as an enterprise architect, I always call for separation of duties as a best practice. For example, having your developer testing the code is a bad idea, having your developer figuring out how to deploy is a bad idea. In much the same way as when your production services run in the same region as your monitoring software – how would you know about a production outage if the cloud region takes a hit, and your observability solution goes down at the same time your production services do?”

    “Should we dump them and go get this other solution instead?”

    “No, I am not saying that. Figure out what you are trying to achieve and have a plan for it. Selection of an observability tool should fit your overall strategy.”

    For those who don’t understand the above conversation, here is the reason why this scenario could be a problem.

    Coming from an enterprise architecture background, we were taught, as a best practice, to operationalize production systems to avoid circular dependencies. This includes not having two services depend on each other, or not to colocate monitoring, governance and compliance systems as part of the production systems themselves. If you were to monitor your production system, you would do it from a separate and isolated sub-system (server, data center rack, sub-net, etc.) to make sure that if your production system goes down, the monitoring system doesn’t go down, too.  The same goes for public cloud regions – although it’s unlikely, individual regions and services do experience outages. If your production infrastructure is running on the same services in the same region as your SaaS monitoring provider, not only won’t you be aware that your production systems are down, but you also won’t have the data to analyze what went wrong. The whole idea behind having a good observability system is to quickly know when things went bad, what went wrong, where the problem is and why it happened so you can quickly fix it. You can check out this blog where I explain this in detail.

    The best practice would be to either:

    1. Consider an observability solution that runs in a different region than your production workloads. Better yet, consider something that runs on a different cloud provider altogether. Although it is exceptionally rare, there have been instances of cloud service outages that cross regions. The chances of both cloud providers going down at the same time would be slim.For example, if the cloud region goes down (a region-wide outage in the cloud is quite possible, and seems to be more frequent of late), then your observability systems will also be down. You wouldn’t even know your production servers are down to switch to your backup systems unless you have a “hot” production backup. Not only will your customers find out about your outage before you do, but you won’t even be able to initiate your playbook, as you are not even aware that your production servers are down.
    2. Consider having your observability solution in a different location/region, yet still close enough to your production services so latency is very low. Most cloud providers operate in close proximity, so it is easy to find one.
    3. Another option is to get a solution that gives you deployment flexibility. For example, there are a couple of observability solutions that allow you to deploy it in any cloud and observe your production systems from anywhere – both in the cloud and on-premises.
    4. You can also consider sending the monitoring data from your instrumentation to two observability solution locations, but that will cost you slightly more. Or, ask what the vendor’s business continuity/disaster recovery plans are. While some think the costs might be much higher, I disagree, for a couple of reasons. First, because monitoring is mainly time-series metric data, so the volume and the cost to transport is not as high as logs or traces. Second, unless your observability provider is VPC peered, the chances are your data will be routed through the internet even though they are hosted in the same cloud provider. Hence, there will not be much more additional cost. Having observability data, all the time, about your production system is very critical during outages.
    5. A very commonly overlooked consideration is monitoring your full-stack observability system. While it is preferable to have the monitoring instance in every region where your production services run, it may not be feasible either because of cost or manageability. On such occasions, monitor the monitoring system. You could do synthetic monitoring by checking the monitoring API endpoints (or do random data inputs and check to ensure it worked) to make sure that your monitoring system is properly watching your production system. Better yet, find a monitoring vendor that will do this on your behalf.

    When/if you get the dreaded 2 a.m. call, what is your plan of action? Just think it through thoroughly before it happens and have a playbook ready, so you won’t have to panic in a crisis.

  • Solvo Automatically Crafts Cloud Security Policies

    Solvo Automatically Crafts Cloud Security Policies

    Solvo today announced general availability of a namesake tool that automatically creates a least-privilege policy and applies it to application workloads deployed in the cloud.

    Previously available only as a private beta, Solvo will also continually analyze a workload after it’s been deployed to enable IT teams to adjust security policies as additional updates to an application are made.

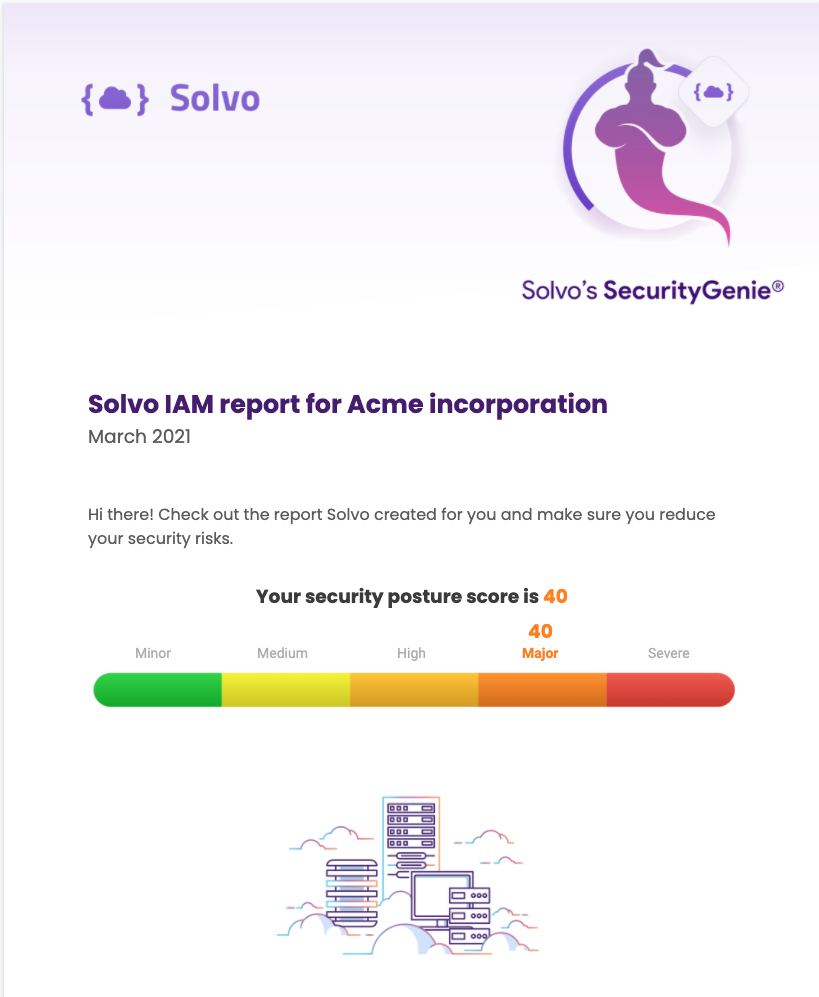
    In addition, Solvo is making available for free the Solvo Security Genie, which IT teams can use to identify misconfigurations, excessive permissions, privilege levels and third parties that may have access to accounts on the Amazon Web Services (AWS) public cloud.

    Shira Shamban, Solvo CEO, said the primary reason there are so many cloud security issues today is because developers – that lack cybersecurity expertise – are being asked to define policies. Solvo removes that burden by analyzing a workload and creating a cybersecurity policy before applications are deployed in the cloud. That cybersecurity policy can then be automatically applied by the developer.

    Shamban said that approach will reduce a lot of the DevSecOps tension that organizations are currently experiencing as they try to shift responsibility for cybersecurity further left toward developers. While no developer deliberately sets out to deploy an insecure application, shifting responsibility for cybersecurity to a developer who doesn’t really understand what’s required creates a lot of additional stress.

    The Solvo platform, available as a paid subscription or under a freemium model for individual developers and teams, addresses a lot of the cloud security issues that inevitably arise when infrastructure is provisioned as code by developers. It eliminates that stress by automating the creation and application of cybersecurity policies within the context of a DevOps workflows, said Shamban.

    However, a cybersecurity team can also manually edit those cybersecurity policies after an application is deployed, Shamban added.

    As DevSecOps best practices continues to evolve, it is clear the relationship between developers and cybersecurity teams needs to evolve, as well. For a long time, many cybersecurity teams viewed developers as the primary source of the problems they encountered. Getting used to the idea that those same developers are now going to solve those issues on their own requires a level of trust that will take time to build.

    Developers, for their part, are generally accepting of the idea that they should take more responsibility for security, so long as the tools provided to them are not selected by cybersecurity professionals that don’t appreciate application development workflows.

    In time, there is no doubt the cultural divide that exists between developers and cybersecurity teams will narrow. However, it’s arguable that more progress will be made, more quickly, if developers are allowed to choose their own security tools rather than accept an edict from on high mandating a specific approach. In fact, the best course of action for many IT teams is simply to offer words of encouragement to developers that elect to set an example for the rest of their colleagues.

  • Best Practices for Digital Experience Management

    Best Practices for Digital Experience Management

    The COVID-19 pandemic put digital services in the spotlight. The winners in 2020 and beyond will be those organizations which provide awesome user experiences for online products, services and apps. There is scant room for error, as digital leaders before the pandemic have upped their game even more.

    For example, streaming service provider Netflix’s 2020 Q4 revenue reached $6.64 billion – almost $14 million more than expected – and added 8.5 million paid subscribers. The company had more than 200 million users in the quarter and saw viewership for non-English titles jump 50% during the year as U.S. viewers sought new content from around the globe.

    Companies in more traditional sectors, such as restaurants and hospitality, also grew by investing further in digital strategies. Chipotle’s 2020 revenue increased 7.1% to $6 billion, with digital sales skyrocketing 174.1% and accounting for more than 46% of sales. Target’s digital sales increased 155% in Q4 while Costco grew e-commerce sales by 91% in FY20, as online ordering and curbside pickup became the new normal.

    Digital Experience Monitoring Basics

    To manage this onslaught of online customers and transactions, IT organizations are turning to digital experience monitoring (DEM). DEM is a broad area, but it comes down to delivering the best experience for your customers and employees by monitoring your IT assets and addressing issues that arise before they become problems. DEM allows you to mimic and test the end-to-end customer and worker experience. Such solutions can be used in on-premises data centers or run in multi-cloud and hybrid cloud environments.

    There are two key methods for DEM:

    Real user monitoring (RUM): This entails using real users’ devices to measure the performance of a page. A script is injected on each page to measure data on page load performance for every request made, monitoring the interaction of an application and the users. The data shows such aspects as how an application is being used and the geographic distribution of users.

    Synthetic monitoring: This technique tests the performance of a page using an automation tool rather than users’ actual experiences. Scripts are used to simulate how a user might move through a web application and then reports are created based on that performance.

    In a recent report, Gartner analysts said DEM products are evolving, moving from a focus on performance and availability to correlating infrastructure and operations (I&O) and business outcomes. Currently, fewer than 15% of digital business initiatives will require I&O leaders to report on business metrics from digital experience; that will jump to 70% by 2025, Gartner says.

    For years, organizations have been using monitoring tools to measure various aspects of their infrastructure. For example, IT operations management (ITOM) solutions track metrics and manage alerts and events for infrastructure hosted on-premises or in the cloud, including servers, networking systems, storage appliances and databases. The data also can be used for historical data analysis and to map out trends.

    DEM is specifically focused on the end user experience, giving IT professionals the visibility to run diagnostics, fix issues and measure performance at each point of contact between the users and the application. Acquiring a new customer is an expensive effort, and a customer can be lost because of a single poor experience. DEM is designed to ensure the optimal experience.

    Getting Started with DEM

    There are two common approaches for implementing DEM:

    Point tools: Domain-specific monitoring tools track and measure different layers of the technology stack, such as networks and applications. The upside to this approach is you get more in-depth coverage from the point tools, but it can lead to tool sprawl, which impairs visibility and increases costs.

    Platform: This approach provides native monitoring for many areas and integrates with other tools, as needed, to deliver a central, unified view that makes it easier to see everything at once. However, it doesn’t include best-of-breed performance or the deepest analysis capabilities you will want in every area.

    An important first step is to identify the metrics and outcomes priorities for your organization. Then spend time researching the proper toolset for the goals you want to achieve. If you decide on deploying multiple single-domain monitoring tools, remember that you will need an integration strategy. The tools will need to easily share data and display that centrally, to deliver a holistic view of digital experience. Integration is also critical for troubleshooting and connecting metrics to a specific business service. You also will need subject matter experts in these technology domains who can ensure that the DEM tool(s) keep pace with advancements in IT infrastructure and development technologies.

    The Future of Digital Experience Monitoring

    The DEM field is evolving, with more parts of the I&O stack coming under its purview. Solutions will offer more capabilities and be easier to integrate out of the box with other tools because the end-to-end flow doesn’t stop with monitoring and collecting metrics. ITOps staff need to take action on critical alerts with efficient workflows and intelligent recommendations. AIOps and machine learning analytics are playing a growing role here.

    DEM can reduce time-to-value for customers and workers, simplify and ease onboarding to new sites and apps and ultimately increase interactions and sales. Advanced solutions can fuel predictive analytics, form a deeper understanding of user behavior to optimize websites and apps in step with user requirements and dynamic infrastructure changes. In a digital-centric world, DEM capabilities are critical to the health and future of organizations in every sector.

  • Python Remains Popular in Programming Language Study 

    Python Remains Popular in Programming Language Study 

    A ranking by analyst firm RedMonk reflects on Python’s continued popularity as a leading enterprise programming language for a number of reasons. According to a recent study by RedMonk, JavaScript also remains widely popular as the web development programming language of choice for a significant number organizations. 

    In many ways, Python’s strong showing in the ranking — drawn from GitHub pull requests and Stack Overflow data — indicates its long-term viability among DevOps developers. 

    “One lack of change that is worth surfacing is Python’s number-two spot,” Stephen O’Grady, a RedMonk co-founder and analyst writes in The RedMonk Programming Language Rankings: January 2021. “Java was extremely hot on Python’s heels – and was, in fact, closer to the number-one ranking than to PHP behind it – but Python’s ability to defend its new high ranking is notable.” 

    RedMonk

    Python’s prolonged high ranking is notable because of its versatility, Rachel Stephens, a RedMonk analyst who is responsible for the RedMonk Language Rankings’ design, told DevOps.com. “The breadth of use cases — and associated libraries that support those use cases — means there are a number of possible entry points for developers. The number of toeholds for the language within the enterprise helps its ubiquity,” said Stephens.

    There also remains much discussion about what accounts for Python’s continued popularity beyond the scope of the study. A popular subject in forums, including Reddit, Python is typically described as highly versatile, relatively easy-to-learn and a simple, yet elegant language. While not cited in the RedMonk study, some software engineers and coders — such as this writer — appreciate how Python can make more intuitive sense, and is also less rigid compared to, say, a classic language such as C++. While JavaScript is largely used for web apps and scripts, of course, Python could arguably be the most popular language outside of the sphere of web development, thus accounting for its second-highest ranking in the study.

    As such, “due to the accretive nature of our methodology, movement within the top-ranked languages is an infrequent occurrence,” Stephens said.  

    “[However], Python overtaking and sustaining its ranking over Java was a big deal. That said, we remain strong believers in the future of Java and the Java ecosystem, and we know there is a vast amount of enterprise Java that isn’t captured in the metrics we use,” Stephens said. “We don’t view Python’s ascendence as a zero-sum gain over the use of Java.”

    For JavaScript, “in spite of all of the competition from up-and-coming languages, all the discussion of fragmentation – and even criticisms of JavaScript the language itself – it remains remarkably popular,” O’Grady said.  

    “Simply put, JavaScript remains – its detractors notwithstanding – a force of nature like no other within the industry, and there are no indications in the data that this is likely to change any time soon,” O’Grady added.

    Meanwhile, in the book Hardcore Programming for Mechanical Engineers, published by No Starch Press, JavaScript trails Python in other rankings, while Python is also more popular than JavaScript for other reasons than those described in the RedMonk study. Python, for example, is cited as the ‘The Most Wanted Language,’ based on a Stack Overflow survey. 

    While Python is not the fastest language, as measured  in benchmarks listed in Hardcore Programming for Mechanical Engineers  — Go consistently outperforms it, for example, in execution times — Python’s popularity remains very high overall, according to the book’s author.

    “These results are not surprising; Python is an extremely versatile and productive language,” author Ángel Sola Orbaiceta wrote. “Writing code in Python is a delight, and its standard library is well-equipped: for just about anything you want to do, Python has something ready to help.” 


  • How to Make Self-Service IT More Intelligent

    How to Make Self-Service IT More Intelligent

    It’s an old story: DevOps’ need for speed and agility clashes with IT’s need for security and control. Striking the right balance between control and agility is key to fostering a smooth relationship between DevOps and IT.

    Many enterprises have achieved this balance by implementing a self-service IT model. In a self-service environment, IT creates a pre-approved catalog of resources that developers and engineers can access themselves, regardless of where they are, through a single portal. These resources might include storage, compute, networking or multi-tier app stacks. Thus, DevOps can get the things they need on their own, when they need them, avoiding the IT bottleneck while IT still maintains control.

    This gives DevOps the speed and agility they want while allowing IT to maintain control. IT can place guardrails on resources, such as role-based access controls and permissions, usage quotas, cost controls, security and compliance measures. IT can also set up approval workflows to ensure visibility and management. DevOps increases efficiency and expedites time-to-market. They will also be much less likely to go around IT and procure the resources they want on their own, such as spinning up public cloud resources with a credit card. This kind of activity leads to unauthorized apps and resources running in the background without IT’s knowledge – otherwise known as shadow IT – which can create significant security vulnerabilities and cost overruns.

    So, the balance between DevOps and IT, the yin and yang of speed and control, is attained. All is well in the kingdom, right? Not exactly. While self-service IT is essential, it needs to grow more intelligent to remain effective.

    Hybrid cloud environments are changing rapidly. As helpful as most current self-service IT systems may be, a multi-cloud strategy will continue adding more layers of complexity to IT infrastructure management. While a prudent enterprise will automate as many cloud management processes as possible and have stringent guardrails in place to enforce cost and security policies, there is still plenty of room for things to go wrong when you have multiple engineering and development teams consuming cloud resources in a rapidly-changing environment.

    When various combinations of resources are provisioned in ways that IT didn’t foresee, or new tools are added that didn’t exist when existing policies were drafted, you have an environment that’s susceptible to misconfigurations and inadvertent security risks. Furthermore, tools and resources available to DevOps via the self-service portal may become outdated or not be as effective or useful as they once were. If IT hasn’t replaced or upgraded them yet, DevOps might still be tempted to go outside the system to get what they need.

    Staying on top of the evolving challenges in hybrid cloud management will require a new, more intelligent approach to self-service IT. This approach will further empower DevOps and assist IT by embedding greater awareness into decision-making processes across the organization.

    Say, for example, a developer writes a piece of code. Unbeknownst to the developer, something they just wrote in the code could potentially create a security vulnerability. The old way of preventing cybersecurity breaches resulting from flawed code entails top-down, more centralized security scans or reactive audits.

    The new, more proactive approach would leverage an advanced automated alert and visualization system that informs people about the impact of the decisions they’re making, as they’re making them. In the example above, the developer would automatically receive an alert about the security issue in the code so it can be rectified right then and there, before resource deployment.

    Similarly, this shift-left-and-rectify approach can be applied to cost control and compliance issues, as well. If resources are being provisioned sub-optimally and would incur unnecessary expenses, DevOps would be automatically alerted to the oversight and presented with a cheaper option. IT can make the solution even more cost-effective by allowing developers to take direct actions from the platform, instead of going to various portals. (According to the FinOps Foundation’s State of FinOps 2021 report, 39% of engineers do not currently have the necessary tools to take these actions). This type of intelligent automation can also ensure regulations and standards such as PCI-DSS, CIS and the AWS Well-Architected Framework are always adhered to.

    While traditional self-service IT systems still serve a vital purpose, these types of proactive cloud management and optimization initiatives will keep self-service IT agile and able to adapt to rapidly changing conditions. By embedding greater awareness into decision-making across the enterprise, DevOps functions even faster and more efficiently, and IT maintains even greater control. Hybrid cloud environments can be managed more intuitively and with greater confidence that misconfigurations and oversights that lead to security issues, cost overruns, and compliance risks will be intelligently and continuously remediated. The yin and yang endures.