When a developer pushes code to GitLab, Jenkins will trigger a predefined job using webhooks.
The Jenkins job will pull the code from version control using Git; it builds the code and makes the package as .jar file using the build tool SBT. This .jar file can be deployed into a Hadoop cluster with the help of a Spark command.
Once the deployment is completed in the Hadoop cluster, the application will start running in the background.
Initially, we can see the current running application in Hadoop (see Figure 1). It has an application ID, which is in a running state.
Figure 1
If we click the tracking UI, which is Application Master, it will navigate into the Spark streaming page.
Figure 2
In Figure 2, we can see batches are running in 40 seconds. For this scenario, we are changing from 40 seconds in the code.
When a developer makes changes to the code, he will commit in his local machine and test his code, then push to remote repository. I have updated steaming time from 40 to 50 seconds and committed.
If we can specify the Jira task number in the commit message, the same comment will be updated in the Jira task as below.
Figure 3
In the Jira application, we can see our commit message as comments.
Figure 4
GitLab and Jira integration process:
Install Git plugin to pull code from GitHub repository and SBT plugin to build and make a package as a .jar file in Jenkins.
Configure the Jenkins job under source code management and provide the Repository URL along with credentials and branch details.
Figure 5
Optional: Set webhooks to automatically trigger the Jenkins job when the push happens in GitLab.
Figure 6
In the “build” section, add the parameters clean compile package in the Actions field, which will build the code and create a .jar file.
Figure 7
Once the job has been triggered in Jenkins, monitor the Jenkins console for the next step and errors, if any.
Figure 8
Optional: If we have configured SonarQube, it will analyze the code files and provide the result in the SonarQube dashboard. This allows us to know the code quality, code coverage vulnerabilities and bugs to improve efficiency of code.
Optional: To maintain the versioning, we can upload our *.jar into Nexus/Artifactory.
Once .jar has been created, we can keep it in a specific folder and trigger a Spark job. This can be performed by triggering a Spark command from Jenkins. Execute the below command to submit spark job:
Compilation can make or break the performance quality of an application. A developer might spend weeks creating the most elegant, efficient algorithm known to man, only to have it run at a snail’s pace in production because the compiler used to create the application’s executable binary is old, and not optimized to take advantage of the enhanced performance features offered by modern hardware.
When it comes to getting the most out of code, companies in the know figured out a while ago that compilers count. Yet, for the most part, they remain a complex—if not somewhat mystical—set of technologies. I’ll admit it, for the longest time my understanding of compilation and compilers went only so far as running a make or build command. I was woefully ignorant about what was going under the covers.
But that was then, and this is now. Recently, I’ve been taking an interest in IBM’s Automatic Binary Optimizer (ABO) technology. ABO is a technology that optimizes existing COBOL code to run better in mainframe environments, without having to alter source code or modify existing compilations.
ABO intrigues meet for two reasons. First, it spurs my curiosity about mainframe compilation in general. Second, it makes me wonder how it’s possible to refine code that is already compiled and operating in a production environment.
So, I decided to go beyond my comfort zone and find the answers to some of the fundamental questions around this mysterious process. Exactly how does a mainframe compiler work? What’s the difference between a good compiler and a bad one? And finally, how does a low-level optimization technology such as ABO do its work, given that it’s being applied to code already compiled?
The following is the result of my research.
Understanding Front-End and Back-End Compilation
Compilation is the process of taking text-based source code and transforming it into a binary file that is executable against a specific piece of hardware. Mainframe computing compilation is divided into two parts: front-end compilation and back-end compilation. Front-end compilation has absolutely nothing to do with clients or GUIs. Rather, the purpose of front-end compilation is surprisingly similar to that of linting, as applied to interpreted languages. Front-end compilation is the process of making sure that the text-based source code is grammatically correct in terms of syntax, semantics, type usage and function declaration.
Once source code is subjected to front-end compilation, it’s passed on to the back end compiler for further processing.
Back-end compilation is the place where the artifact created by the front end, called the intermediate representation, is made into the binary format specific to the particular operating system and CPU of the targeted hardware. This binary file is what gets run on the targeted system. (See Figure 1).
Figure 1: Compiling COBOL source code transforms it into an opaque binary.
Back-end compilation is where the rubber meets the road in terms of machine-specific performance. A well-designed back end compiler will create binary code that’s optimized to take full advantage of the CPU architecture of the target system, squeezing out every bit of performance benefit possible. A good compiler will create a binary file that is fast to load and fast to run. However, if the underlying source code is inefficient—for example, having code that makes unnecessary trips to the database, thus creating episodic increases in network latency—no amount of back-end compilation is going to improve such runtime inefficiency. However, given that the source code is well-written, a good back-end compiler will improve overall application performance significantly. A compiler that is just so-so can do more harm than good; thus, the importance of compiler technology in the software development life cycle.
Yet, for all the benefit that it provides, there is a potential problem that is inherent in any piece of compiled code. Once source code is compiled into an executable binary, it becomes difficult to maintain—particularly when the source code is no longer available.
Compilation Creates Challenges
Unlike interpreted languages such as Python or JavaScript, in which source code is stored as plain text on a machine and executed at runtime by an interpreter, compiled code exists in a binary format that is opaque to human inspection. It’s machine readable only. Once the code is compiled, it’s “locked down” and opaque.
This creates two challenges. First, because the binary is locked down, it uses only the instruction sets that were available on the targeted system at the time of compilation. Thus, even though hardware that supports more robust instruction sets evolves, older code compiled for older systems will not be able to take advantage of the features of the modern hardware. All the compiled code can do is execute the instruction sets that were available on the older systems. The result is new hardware, yet old performance. The compiled code just doesn’t know how to move any faster.
The second challenge is that while it’s easy to change programming behavior later on by rewriting the source code from which the compiled code is created, there’s no easy way that compiled code can be changed directly. Thus, maintenance developers are left in a lurch should they need to upgrade an application for which the source code is unavailable.
In the world of mainframe computing, this is a big problem. Don’t forget that 80 percent of corporate data still resides in mainframes. There’s a lot of code out there that needs to be upgraded.
More than one company has been in the situation of having to update code that is decades old, yet both the source code and the person who created the code is nowhere to be found. The result is that companies are left with an asset that is not realizing its full value. The code remains static while significant technological advances have taken place.
There are tools that can be used for decompiling the binaries back to the original source code against which changes can be made, but the process is time-consuming and error-prone. Even if the decompiler gets it right and manages to reproduce source code that accurately reflects the original version, you still need to find a developer who can make the required changes. Such developers are in high demand in the mainframe world. Many companies simply prefer to leave well enough alone and allocate their mainframe developers to projects that have the highest return on investment.
Clearly, having a way to transform old, legacy binaries into ones that are optimized to run on modern mainframes, without having to go through a complicated decompilation and recompilation process, will benefit any company that needs to get better code to market, faster and in a cost-effective manner. Fortunately, IBM has provided a way with its ABO technology.
ABO: Solving the CompilationChallenges
ABO is designed to modernize old code without having to go through an arduous compilation/recompilation process, as described above. The way it works is interesting.
ABO works directly on the compiled binary to re-create its program structure as represented in the intermediate representation. The program structure is then passed onto the optimizer, which recompiles a new binary. This new binary takes advantage of the additional instruction sets offered by new hardware. And, it does so in such a way that the original programming logic is not altered in any way. (See Figure 2).
Figure 2: ABO performs optimization on program structures extracted from the legacy binary without affecting program logic.
For example, ABO optimizes standard math operations in COBOL such as SUBTRACT, MULTIPLY, DIVIDE and EXPONENTIATION by creating instructions in machine language that are more elegant and execute faster. No doubt, improving math operations is significant considering that COBOL is primarily used for business-oriented number crunching and correlation (being able to do math faster really counts, no pun intended), yet the important thing to understand is that the essential value of ABO optimization is that it’s taking advantage of the advanced instructions sets offered by the new target system. Remember, running older compiled code on new systems is not going to make that much of a difference in performance. In the PC world, it’s the same as running 32-bit code on 64-bit machines. Sure, in most cases it will work, but the code will never go beyond the efficiency of the low-level instructions supported by 32-bit processors.
Yes, there is some performance boost that can take place without having to recompile due solely to the improved clock speed of the CPU. However clock speeds on new mainframe models are beginning to plateau. As clock speed levels off, so will the time it takes for code to execute on the processor. This fact has not been lost on mainframe designers. New ways of enhancing overall performance, beyond simply moving the bits through the processor faster, are being devised. Sadly, there is no magic in play; for legacy code to realize better performance that’s not dependent solely on clock speed, the code will need to be compiled.
Recompiling from scratch using the source code is viable, but doing so is expensive. And, if that recompilation affects any part of the source code, additional testing needs to take place. Thus, the cost of change is increased due to both the expense of hands-on development and the added testing.
ABO, on the other hand, works with existing binaries. The result is an upgraded binary that’s optimized to the latest mainframe technology. In addition to having state-of-the-art code that’s fast and efficient, a company saves time and money in the refactoring process. It’s pretty amazing when you think about it.
What does such increased efficiency look like? IBM is reporting 24 times the reductions in CPU consumption time. That’s a substantial number.
Now, granted we’re talking about optimizing existing functionality. Refactoring an existing application to add new features requires code rewrites, no question about it. Yet, there are a lot of applications in play today that are doing what’s required. The problem is that they’re performing poorly and slowing down workflows overall. Optimizing existing binaries means not only that applications can have better performance, but that entire workflows become more efficient as more room is made for other applications to run.
Putting It All Together
Making legacy code better is, and has been, a continuous burden for companies since the first days of computing. Updating code is difficult enough when the source code and developer who wrote it are available to do the work. When both are absent and all that’s left behind is an executable binary, refactoring the application becomes a herculean set of tasks. Decompilers will only get you so far.
Fortunately, an optimization technology such as ABO makes things easier. ABO modernizes legacy binaries without the need to have the source code on hand. The result is improved system performance, reduced costs and faster release cycles.
As those of us who have been out on the terrain have learned, the rate of change in computer technology never slows down. It only goes faster. Companies that can adapt to the breakneck speed of technological innovations will prosper. This includes companies that rely upon mainframe technology to get work done. Reducing the time it takes to optimize legacy code is essential to stay competitive in today’s marketplace. For those companies that rely upon mainframe technology to get work done, ABO’s ability to optimize code directly against existing binaries provides a transformational advantage that is difficult to ignore.
Artificial intelligence (AI) is starting to be applied to the writing and update test scripts. Perfecto has unfurled Perfecto Codeless, which employs machine learning algorithms to automate writing of test scripts in a way that allows them to not only run continuously, but also adjust to changes made to the application.
Eran Kinsbruner, chief evangelist for Perfecto, a unit of Perforce, said writing test scripts is still largely a manual process, which means as the number of applications being developed continues to escalate, the testing process becomes highly constrained.
To address that issue, Perfecto has created a codeless approach delivered via a cloud service as part of the company’s Smart Automation platform. If any code within an application gets deleted, moved or changed, the changes will automatically be reflected in the test script. That capability eliminates the need for DevOps teams to wait for a developer to update the test script.
Exactly who in an organization is writing those test scripts varies: Kinsbruner noted that many developers now prefer to write their own test scripts during the development process before their code is reviewed by a peer. That approach eliminates many of the more routine errors, enabling more time to be spent on optimizing code. Other organizations employ dedicated testers who spend most of their time writing test scripts. But many of those organizations are finding that testers cannot keep pace with the current rate at which applications are being developed in the DevOps era.
There’s no doubt machine learning algorithms are about to play a much bigger role in application testing and DevOps at large. AI is not going to replace DevOps teams anytime soon, but many mundane functions such as the writing of test scripts can be automated using machine learning algorithms. Arguably, testing is one of the areas that lends itself most to emerging AI-based platforms and services. After all, if testing becomes a bottleneck, the chances that applications with issues are deployed in a production environment increase substantially. Many of those issues can be fixed easily, but many times at the risk of annoying end users who increasingly are unforgiving when it comes to application experiences. It’s not uncommon for users to discontinue using a mobile app if the first experience isn’t immediately gratifying.
Of course, many DevOps teams already view machine learning algorithms with a certain amount of skepticism. But the rise machine learning algorithms within DevOps is now all but inevitable. IT leaders, however, should realize it may take a while for those algorithms to learn the environment. The return on investment for any AI project is not likely to be immediate because a significant amount of time needs to be invested in training the algorithms. The good news is, those algorithms never take a day off and suddenly don’t resign one day to take a better-paying job elsewhere.
Fresh off raising an additional $20 million in funding, the Blameless platform provides across-the-board visibility into the complex network of application programming interfaces (APIs) and applications distributed across an organization, said CEO Ashar Rizqi. Specific modules within the Blameless platform address incident resolution, reliability insights dashboards, postmortems, service level objectives (SLOs) and automatic error budget calculation.
Blameless takes its name from an SRE principle that no one should be held at fault when complex systems fail. Rather, the assumption should be that inherent complexity of the IT environment is at fault. While DevOps is more of a philosophy surrounding the management of DevOps, SRE is emerging a more prescriptive instance of implementing DevOps that Google is now promoting. The goal is to make sure that whatever the issue, the right people to address it are brought together at the right time, said Rizqi.
The Blameless platform was created by Lyon Wong, who now serves as the COO of Blameless. Previously, Wong was a partner at Lightspeed Venture Partners, founder of S28 Capital and a product manager for Microsoft Windows. Rizqi is a former head of core platform at MuleSoft and SRE manager at Box.
Rizqi noted that while most organizations are trying to embrace DevOps principles, they often lack the tools needed to build the workflow processes required. All too often, organizations rely on little more than a Wiki document to manage their response to an incident. The Blameless platform is designed to provide access to an integrated set of tools for managing everything from the incident itself to the impact that event had on the business, he said.
It’s still too early to say with any certainty how widely SRE practices will be adopted. This far, most organizations that have adopted DevOps have tended to prefer to define a set of processes that are customized to their environment. But there are just as many, if not more, organizations that have found it daunting to get started. Platforms such as Blameless represent an opportunity for those organizations to embrace DevOps using a more prescriptive approach.
Of course, a big part of the reason that DevOps has been embraced unevenly by various departments within the enterprise is the lack of a consistent approach to implementing DevOps at scale. Teams that have embraced DevOps with enterprises have tended to create their own individual processes using a wide variety of tools. Many of those organizations have also found it challenging to get IT operations teams to embrace those processes because they require an approach that can be implemented consistently across multiple projects at scale. SRE provides IT operations teams with a framework that Google has already proven works at scale.
Regardless of the path chosen, the one thing that is for certain is more agile approaches to managing IT operations will be required to keep pace with the rate at which applications are now being developed and deployed.
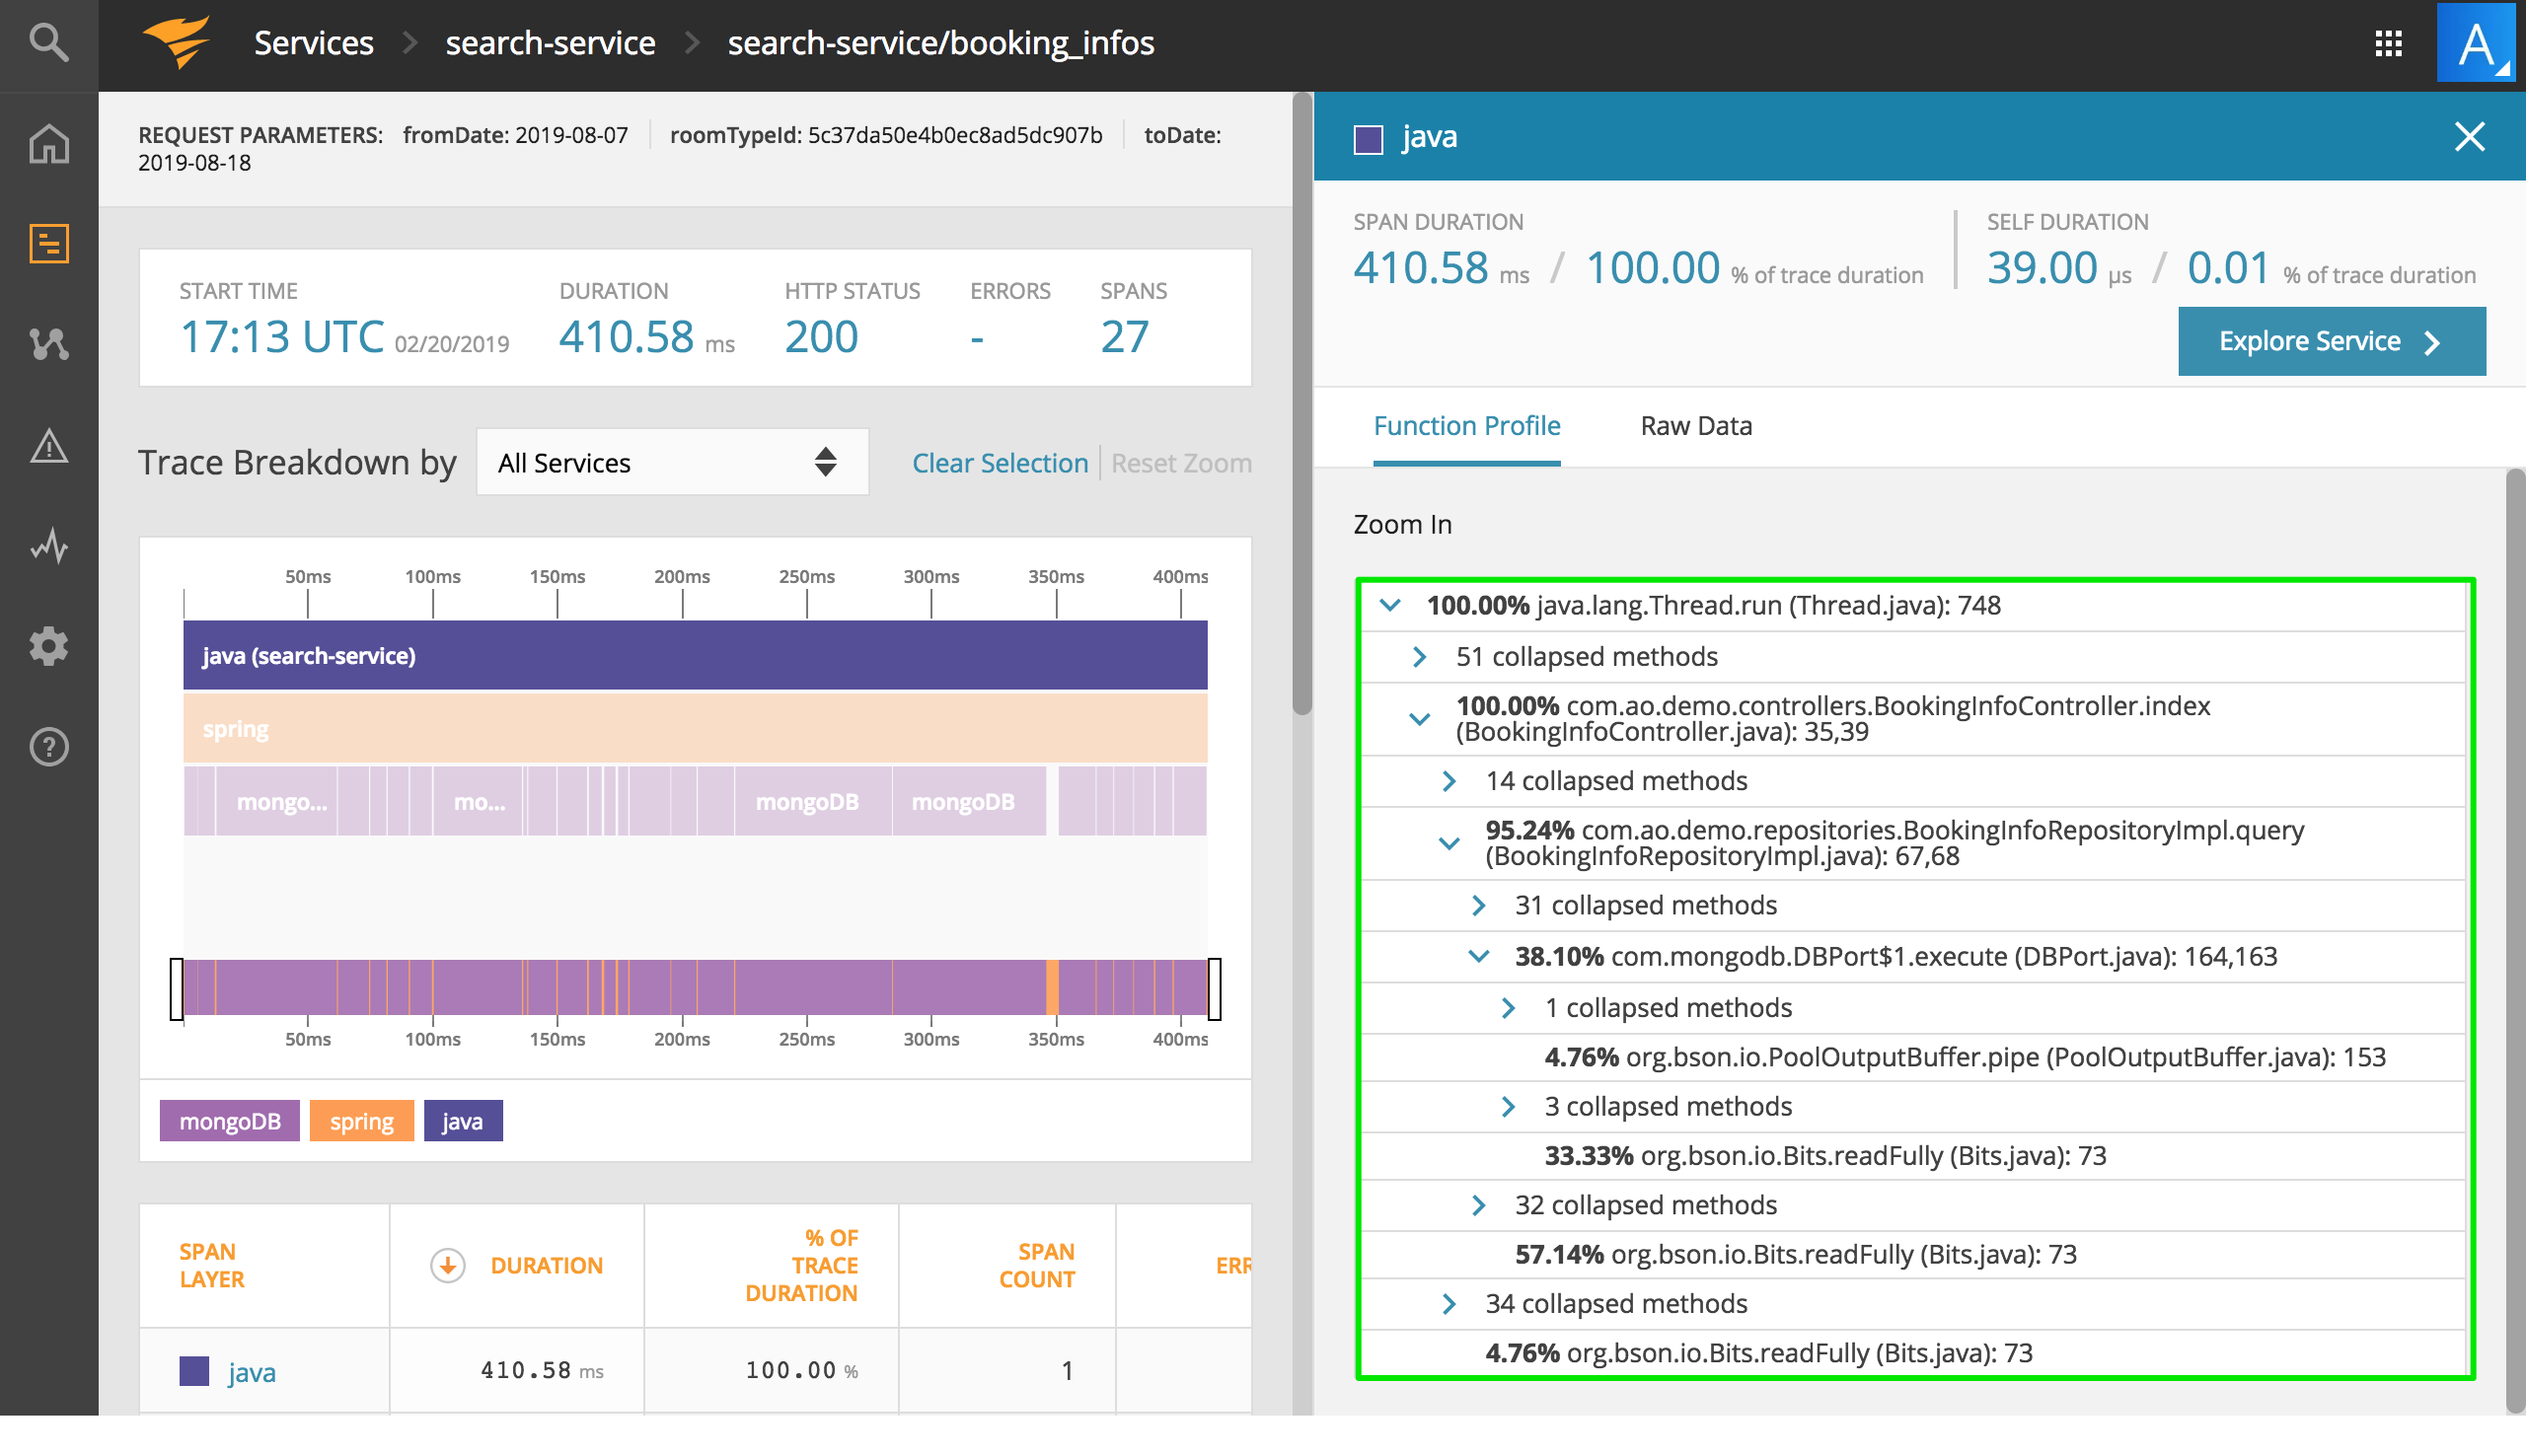
Keith Kuchler, vice president of engineering for SolarWinds, said live code profiling provides a breakdown of the most frequently called functions and methods in a transaction, including class, method, filename and line number. That capability makes it possible for DevOps teams to identify what line of code might be causing a performance issue without requiring any changes to the code itself, he said.
According to Kuchler, the ability to profile live code extends a distributed tracing capability that SolarWinds previously incorporated into SolarWinds AppOptics. Collectively, the two offerings show how committed SolarWinds is to providing DevOps teams with access to advanced capabilities at a fraction of the cost of rival APM platforms delivered as a software-as-a-service (SaaS) application, said Kuchler. Pricing for SolarWinds AppOptics starts at $7.50 per month. SolarWinds AppOptics is part of what SolarWinds describes as a DevOps Toolkit that also includes Pingdom, a website performance monitoring tool, Papertrail, a log management service, and Loggly, a log analytics service.
The ability to profile live code supports applications written in Java and PHP, with support for additional programming languages forthcoming, said Kuchler. The goal is to reduce the amount of time DevOps teams need to spend guessing where the source of any issue might be after an application is deployed or updated, he added.
As the rate at which applications continue to be deployed and updated, DevOps teams need to be able to pinpoint issues at the code level to enable developers to address that issue as soon as possible. Sharing a bunch of generic alerts typically doesn’t provide a developer with enough actionable intelligence to solve the problem. Not surprisingly, a recent survey of over 300 developers conducted by SolarWinds finds that most of them spend a lot more time troubleshooting existing applications versus writing new code. All that time spent troubleshooting code winds up having an adverse impact on the ability to make the transition to DevOps.
In general, SolarWinds is trying to expand the total APM market by making its tools available as a service that organizations of any size can invoke. Historically, reliance on APM tools has been limited to mission-critical applications mainly due to cost. But over time, the number of applications deemed to be mission-critical has increased. In addition, because of the all interdependencies between applications, the potential impact a single line of code can have across the enterprise IT environment can be substantial. As a result, the need for an affordable approach to APM has become more acute.
Naturally, it will be interesting to see how much pressure there is on APM pricing over the course of the coming year. Competition between providers of APM platforms is already fierce. The challenge will be finding a provider of an APM platform that not only provides all the capabilities required, but also has deep enough pockets to be around for the long haul.
DevOps tooling seems to be in a never-ending state of self-transformation. The continuing evolution of infrastructure and the tools that go with it are forever creating new ecosystems. On the infrastructure side, we saw VMWare, Citrix and other companies bring to market massive virtualization in the late ’90s and early ’00s. This, of course, prompted a little bookstore in Seattle to unleash something known as “the cloud,” forever changing the way developers push code to production.
The cloud, of course, is just an API around virtualization. A lot of the infrastructure changes prompted configuration management software, including Chef and Puppet, to emerge. Puppet is now 15 years old and Chef is around 10; even Ansible is now 7 years old.
In the past years, we’ve seen tools such as Terraform emerge and other higher-layer infrastructure, such as Docker, which led into Kubernetes. There’s a lot of tooling out there to make applications run on servers. Just as the containers/Kubernetes ecosystems have tried to implement change on top of virtualization infrastructure, we are starting to see developers dig back down into the operating system layer to improve infrastructure there. This leads us to our topic today: unikernels.
Unikernels are single-purpose virtual machines (VM). They only run one application—which is interesting when you think about it, because that’s precisely how a lot of DevOps practitioners provision their applications today. There is way too much software to provision nowadays—pools of app servers, clusters of databases, etc. Unikernels are fast to boot, fast to run, small in size, way more secure than Linux or containers and, if you have access to your own bare metal—either in your data center or through a provider—you can run thousands of them per box.
Some stats? Some can boot in less than five milliseconds—that’s slightly slower than calling fork (three milliseconds) but orders of magnitude faster than Linux. Some can run databases including Cassandra and MySQL, 20 percent faster. Some people (yours truly included) have provisioned thousands of them on a single box with no performance degradation. Some are reporting them running as a VM faster than a comparable bare-metal Linux installation of that application. Clearly, this is worth investigating.
There are many different methods that a given organization can take to provision software, but it’s pretty clear that popping into a server over SSH and sudo apt-get install something is very much of a downtrend. Phrases such as “immutable infrastructure” and “continuous deployment” fly right in the face of this sort of practice. You are either rebuilding your containers, rebuilding your instance or both. Unikernels really embrace this model as there is no apt-get-like functionality in them and you can’t log in to them remotely. They don’t even have the concept of users, mainly because at the end of the day, why do you even need them?
At scale, it’s getting more difficult by the day to make the argument for this construct. If the app is misbehaving, shoot it in the head and take it down. Debug the reason locally. It’s extremely rare for an end user to reason that there is something wrong with the host operating system.
In a unikernel, the only reason you’ll see a reference to a user is that most apps will demand to be run as a particular user or do things such as check for root privileges. In our case, if you look at underlying calls such as getuid, they are just stubs because we don’t need or use them. Keep in mind that this isn’t the mid-’90s anymore. We don’t have boxes laying around, where there are half-dozen users all running their code on the same box anymore. That model has long been gone. Unikernels don’t have shells and don’t have the notion of running other programs besides the one that is running.
If it’s easier to think about, consider that unikernels are much more like processes than they are like operating systems, although they share characteristics of both. While many link, the application in others will load. Unikernels are a concept that are largely misunderstood because everyone assumes it’s somehow like Linux. Just as unikernels are not just “containers 2.0,” unikernels are very different from Linux as well. Linux is a general-purpose operating system, while unikernels only run one application. Linux was made to run on bare metal, while unikernels are made to run as VMs. Keep in mind Linux predates VMWare by a solid eight or nine years and the cloud by many more. Operating system researchers wanted to go this route in the ’90s, but we just weren’t ready yet.
Another way to think about them is that they implement a sandbox for server-side applications. Much in the same way that the Chrome browser isolates each tab from each other to prevent one evil site from messing with another browser tab, unikernels prevent one application from messing with another application. Although under the hood, the technical implementation is quite different. More importantly, the unikernel single-process model eliminates the capability of running other ad-hoc programs inside the same VM. This is a huge blow to attackers who wish to run other programs on the same machine. It doesn’t prevent things such as remote file inclusion (RFI) attacks for various scripting languages, but for compiled and VM runtimes, it’s a striking blow because it deals with the fundamental problem of attackers using exploits only as a key to enter the server. Once they are on the server, they want to run their programs such as mysqldump or a cryptominer. They could care less about your software. Those organizations practicing shift-left security, or zero-trust infrastructure, should be keeping the development of unikernels on their radar.
However, unikernels are not without their problems. These are computers we are talking about here. One of the larger problems for unikernel adoption was that to build them, you had to be a lower-level systems engineer doing things such as twiddling CFLAGS in makefiles or patching foreign codebases you’d never patch yourself. This was problematic and something we wanted to fix with a new open source tool. So, we opened up OPS—which can take any existing Linux application and run it as a unikernel, making their use a lot easier.
If you’ve made it this far, I’m going to reward you: Let’s build and run a unikernel right now. Then, at least, the next time someone asks you if you’ve used them before, you can say yes.
First thing is, you’ll want to grab OPS. You can paste this into a Linux or Mac shell, and it will download and install itself:
var http = require('http');

http.createServer(function (req, res) {

res.writeHead(200, {'Content-Type': 'text/plain'});

res.end('Hello Worldn');

}).listen(8083, "0.0.0.0");

console.log('Server running at http://127.0.0.1:8083/');
This is simply a small little web server that listens on port 8083.
At this point you might be asking yourself, Do I need to install node on my system? The answer is no—not unless you plan on using external packages.
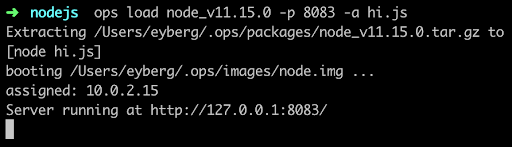
Now we can run it:
If it’s the first time you run ops, it will first download a node “package,” which is the interpreter and anything else it needs to run. For some languages, such as Python and Ruby, this can be substantial.
Then it builds a small disk-bootable disk image that contains your application code and, as you can see, boot straight into it. There is no init manager like Linux and there aren’t 30 different services that get fired off. Keep in mind this is a single process running.
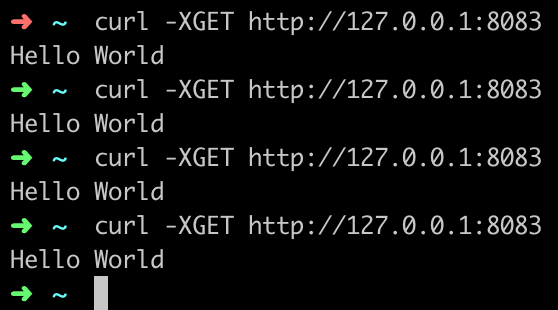
Now you should be able to hit it up with curl and see it run:
You’ve just built and run your first unikernel. How cool is that?
As certain trends such as “serverless,” “functions as a service,” and “no ops” gain steam, these concepts go hand in hand with unikernels. DevOps practitioners at organizations that use microservices and containers will also want to take notice as the amount of work to deploy artifacts such as these decrease considerably. Why is that? One of the many problems that containers had to struggle with was that all the existing underlying infrastructure layers that live at the virtualization layer, such as file systems and networking, had to be shifted up a few layers. Not only did this introduce performance and security challenges, but it also threw out the 20 years of virtualization software and ecosystem development that already existed. What’s interesting about unikernels is that they are always deployed as VMs, so they get to re-use a lot of the underlying ecosystem that has been existent, with very little or no change required.
From an adoption standpoint, unikernels are flying at ultra-sonic speeds under the radar. A lot of people are not aware of how many projects or organizations are working on unikernels today. Unikernels are starting to attract major attention from many various groups and institutions. Even famous, old stalwart Linux contributors such as Ulrich Drepper, the maintainer of libc, are working on unikernel projects today. Now there are even foundations and consortiums for unikernels. One recently announced was the UNICORE project. IBM even listed its No. 1 cloud patent recently as a hypervisor built for unikernels.
If you’re are a self-described DevOps person, it’d behoove you to learn more about unikernels and start playing around with them to understand them better. They aren’t going to kill Linux and they’re not going to kill containers, but do expect to see massive adoption in the coming years—not just because of their security and performance benefits, but because of the new forms of compute they unlock.
VMware today advanced its hybrid cloud strategy by making a series of updates to existing offerings, including the CloudHealth by VMware software-as-a-service (SaaS) application for managing and optimizing cloud applications, which VMware acquired last summer.
In addition, VMware Cloud on AWS is now available in data centers operated by Amazon Web Services in Canada, Paris and Singapore, the company noted. VMware also announced that the latest version of VMware Cloud Foundation—which provides and automatically updates all the VMware compute, storage and networking software required to build a cloud—has been optimized to deploy VMware Horizon virtual desktop infrastructure (VDI) software, and will available on Dell EMC VxRail hyperconverged infrastructure in April.
New capabilities being added to CloudHealth by VMware include enhanced multi-cloud reporting, multidimensional reporting and workspaces reporting.
The CloudHealth platform also is now integrated with the Wavefront by VMware cloud analytics and monitoring platform, enabling users of CloudHealth to employ Wavefront metrics to rightsize and optimize applications running on multiple cloud applications as part of their DevOps practices.
A future update to the CloudHealth platform will add enhanced amortization as well as support for convertible Reserved Instance (RI) exchanger automation, container cluster visibility and cross-family rightsizing for Amazon EC2, according to the company.
Finally, VMware announced it is making available version 9.7 of VMware vCloud Director to cloud service providers. This offering provides a single pane of glass through which multiple VMware environments can be managed regardless of whether they are deployed on-premises or in the cloud. The latest version of VMware vCloud Director adds support for version 3.0 of VMware Cloud Availability, which unifies onboarding, migration and disaster recovery services between multi-tenant clouds. VMware vCloud Director is only available to cloud service providers, but Ajay Patel, senior vice president and general manager for the cloud provider software business unit for VMware, said VMware and its cloud service provider partners plan to make available a software-defined data center (SDDC)-as-a-service offering through which they will manage deployments of VMware from the edge to the cloud on behalf of IT organizations.
VMware also revealed there are now more than 60 partners building or delivering managed service offerings for VMware Cloud on AWS, and more than 280 partners have achieved the VMware Cloud on AWS Solution Competency. VMware also now has 35 VMware Cloud Provider Program partners that have achieved Cloud Verified status, which is required to be eligible to deliver the forthcoming SDDC-as-a-service offering. Patel also revealed the number of organizations running instances of VMware on public clouds now exceeds 1,000, in the wake of the launch of VMware Cloud on AWS last year.
Patel said the shift to hybrid clouds is more about transforming IT operational models than it is about deploying workloads at new physical locations. The challenge many IT organizations will need to come to terms with going forward is deciding what portions of that IT operational model they want to run themselves versus opting to rely on VMware and its partners.
Continuous integration (CI) calls for code to be always working. Continuous delivery (CD) and continuous deployment mean that we must be able to roll out a working configuration to production at any time. As DevOps becomes the norm, bugs in production are now a developer’s personal problem. Developers (and their managers) want to know immediately if code changes they are working on can break something.
What is Continuous Testing?
The only guaranteed way to prove code and configurations are working is to test them. That’s why we need continuous testing. In organizations making this transition, performance engineers and test automation experts shift from minding a backlog of test-building work, to facilitating a democratization of testing. Everybody builds their code and everybody tests their code, continuously.
Continuous testing is becoming the “new normal.” In this modern and agile testing approach, developers are equipped with low-friction testing capabilities and tools and are expected to unit test any new or updated code. With testing shifted all the way left to developers in pre-production, and all the way right to post production monitoring, organizations are just seconds away from proving code is ready and working to acceptable service levels.
Although continuous testing is becoming a more standard practice, it certainly presents unique challenges for execution.
Lack of clear requirements can result in wasted time and delays. Behavior-driven development (BDD), acceptance test-driven development (ATDD) and model-based testing using tools should be used so that all requirements are clearly documented and communicated.
Test cases need to be clearly defined and test scripts created ahead of time, to enable continuous testing of code at all stages of production.
Optimize Testing Processes and Test Coverage
Save time, money and resources by testing only what you need to test. Visual models allow various paths to be explored and optimized so that only your tests provide maximum coverage, without unnecessary testing.
It is also recommended to import test cases, remove duplicates and distribute and allocate optimized test cases in existing tools.
Shift-Left Your Testing (and Shift It Right as Well)
What do we mean by shift-left testing? Tests should be run earlier in the development cycle. Developers test as they go, with test automation including functional testing, performance testing, monitoring and security testing. This requires developer-friendly tools for easy adoption and use.
By shift-right testing, we continue to test through production and post-production, including continuous monitoring. Gartner recently released a report on the shift-right testing, calling it a “must” for adopting DevOps practices.
Provide Complete Test Environments
The ability to provide virtualized test environments is critical to achieving continuous testing. Eliminate blocks and reduce wait times by providing complete test environments on demand, with dev-friendly tools (as code, CI/CD integrations, supported open source). These environments should include test data on demand to ensure that teams can perform comprehensive tests with production-like data. These environments should be ephemeral; ready on demand, decommissioned after use.
Get the Right Test Data
The inability to get robust test data causes significant delays in many application release cycles. To accurately test new functionality, test data should be as close as possible to what the application will encounter in production. If the test data lacks certain real-world characteristics (i.e. actual fields, data specifications, negative scenarios, etc.), the tests are unlikely to find many potential issues or break the application where there are weak points. Understanding data models in order to extract the right data is a special skill in and of itself.
Production data is clearly the best data to use for testing, but data privacy regulations and team silos often restrict its availability. The answer to this dilemma is a robust test data management tool that lets you copy production data and mask it to protect sensitive information, while maintaining the characteristics that make production data desirable for testing.
Remember, continuous delivery and continuous testing are processes that can take time to implement successfully, but teamwork, continuous feedback based on data and the right tool set will help you on your journey. You can read more about implementing a continuous testing policy here.
Chef today announced it will make it easier for organizations that adopt its IT automation framework to stay compliant with mandates such as the Federal Information Processing Standards (FIPS), Secure Technical Implementation Guidelines (STIG) and the Center for Internet Security (CIS) certification.
John Snow, senior software development engineer and federal content lead for solutions engineering at Chef, said it’s incumbent on the provider of an IT platform or application to make sure their offerings comply with widely required mandates. FIPS compliance, for example, not only applies to federal agencies, but also any organizations that interacts with those agencies.
Specifically, Chef said it has achieved FIPS compliance along with providing an implementation of STIG profiles for RHEL 7 and Windows Server 2016 in Chef InSpec and achieving a (CIS) certification for Amazon Web Services (AWS) Foundations Benchmarks Level 1 and 2 in Chef Automate. Chef claimed it is the first vendor to achieve CIS certification across AWS, Microsoft Azure and Google Cloud Platform.
Snow said Chef was able to achieve that goal in part because of the time and effort it put into developing a parser that enabled the company to approach compliance as a programmable extension of its development process. That translation process is required because most compliance mandates are written for auditors by auditors, not by IT operations teams. Chef will also leverage that capability to ensure its platforms remain current with any future updates to the compliance mandates its supports, said Snow.
Chef has been making a case for treating compliance as code for several years now. Any given compliance mandate typically consists of a set of controls that need to first be put in place and then tested and validated. Rather than trying to achieve that goal relying on manual processes that don’t scale, Chef contends achieving compliance should become a natural extension of best-in-class DevOps processes.
It’s not clear yet to what degree compliance may become integrated within DevOps. But recent advances in DevSecOps suggest it’s only a matter of time before responsibility for implementing compliance controls “shifts left” along with security control. Compliance teams may define what controls will need to be put in place. But responsibility for implementing those controls as part of any quality assurance process is moving toward DevOps teams. Developers, however, will take on that responsibility only when a means to programmatically implement those controls is readily available.
The long-term economic implications of that shift may prove to be profound. Organizations of all sizes incur massive costs both implementing compliance controls and having them audited by a third party. As the compliance process becomes more automated, not only does it become easier to implement controls at scale, but the documentation required to pass an audit is generated automatically. Given that most auditors charge per hour for their services, the savings derived from limiting the time and effort associated with preparing for and then passing an audit could be substantial. The challenge and opportunity is educating the DevOps team on not just how much money might be saved for the company, but also how much of that money might be reinvested in advancing DevOps adoption.
LightStep announced a stand-alone dynamic tracing tools capability that visualizes patterns in code based on 100 percent of the data available.
Company CEO, Ben Sigelman, said LightStep Tracing differs from other approaches to tracing because it does not rely on a small sample of data that usually doesn’t wind up providing much actionable insight. Instead, LightStep Tracing makes it possible to search and visualize distributed traces across 100 percent of the data made available with a software-as-a-service (SaaS) application.
Unveiled at the QCon London 2019 conference, LightStep Tracing is based on functionality originally developed in the application performance management (APM) platform, dubbed LightStep [x]PM, that is optimized for microservices-based applications. LightStep Tracing, however, does not require DevOps teams to implement LightStep [x]PM to take advantage of distributed tracing.
Distributed tracing is becoming more widely employed because that capability makes it much simpler to visualize patterns indicative of a potential performance issues. Sigelman built one of the first instances of distributed tracing during his tenure at Google. Known as Dapper, the project now analyzes more than two billion transactions per second. Sigelman subsequently co-created the OpenTracing Application Programming Interface (API) standard that is now made available under the auspices of the Cloud Native Computing Foundation (CNCF).
According to Sigelman, one of the most common mistakes many DevOps teams make today is overvaluing a distributed trace as a data source. While access to distributed traces are required, the real value comes from being able to dynamically inspect 100 percent of all the traces available in a way that visually surfaces patterns, added Sigelman. DevOps teams should be careful what conclusions they draw from analysis based on samples of data because outliers that could have a significant impact on application performance can be easily missed, cautioned Sigelman.
LightStep Tracing provides DevOps teams with access to dynamic system diagrams that visually summarize the bottlenecks, as well as real-time performance histograms enable organizations to understand what defines normal application behavior in their environment. Sigelman said that DevOps teams, for the first time, can also capture shareable snapshots of system behavior that explain performance anomalies based on statistical summaries of thousands of relevant traces. Within minutes, Sigelman said LightStep Tracing can be employed to instrument and visualize service-to-service interactions across web, mobile, microservices, serverless and monolithic applications.
One of the more frustrating aspects of DevOps is that most teams will spend far more time looking for the source of the problem, versus fixing it. But until the source of a problem can be identified, the reputation of the IT organization in the eyes of the application owner continues to suffer. There’s also an unfortunate tendency for DevOps teams to spend an inordinate amount of time in “war rooms” trying to proof that whatever element of the IT environment they manage is not part of the root cause of the problem. Rather than wasting all that time at the expense of the reputation of the IT organization, perhaps the time has come to discover and visualize issues hopefully long before any application owner even becomes aware they exist.













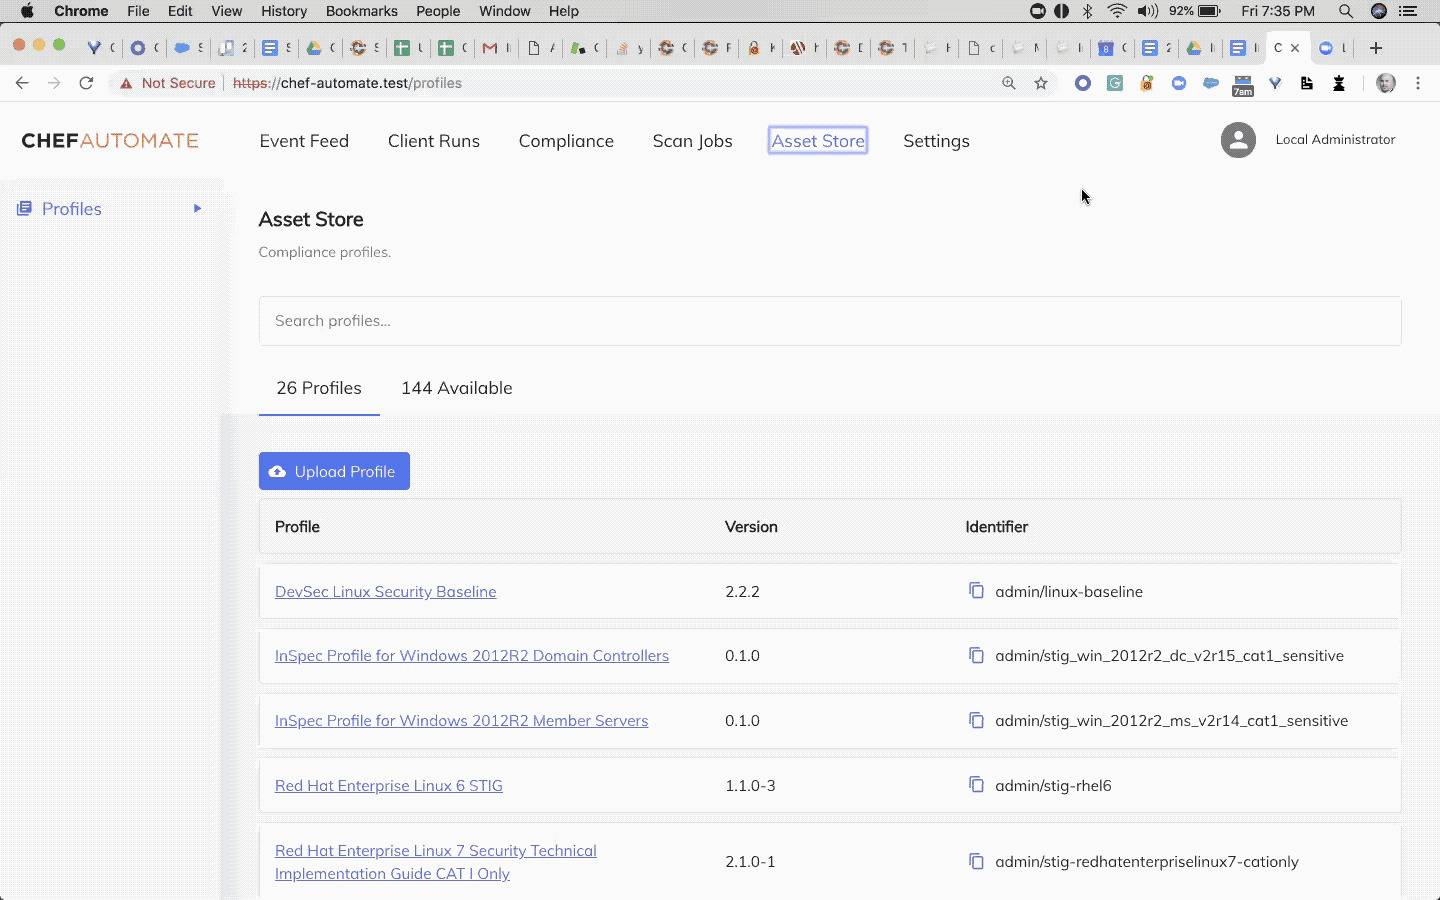 Specifically, Chef said it has achieved FIPS compliance along with providing an implementation of STIG profiles for RHEL 7 and Windows Server 2016 in Chef InSpec and achieving a (CIS) certification for Amazon Web Services (AWS) Foundations Benchmarks Level 1 and 2 in Chef Automate. Chef claimed it is the first vendor to achieve CIS certification across AWS, Microsoft Azure and Google Cloud Platform.

 Unveiled at the