Category: DevOps Toolbox

  • Hasura Extends Scope of GraphQL API Platform

    Hasura Extends Scope of GraphQL API Platform

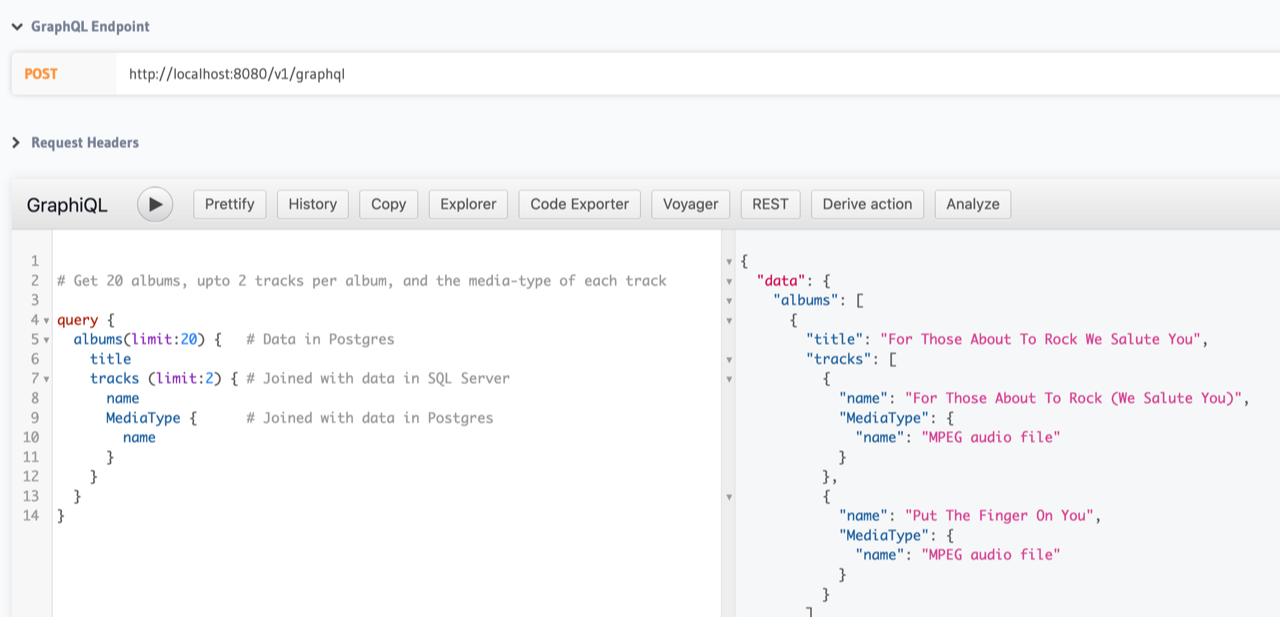
    During its online an HasuraCon ’21 conference, Hasura today announced that it has made it possible for developers to employ GraphQL application programming interface (APIs) to launch queries against data residing in multiple databases.

    At the same time, Hasura announced a preview of schema sharing capabilities along with support for workflows based on GitOps processes that it will make generally available later this year. The Hasura Cloud platform can now deploy local migrations from staging to production with a simple git push in addition to accessing previews of applications on every pull request to the git repository.

    The schema sharing capability added to the Hasura GraphQL Engine is intended to bridge the gap between beginner and power users by allowing them to share and install samples of permissions, relationships and metadata. In addition to improving collaboration, the goal is to make it easier to onboard software engineers as projects evolve and become more complex.

    Originally developed by Facebook, GraphQL has emerged as a popular alternative to REST APIs because it enables developers to retrieve data at a more granular level, which results in improved performance.

    Hasura is a provider of an instance of a GraphQL engine the company has developed around a project that is now hosted by the GraphQL Foundation, an arm of the Linux Foundation. The GraphQL Foundation counts among its members Airbnb, Amazon Web Services (AWS), Apollo, Coursera, Elementl, Facebook, GitHub, IBM, Intuit Hasura, Paypal, Prisma, Shopify and Twitter.

    GraphQL provides a complete description of the data made available via an API and is organized in terms of types and fields rather than traditional endpoints. In addition to clarifying what data is available via that API, developers can employ types to avoid writing manual parsing code.

    Since last summer, Hasura has been making available a pilot of a GraphQL implementation that is capable of supporting remote joins across disparate databases. That capability is critical because data sets that are related to a specific business process may wind up being stored in multiple databases.
    Hasura

    Tanmai Gopal, Hasura CEO, said the open source Hasura GraphQL Engine has already been downloaded more than 250 million times this year. Downloads in 2020 reached 100 million. The challenge is that while GraphQL offers a superior alternative to REST APIs, most of the API tooling that exists within organizations is still designed around REST APIs, noted Gopal.

    To accommodate that reality, Hasura has made a tool available that will convert a query designed using GraphQL into a set of calls that are compatible with REST APIs. Developers still gain the benefits of being able to launch more granular queries, noted Gopal.

    REST APIs, in general, are becoming more problematic as organizations embrace microservices-based applications. It often takes minutes to refresh a simple dashboard because of the amount of data that REST APIs are trying to pull from various data sources. As organizations embrace digital business transformation, they are also encountering application latency issues that can be traced back to the amount of data being called from multiple microservices.

    Hasura says in addition to providing a more efficient method to access data, Hasura is also working on adding caching capabilities to its core engine to further improve performance.

    It’s not clear at what rate GraphQL might replace REST APIs, but DevOps teams should assume organizations will wind up employing a mix of both for years to come. The challenge is going to be determining when to make the transition as organizations become more dependent on APIs.

  • Salesforce Pilots Series of DevOps Initiatives

    Salesforce Pilots Series of DevOps Initiatives

    At its online TrailheaDX 2021 conference, Salesforce today unveiled a DevOps Center pilot that provides a portal through which organizations can track and manage changes to Salesforce applications along with a unified command line interface (CLI) for all its applications.

    In addition, Salesforce plans to add Salesforce Functions to enable developers to deploy code in a serverless environment.

    The company has also promised to extend its low-code App Builder tool to include support for Dynamic Interactions, a capability that enables both professional and citizen developers to add reusable components to any application. The company has also added a Customer Identity Plus tool that enables developers to consolidate and manage customer identities.

    Finally, Salesforce is adding an Einstein Automate tool that employs machine learning algorithms to both integrate data and automate workflows that can invoke, for example, an existing MuleSoft Composer tool for integrating applications using a Flow Orchestrator that will be made available as a pilot project this summer. MuleSoft is a subsidiary of Salesforce. There is also now an Einstein Data Detect tool that ensures organizations adhere to data privacy laws by employing machine learning algorithms to discover when developers might have inadvertently exposed sensitive data.

    Dynamic Interactions, Salesforce Functions and CLI unification are expected to be generally available in the winter of next year, while the Einstein capabilities are expected to arrive this summer.

    Ryan Ellis, senior vice president of product management for platform at Salesforce, said the company is making a concerted effort to make it easier for both professional and citizen developers to build applications within the same environment by fostering collaboration via a DevOps Center portal that is expected to be generally available in the spring of 2022. Today the skills that any citizen developer can bring to bear are generally limited, largely because they don’t typically know how to build a well-designed, secure application that will truly scale in an enterprise IT environment.

    Salesforce

    However, as more artificial intelligence (AI) capabilities are added to low-code tools the amount of developer guidance being provided will increase over time. That additional guidance will enable citizen developers to build robust applications more reliably, noted Ellis.

    In the meantime, the primary beneficiaries of low-code tools continue to be professional developers that employ them to build applications faster than they could otherwise using procedural code.

    In general, Ellis said the relative DevOps maturity of organizations building and deploying custom applications on top of the software-as-a-service (SaaS) platform managed by Salesforce continues to increase steadily. In the wake of the COVID-19 pandemic, many organizations opted to extend existing SaaS applications provided by Salesforce to accelerate digital business transformation initiative using low-code tools rather than developing every application from scratch using procedural code.

    Of course, as the rate at which those applications are being built continues to accelerate, the next big challenge is managing the application life cycles after they are deployed.

    It’s not clear what the ultimate mix of applications built using low-code tools versus procedural code will be. Millions of lines of code are now being regularly deployed on Salesforce platforms, noted Ellis. It may be a little while before Salesforce is able to bring DevOps best practices to all that code, but, starting today, the journey has begun.

  • Plutora Dives Deeper into Value Stream Analytics Data

    Plutora Dives Deeper into Value Stream Analytics Data

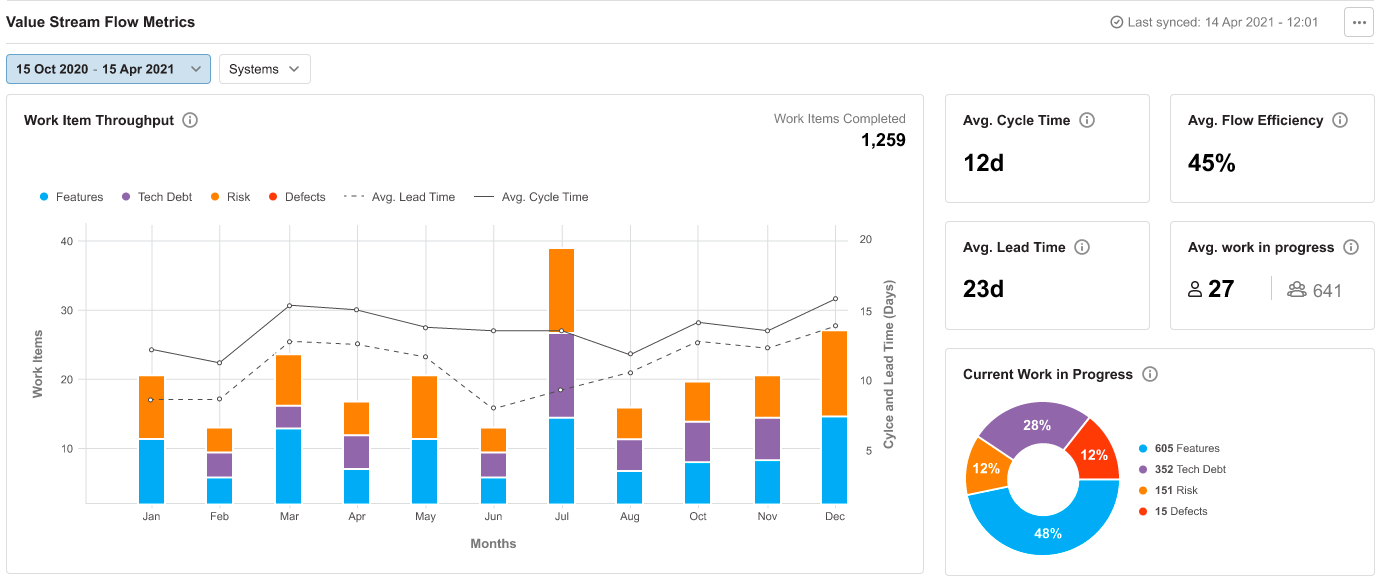
    Plutora announced today it has extended the capabilities of its value stream management (VSM) platform to include a common object data model that more efficiently normalizes data collected from multiple DevOps tools and platforms.

    Jeff Keyes, vice president of product marketing and strategy for Plutora, said the goal is to expand the level of scale and depth at which the Plutora analytics engine embedded within the Plutora Platform can analyze flow metrics.

    VSM has emerged as a distinct DevOps discipline that provides a framework for enabling organizations to optimize workflow across DevOps environments in a way that allows them to accelerate application development. The core concept traces its lineage to lean manufacturing methods that continuously measure each step of a process to improve production.

    As organizations develop a deeper appreciation for their dependency on software, the level of interest in understanding how software is constructed has increased. Organizations, for example, want to better understand the impact of missed software development deadlines on revenue, which a business might not be able to generate as quickly as anticipated.

    Plutora is making a case for a dedicated analytics platform that pulls data from multiple platforms. Alternatively, more value stream analytics capabilities are now being embedded in everything from project management software to continuous integration. Plutora contends, however, that navigating multiple value stream dashboards surfaced by different tools that make up a DevOps workflow is not as simple or effective as relying on a single platform that collects data from every tool employed.

    Metrics that track lead and cycle times for projects as well as overall throughput become much easier to surface and comprehend, noted Keyes.

    One way or another, more transparency is coming to DevOps workflows. Historically, collecting this data has been challenging because it required DevOps teams to manually collect data from each tool being used. In effect, DevOps teams were wasting time copying and pasting data from one tool into an analytics application.

    As it becomes simpler to aggregate all that data, the data model provided by Plutora makes it simpler for multiple analytics tools to analyze the same data. A business user, for example, may prefer to analyze data using the Tableau analytics platform that is now owned by Salesforce.

    In general, analytics is being applied more widely across software development processes because organizations need to increase productivity while simultaneously reducing costs. It will be up to each organization to decide to what degree they may want to use that data to better train DevOps teams versus simply using it to remind those teams to stay focused on a specific set of key performance indicators (KPIs).

    In the meantime, the number of requests for reports being made to DevOps teams should decline as the process of collecting metrics becomes more automated. The challenge now will be making sure everyone reading those reports has the same firm understanding of what’s actually possible to achieve using not only the resources at hand, but also how any additional DevOps expertise might positively impact that equation.

  • Harness Employs ML to Streamline DevOps Workflows

    Harness Employs ML to Streamline DevOps Workflows

    At the online {Unscripted} 2021 conference, Harness today announced an update to its namesake DevOps platform that includes support for feature flags that expose new capabilities to a select number of users for testing purposes along with the ability to prioritize the running of those tests based on the likelihood an application is likely to fail them.

    In addition, Harness is adding a unified pipeline capability that enables DevOps teams to streamline the management of multiple tools that make up a workflow and has updated its cloud cost management module to enable DevOps teams to automatically stop idle workloads. That capability is based on technology the company gained with its recent acquisition of Lightwing.

    Steve Burton, chief marketing officer for Harness, said Harness is now employing machine learning algorithms to identify which tests an application is most likely to fail. That test intelligence module enables DevOps teams to run those tests first versus testing an application only to discover close to the end of that effort that an application will need to be updated and then retested. The amount of time spent on testing is then sharply reduced, noted Burton.

    Overall, Harness is reducing the amount of time and effort spent maintaining DevOps pipeline and workflows, said Burton.

    The cost of maintaining a DevOps platform will naturally vary as the overall environment becomes more complex. It may not be clear how much time a DevOps team is spending on testing, but the faster that process becomes the more likely an application will be thoroughly tested before it is deployed in a production environment. Fixing applications after they are deployed in a production environment is, of course, considerably more expensive.

    At the same time, as the number of applications being built simultaneously increases, the amount of cloud resources being consumed also increases. Developers, however, don’t typically pay close attention to what workloads are consuming which cloud resources, which can result in an unpleasant surprise when the monthly bill from the cloud service provider comes due.

    In general, Burton says machine learning algorithms and other forms of artificial intelligence (AI) will soon become table stakes for any provider of a DevOps platform. The expectation is the platform will routinely employ AI to streamline processes and reduce total costs, noted Burton.

    Many of the manual tasks that DevOps teams regularly perform to maintain a DevOps platform will increasingly become automated as usage of machine learning algorithms becomes more pervasive. It’s not clear to what degree organizations may abandon a legacy DevOps platform to take advantage of those capabilities. However, over time it will become apparent that some organizations are spending a lot more time building and deploying applications than others as the next generation of DevOps platforms, infused with machine learning algorithms, are installed.

    In the meantime, DevOps teams might want to make a list of the manual tasks they perform today as part of an effort to determine how much time they are wasting that might otherwise be spent on tasks that are more valuable to the organization.

  • Using Rust to Build Distributed Applications

    Using Rust to Build Distributed Applications

    Rust is an open source programming language that was initially developed at Mozilla Research and became increasingly popular for building distributed applications. It has been referred to in the Stack Overflow Survey as “the most-loved programming language” by software developers for five consecutive years. Moreover, companies like Amazon and Microsoft have recently revealed that they are using Rust to develop the software components that are responsible for ensuring application safety.

    Rust allows the implementation of safe and predictable code by leveraging memory safety and speed. It is the ideal choice to create code without incurring undefined or unpredictable behavior thanks to its features such as consistent runtime behavior and a static type system.

    Although Rust can be used for any system programming application, it is mainly implemented to build applications like simulation and game engines, browser components and file and operating systems. Rust syntax is similar to C++, but it addresses issues that C and C++ normally struggle with such as developing code without security vulnerabilities, general memory errors and problems in writing concurrent programs.

    The Advantages of Rust in Distributed Programming

    Rust tackles the performance and reliability problems of other low-level programming languages by using a careful compiler which examines all the variables used and referenced. As the code is compiled, Rust uses monomorphization by creating exclusive and high-performance code for each type of channel. It prevents programmers from paying performance penalties due to its flexibility. Based on the principle that you don’t pay for what you don’t use, the code written in Rust is enhanced and abstractions are solved at compile time making the program safe and without runtime overhead.

    Rust doesn’t have a garbage collector, which allows programmers to build abstractions with predictable performance. In Rust, there is no garbage to collect because the moment something would have become garbage, it gets freed immediately at compile time, making the program much faster. Moreover, Rust uses a borrow checker to check where data is used across the program, and by following a set of rules it establishes where data needs to be dropped or initialized. It provides the same advantages of a garbage collector with the efficiency and predictability of manual management.

    Another crucial characteristic of Rust is its asynchronous I/O. In Rust, asynchronous programming is widely implemented and well-integrated. It enables developers to effectively scale on a certain number of cores and exploit the operating system resources. By running several units of code on each application, this feature enhances performance and responsiveness of the operating system.

    Rust prevents some of the software engineering problems that could critically damage the application development process. These issues concern concurrency and memory safety which can cause very often denial of service, code vulnerabilities or compromised secrets. Examples of these frictions that are common in other languages such as C or C++ include uninitialized variables, undefined behavior, invalid iterators and unexpected variable modification.

    Another great advantage of using Rust is the Rust developer community, an extremely friendly and welcoming community. There are multiple events, chat rooms and forums to participate in that makes it even more pleasant to build distributed applications with Rust.

    Thanks to its ability to fix concurrency and memory issues, to compile and run safe and predictable code and provide a fast implementation, Rust is quickly increasing its popularity and establishing itself as the ideal choice for building distributed applications.

  • Akamai Adds Service to Optimize API Traffic

    Akamai Adds Service to Optimize API Traffic

    Akamai today launched an API Acceleration service specifically designed to accelerate application programming interface (API) calls using special purpose hardware, reserved capacity and prioritized routing.

    At the same time, the company is also making available a globally distributed key-value store dubbed EdgeKV that enables stateful applications to be deployed on its EdgeWorker nodes.

    Finally, Akamai is also making available free tiers of services that provide access to a combined 60 million serverless EdgeWorker events per month with a limit of up to 30 million EdgeWorker events per tier. The two tiers are made up of a basic compute service for applications requiring lower CPU and memory consumption and a dynamic compute service for those applications demanding additional resources.

    Josh Johnson, an enterprise architect for Akamai, said Akamai is expanding its offering at a time when many organizations are starting to deploy microservices-based applications across an extended enterprise using serverless EdgeWorker nodes deployed at the network edge. EdgeKV provides access to a low latency data store that also enables those edge computing applications to process data closer to the point where it is being created and consumed.

    In general, Akamai reported that, in 2020, its platforms processed more than 300 trillion API requests, a 53% year-over-year increase. Much of the increased activity is being driven by distributed applications that are deployed directly on the Akamai CDN, rather than being deployed in a local data center to take advantage of a global network of data centers that allow IT organizations to take advantage of caching. In effect, the CDN becomes the target platform when an application developed using DevOps best practices is being deployed. The rise of edge computing has increased the number of use cases where DevOps teams are relying on CDNs to deploy applications.

    Naturally, competition among providers of CDNs has increased considerably as the number of applications deployed at the edge continues to increase. There may even come a day when there are more applications deployed at the network edge than there are in the cloud as more organization deploy applications that need to process and analyze data in near-real time as part of a larger digital business transformation initiative.

    Akamai, of course, as the provider of the largest global CDN, is betting it will be able to leverage the size of its CDN to convince developers to deploy applications on its platforms rather than smaller rivals.

    Regardless of the approach to edge computing, the applications being deployed will be more latency sensitive than ever. Each IT organization will need to decide to what degree they want to count on infrastructure to optimize API calls those applications make before they time out or need to be redirected to another microservice. One way or another, the laws of physics still apply. No edge computing application is an island. It depends on a complex web of infrastructure ranging from routers and switches to servers running back end services in the cloud. The challenge is finding a way to optimize all those interactions in a way that developers never have to be concerned about.

  • Observe Seeks to Put More IT Metrics in Context

    Observe Seeks to Put More IT Metrics in Context

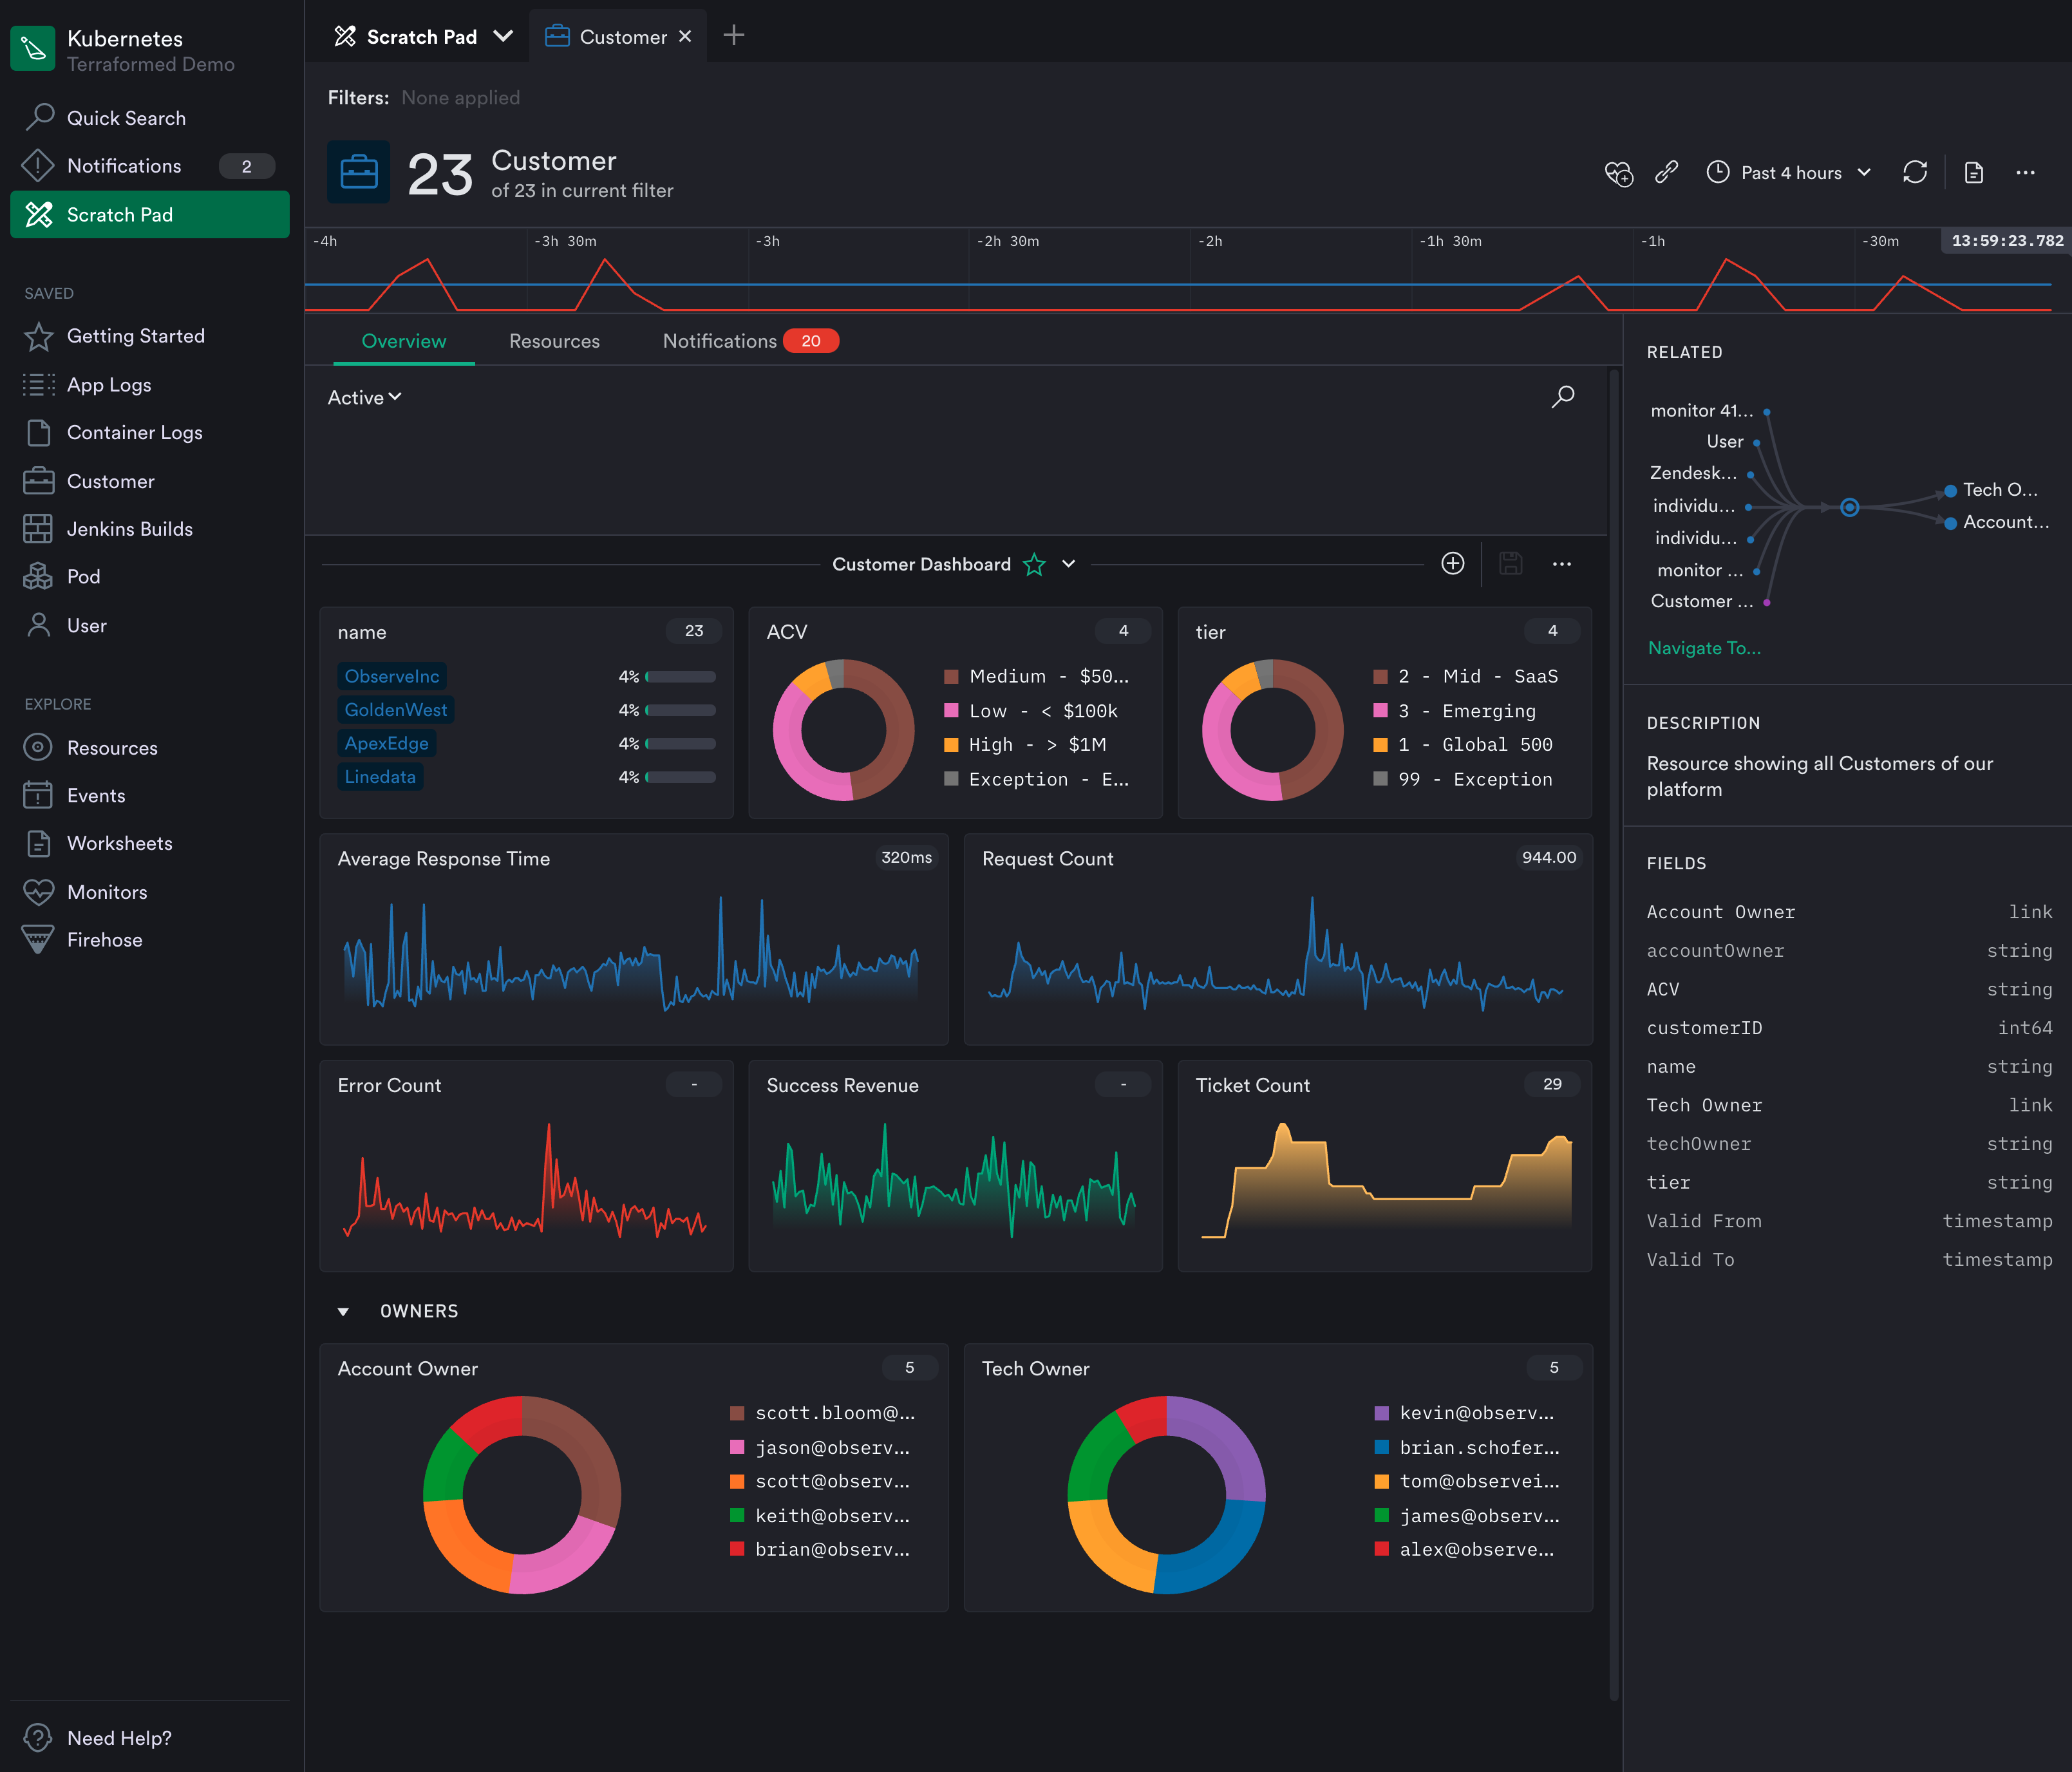
    Observe, Inc. announced today it has updated it observability platform to add support for metrics based on time series data. In addition, the company is revamping how the platform generates alerts as part of an effort to surface more actionable intelligence.

    Jeremy Burton, Observe CEO, said rival observability platforms require IT teams to sift through hundreds of metrics that are generated using elaborate tagging schemes that ultimately drive up the cost of storage. The Observe platform curates metrics by associating them with, for example, a customer, to provide more relevant context, Burton noted.

    That approach eliminates the need to present IT teams with overwhelming lists of metrics in addition to reducing storage costs by removing the need for a complex tagging scheme, added Burton.

    The latest update leverages that approach to metrics to only generate alerts based on curated metrics attached to customers, pods, shopping carts or containers. Rather than simply being alerted to a drop in response times, for example, the IT team can also easily see which customers or pods might be affected. That shift will reduce the volume of alerts that are already overflowing in email inboxes and across other communications platforms.

    Fresh from raising an additional $7 million, Observe today also revealed it has added 20 paying customers since launching the platform on top of the Snowflake cloud service residing on the Amazon Web Services (AWS) public cloud. Rather than reinventing the same core infrastructure, Observe is leveraging a data analytics engine that is already widely employed in IT environments.

    For now, Observe will continue to primarily focus on metrics as part of an effort to deliver insights in a form IT operations teams are prepared to consume today, said Burton. Over time, however, Observe will add support for distributed traces via tools such as OpenTelemetry and Jaeger as it adds additional application performance management (APM) capabilities, added Burton. Rather than telling IT operations teams they are managing IT in the wrong way, the goal is to meet IT operations teams where they are today, noted Burton.

    That strategy also enables the Observe platform to be employed to manage both monolithic and microservices-based applications running on Kubernetes clusters, noted Burton. The immediate goal is to provide IT teams with an alternative to legacy monitoring tools that provide more context at total lower cost by allowing IT organizations to rationalize tools that don’t tend to be especially well integrated, added Burton.

    In the longer term, Observe will also employ machine learning algorithms to collect data more efficiently. However, Burton said the company remains skeptical of visions of an IT future that depend on machine learning algorithms to continuously learn IT environments that are not only unique, but subject to frequent changes.

    Competition among observability platform providers is already fierce. Each IT team will need to decide what type of platform makes the most sense for them based on costs and their preference for specific capabilities one vendor might have that another doesn’t provide. One way or another, however, the way IT environments are managed will soon be changing for the better.

  • Grafana Labs Advances Open Source Visualization and Observability

    Grafana Labs Advances Open Source Visualization and Observability

    During the online GrafanaCONline conference today, Grafana Labs announced that version 8.0 of its open source visualization software widely employed by DevOps teams is now generally available. In addition, version 1.0 of Grafana Tempo, an open source back end platform for collecting distributed traces that are needed to drive observability across an application environment, is also generally available.

    At the same time, Grafana Labs revealed that Grafana Tempo is now available as a service on Grafana Cloud.

    Version 8.0 of Grafana adds support for additional types of visualizations such as streaming panels, state timeline, status history, bar chart and histograms in addition to a revamped unified alerting system that enables DevOps teams to view and edit alerts generated by Grafana and open source Prometheus monitoring platform via a common user interface. The notification system adopted to achieve that goal is based on a Prometheus alert manager that provides capabilities such as grouping, deduping and silencing of notifications alongside advanced message templates.

    The latest release of Grafana also improves startup and graph rendering performance, thanks to a major reduction in initial download size and graph rendering time.

    The enterprise edition of Grafana has also been updated to provide support for fine-grained access controls, improves caching of back end data sources and improved reporting capabilities such as live dashboard links that can be embedded in email.

    Overall, Grafana Labs claims there are now more than 750,000 active installations of Grafana that organizations are employing to create visualizations that correlate data collected from multiple back end sources.

    In addition to contributing to Grafana and Grafana Tempo, the company is running a cloud service that makes multiple instances of Prometheus running on different clusters accessible from a central console.

    Torkel Ödegaard, creator of the Grafana project and chief Grafana officer for Grafana Labs, said Grafana Tempo promises to further advance observability thanks mainly to its ability to employ object storage to capture complete distributed traces. Rather than only sampling traces, it’s now feasible to trace every request. Grafana Tempo is also compatible with any open source tracing protocol, such as Jaeger, Zipkin and OpenTelemetry, and can be integrated with metrics, logs and dashboards via a managed Grafana Cloud service.

    It’s not quite clear how quickly organizations are embracing distributed traces to improve application observability or, for that matter, to what degree traces might eliminate the need for certain types of metrics or log analytics. The one thing that is certain is DevOps teams require more context than ever to proactively manage complex IT environments. Distributed traces make it simpler to track interactions between application services. The challenge is they can require IT teams to store a lot more data.

    In time, of course, distributed tracing will become more commonly employed as developers more routinely instrument applications based on microservices that tend to have lots of dependencies that are difficult to discover in the absence of some type of distributed tracing capability. Of course, distributed tracing has been around, in some form or another, in application performance management (APM) platforms for some time. The difference now is that, as open source software, it’s becoming more affordable to implement.

  • Digital Customer Experiences: The Future is Modular

    Digital Customer Experiences: The Future is Modular

    With the proliferation of microservices and APIs, will UIs go modular too? Some technologists note a rising trend around smaller, intent-based customer experiences that more directly mirror API endpoints.

    I recently met with Adam Evans, co-founder and CTO of Airkit, to better understand what’s broken with today’s digital customer journeys and how they need to evolve. He predicted that single-purpose experiences will become more pervasive in the future. In the process, we’ll likely encounter fewer native apps and fewer downloads. To enable all this, he’s putting faith in low-code to bring easier integration and automation patterns to more developers.

    The State of Digital Experiences

    Digital customer experiences are becoming increasingly connected and web-based, and at times, disconnected from the core service. In headless environments, end users are engaging with companies through more and more abstraction layers, such as chat, SMS, voice or email notifications. These interactions are increasingly modular and event-driven, noted Evans.

    Increasingly, user encounters are the result of trigger-based patterns activated when user action is required. Not only is the communication style changing, but new devices and platforms have emerged, further making a case for a decoupled development approach. B2C apps become more modular in this transition, presenting experiences built around specific tasks and closely reflecting the specialized microservices or APIs that drive them. Consider the rise of the single page application (SPA) style or AWS Lambda as evidence.

    As more automation and subscription models enable a “set and forget” attitude to commercial software, Evans predicted we’ll likely see more intent- and event-driven workflows emerge. He said these reimagined UIs would shroud platform complexity and, instead, focus on single, specialized actions, like submitting an insurance claim, checking the status of a package or updating your coffee subscription.

    A Broken Customer Journey

    So why would end user digital experiences evolve into more intent-driven applications? Well, complex digital platforms can get feature-bloated very quickly. Bulky applications with many menus are difficult to navigate, thus impacting user experience.

    As Evans describes, generic interfaces often display tons of information irrelevant to the task at hand. “Don’t make me go through generic interfaces to help me do something specific,” he said.

    Clunky interfaces are at odds with small digital tasks that involve an attention span of 20 seconds or less. Evans describes these as “micro touchpoints in our daily lives where you don’t need traditional, large applications.” These actions could be, for instance, looking up COVID-19 infection rates, checking your credit card balance or updating a streaming subscription, he said.

    Organizations have other imperatives to improve user experience, too. For example, if a platform isn’t self-service, it can increase support calls, which can cost a company significant resources. Plus, if the service isn’t event-driven, users must routinely check in of their own accord, which could waste time and encourage tech anxiety.

    Single Page Applications

    In the age of modular microservices, the days of bulky apps and “manual polling” may be limited. To Evans, the solution lies in expressing the “minimum way to represent the transaction of that interface.”

    “How do we keep moving smaller divisions from the back end to the way interfaces are built?” Evans asked. Similar to the way microservices architecture separates domains, Evans noticed UIs segmenting attention along API endpoints. He envisioned more single-purpose experiences being constructed that extend APIs and microservices with a user interface.

    Technically, this may result in more single page applications being developed. Niche UI layers that map APIs would likely carry a data model, Evans described, so that micro apps are delivered with data for entering fields into API calls. As they are web-based, asynchronous single-purpose experiences could also transcend the barriers of app stores and third-party marketplaces.

    Potential Benefits of Modularity

    More intent-based workflows mean less overhead for the user, bringing quicker, more convenient access to the problems they want solved. Sure, users still register with a core service, such as their bank, coffee subscription service or insurance agency for centralized account management. But, users frequent account centers less often, as the periphery of interactions around them continues to grow.

    “The future of apps will look more like individual, intent-based micro apps,” Evans reiterated. These would reflect a metronome of touchpoints Evans called “little moments of delight.”

    Pinging users only when action is required could reduce check-ins, thus reducing digital anxiety. Aside from the user benefits, deployment and maintenance for small applications may be easier to support, said Evans. Lastly, more isolated intentional customer experiences increase engagement, response rates and sales, he added.

    Using Low-Code For Customer Experiences

    Connected digital experiences are relying more and more on APIs. Yet, API integration can be difficult, even for experienced programmers. So, how do we make it easier for people to build interfaces to hit these APIs? Building user-facing layers on top of APIs will require great developer experience, says Evans.

    Lately, low-code has been dominating these discussions. With greater emphasis on visual-driven development, low-code is empowering non-technical employees. To Evans, low-code capabilities will be essential to influence how future customer journeys are constructed.

    Evans noted how low-code “changes the whole game around how apps are built.” For example, branded experiences often require reusable code and common libraries, all of which low-code platforms excel at. In addition, when working with APIs, a “layer over REST design is essential to maintain state and enable long-term processing,” he said.

    Will The New Digital Journey Go Micro?

    Complex interfaces seem to work for conglomerate giants like Amazon. But other scenarios may benefit from more single-purpose workflows. As platforms become more extensive, the user interactions need to become leaner to avoid added stress. As a result, Evans predicts that micro, trigger-based B2C touchpoints will become more common in the coming years. In this paradigm, better UI extensions of common APIs could help bring people into the equation.

    “We’ll see a lot of cool stuff in the next decade,” he said. “Future apps won’t look like what past ones looked like.” As IT moves to support new, multiple channels, such as chat, voice, web and VR/AR, our perception of what an application is also will inevitably alter.

    In tomorrow’s “great unbundling of apps,” as Evans called it, “if you don’t use it every day, there’s a pretty good chance it doesn’t need to be there.”

    There are many schools of thought on the best methods to retain quality user experiences. Do you think modularity is the answer? What do you think tomorrow’s digital experiences will look like? Feel free to let us know in the comments below.

  • Cribl Automates Observability Efforts

    Cribl Automates Observability Efforts

    Cribl today announced it has updated the Cribl LogStream observability tool in addition to generally making available a software-as-a-service (SaaS) offering dubbed LogStream Cloud.

    Nick Heudecker, senior director for market strategy and competitive intelligence at Cribl, said Cribl LogStream provides the means to aggregate log data collected from multiple platforms and applications in a format any observability or monitoring tool can access.

    The challenge with observability platforms today is they leave it up to IT organization to copy and paste data into the platform. LogStream automates that process via a log router that collects and optimizes data streams from existing installed agent software and then shapes and routes that data on to analytics platform.

    Version 3.0 adds LogStream Packs, a framework for accelerating deployments of the log router. Alternatively, DevOps teams can employ LogStream Cloud to build and share LogStream configuration models.

    Heudecker said the goal is to reduce the cost of achieving observability by reducing the time and effort required to set up and manage data pipelines. No customization effort on the part of a DevOps team is required to collect and send data from hundreds of sources to any number of destinations, noted Heudecker.

    While observability is a core DevOps tenet, achieving it has been a major challenge. In addition to deploying and managing agent software to instrument IT environments, there’s a significant amount of time and data engineering effort needed to set up the pipelines employed to transfer data to a platform where it can be analyzed. Cribl is making a case for automating those data engineering tasks using a tier of software that abstracts data into a format that can be consumed by multiple observability and monitoring platforms.

    It’s not clear yet to what degree IT organizations perceive observability to be an evolution of monitoring, or simply the next logical evolution of monitoring. One way or another, IT teams need a lot more context than they have historically been able to attain using legacy monitoring tools. Each platform employed within an enterprise typically comes with its own monitoring tools that are used by the IT teams tasked with managing it. Whenever there is an issue, however, IT teams will spend hours correlating data from multiple tools to ascertain the root cause of a problem.

    Observability platforms promise to reduce that time and effort by applying analytics to data collected from multiple platforms. The challenge now is finding a way to efficiently collect all that data.

    It may be a while before IT organizations start to abandon all the monitoring tools they have in place in favor of observability platforms. However, as IT environments continue to become more complex (thanks, in part, to the rise of cloud-native computing platform based on microservices) the need for those platforms becomes more acute. The issue is enabling DevOps teams to achieve that goal without having to wait for an overworked data engineer to find the time to build a pipeline.