Category: DevOps Practice

  • Database Migration From Microsoft Azure to Snowflake on AWS: Part 2

    Database Migration From Microsoft Azure to Snowflake on AWS: Part 2

    In part one of this blog series, we looked at our approach to migration by leveraging the Azure data factory, tuning the performance of Data Factory Pipeline, using Parquet files and increasing computing power. 

    In this blog, we’ll look at some of the challenges encountered during the migration, cost-saving actions and our approach to data validation.

    Challenges Encountered 

    • Data Factory export failed for tables if the column name had spaces or special characters. In such cases, aliases were used (replacing spaces with an underscore) for column names and the query method was used as a source.
    • Data Factory export failed for the column data type “Geography” and had to be cast to varchar and then exported to Blob.
    • Some column names in SQL server were keywords in Snowflake, which didn’t allow it to migrate. For example, ‘LOCALTIME’ is a column name in SQL but is also a keyword in Snowflake, and it is addressed using inverted commas as escape characters (“”) while creating the Snowflake table.
    • During ingestion into Snowflake, the flat files were named after tables, listing files based on the name pattern. For example, if we wanted to list the file with table name test_1, Snowflake would list all the files starting with the name test_1. It is essential to make sure that each file name is unique.
    • If the file to be ingested was incorrect with respect to the table, Snowflake did not return any error messages or warnings. It simply ingested the file and put NULL wherever column mapping was not found.
    • While creating the tables, if the column name had spaces, escape characters were used so that the same spaces could be maintained. But for ingestion of such columns, the column mapping from a flat file would be the same aliases that were used in the source query.
    • Triggers and compute columns were not supported in Snowflake and had to be eliminated while creating the tables.
    • Also, data types that did not exist in the Snowflake schema had to be changed, keeping in mind the correctness of data.

    Cost-Saving Actions

    • Use of the Parquet file facilitated a compression rate of up to 75%. The 800GB of data was compressed to 234GB in multiple files which reduced the storage cost of Blobs.
    • Detailed POC and analysis discovered that Snowflake ingestion was optimal with Small for moderate sized tables and Medium for large sized tables which kept Snowflake costs in check.
    • Self-hosted IR saved on the data pipeline operating cost as the compute power of Azure VM was used.

    Cost Estimation 


    Data Validation

    The vital part of the project was ensuring that the integrity and correctness of the data were maintained during the migration process. As a part of standard DataOps best practices, a thorough data validation activity was performed to make sure that the data stayed meaningful and remained of use to drive business decisions.

    The approach to data validation was two-fold:

    In the first approach, all the distinct data types in the SQL server that were part of the db migration were listed and sampled randomly across one row per data type. The same row was fetched from Snowflake and matched.
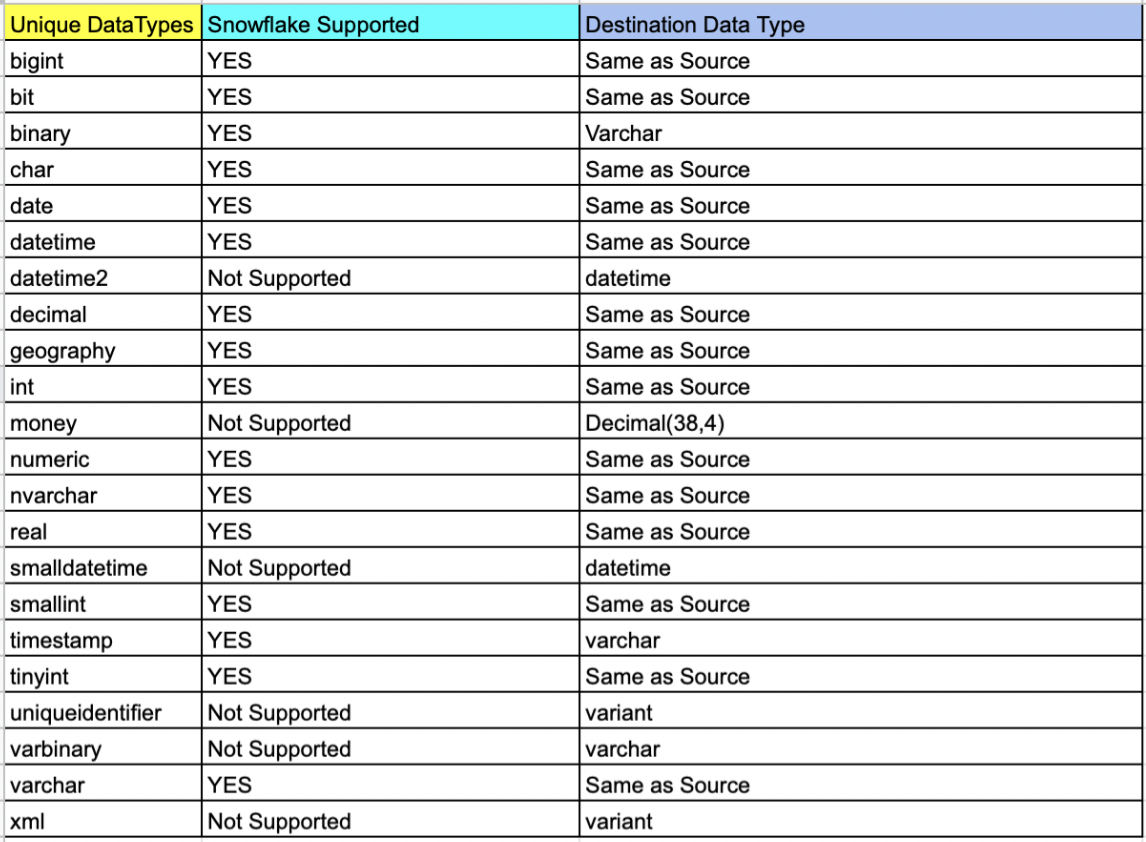
    List of tables based on data type

    select table_catalog,table_schema,table_name,COLUMN_NAME,* from
    INFORMATION_SCHEMA.COLUMNS
    where DATA_TYPE = 'money' and TABLE_NAME not like 'sys%'

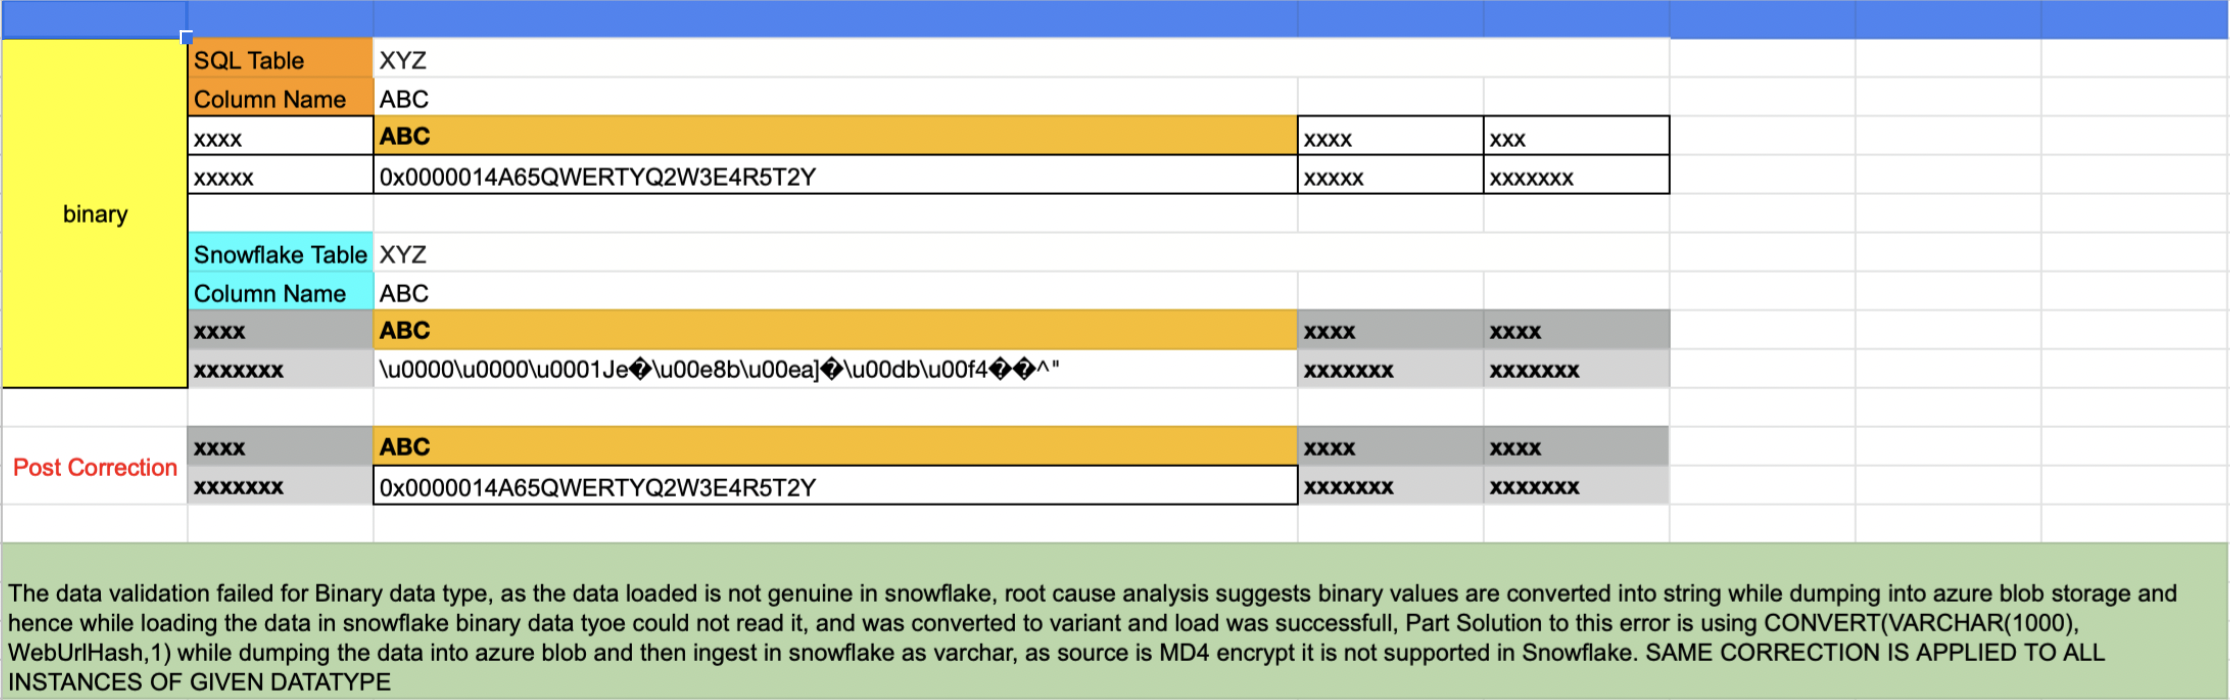
    Issues like that shown below were uncovered in this validation process and were corrected for all instances of the data type.
    The second approach involved writing an automated script that accomplished the following results (More details can be found here):

    • Script touched each table of each database
    • A set of five records were randomly sampled from both sides and matched
    • If the tables were empty, it was recorded as tables with zero records
    • If the sample sets did not match the script, it wrangled the sets and sorted them one column at a time. If the sample matched the script, it was recorded. This wrangle took care of the scenario wherein the first n number of columns had duplicate records
    • Any failed validation attempt would be visible in a generated log report:

    Validation Started for Table: Test1

    —-> Validation Passed for table Test1

    Validation Started for Table: Test2

    —-> Validation Passed for table Test2

    Validation Started for Table: Test3

    —-> Table has 0 records

    Validation Started for Table: Test4

    —-> Validation Failed for table Test4

    Validation Started for Table: Test5

    —-> Validation Passed for table Test5

    ============= Report =============

    # Total Number of Tables Scanned: 5

    # Tables with 0 records: 1

    # Passed: 3

    # Failed: 1

    # Percentage 60.5556123

  • Applause Report Surfaces Functional Testing Issues

    Applause Report Surfaces Functional Testing Issues

    An analysis of more than 340,000 bugs collected by Applause, a provider of a testing platform designed to integrate with a range of DevOps platforms, found functional bugs accounted for 68% of issues. The research gathered data from 13,000 mobile devices and 1,000 unique desktops running 500 versions of operating systems and found that the majority of issues could be traced to functional bugs compared to visual (17%), content (9%), crashes (4%) and lags and latency (2%) issues that, collectively, only add up to 32%, the report found.

    The report also found screen readers comprised 66% of all accessibility bugs compared to keyboard navigation issues and insufficient color contrast which accounted for only 12%. In terms of localization, poor and missing translations account for more than two-thirds (67%) of bugs, the report found. Based on ongoing feedback data that Applause also continuously collects from customers, nearly half of organizations (47%) identified currency and number formatting as the most valuable bugs to identify when it came to localization.

    Overall, organizations ranked the discovery of crashes (75%), functional bugs (61%) and lag and latency issues (53%) as exceptionally valuable, according to Applause.

    Luke Damien, chief growth officer for Applause, said when it comes to testing, in general, there is still not enough focus on user and customer journeys. That lack of focus is becoming a larger issue as more organizations invest in digital business transformation initiatives that are driven largely by mobile applications, he noted. Payments are especially problematic because they often rely on application programming interfaces (APIs) exposed by a third party in a way that results in suboptimal application experiences that have a direct impact on revenues, he added.

    The challenge is that it’s not entirely clear how far left responsibility for application testing is shifting. In some cases, developers are assuming responsibility. In other cases, a dedicated testing team is still responsible. Developers, of course, will test applications as they build them but application experiences on a local machine may not always be replicated in a production environment. The issue is that most end users today are not especially forgiving when a mobile application fails to meet expectations. Months of development effort can be wasted simply because a function was not tested in a production environment.

    Less clear is to what degree testing will be automated in the future. Machine learning algorithms are making it possible to automate testing of both functions and user interfaces. It’s not likely the need for humans to be involved in testing will be eliminated any time soon, but many of the routine tedious tasks that conspire to limit the rate at which applications can be tested should be sharply reduced in the months and years ahead.

    In the meantime, an organization’s entire brand reputation is now tied to the quality of the application experience it enables on a mobile device. Revenue targets can now be easily missed if users of a mobile device choose one application over another simply because a function was broken—even for a short amount of time. As such, testing has never been more critical given organizations’ dependency on software.

  • Shedding Light On Toil: Ways Engineers Can Reduce Toil

    Shedding Light On Toil: Ways Engineers Can Reduce Toil

    It comes in many shapes and sizes and is embraced as a necessary evil. It lurks in the shadows, emerging now and again to stealthily creep into our workflows, where it feasts on our perceived shame. If not pruned, it grows and wraps its tendrils around the workforce, draining the energy out of every digital worker across departments. We all have it and most of us believe we suffer alone.

    I’m talking, of course, about toil.

    Dramatics aside, toil is common throughout most programming and DevOps positions, whether we like it or not. And when it comes to platform engineering, the chances of encountering toil is high. You can think of toil as those tedious workarounds that should be automated but aren’t. This could be due to a lack of standard configurations for deployments. Or, perhaps engineers must copy and paste data from one module to the other—an integration that has not yet been automated.

    One of the hallmarks of the SRE role is to spot and reduce such toil—hopefully before it gets out of hand. But, what exactly is toil? And, how can SREs reduce it?

    I recently met with Jake Englund, senior site reliability engineer, Blameless, and Matt Davis, intuition engineer, Blameless, to uncover some tips on spotting and eliminating toil in the daily life of an SRE. Below, we’ll attempt to define toil and explore some techniques to defeat this ghoulish foe.

    First, What is Toil?

    Toil is tedious. Englund defines toil as repetitive manual tasks that are, ideally, automatable. “It’s not gratifying work; it lacks enduring value.” James Curtis similarly described toil as “tedious actions that really have no enduring value.” Toil is similar to technical debt in that, if left unchecked, it can hinder productivity and contribute to burnout.

    Toil is invisible. Toil is the invisible work that goes on behind the scenes, says Davis. For example, at your team meeting or stand-up you might say something like, “I’m deploying this fix.” There’s usually no need to explain the nitty-gritty details of your exact step-by-step process, as it would be too far in the weeds. As a result, manual and repetitive tasks are often not given the spotlight.

    Toil is persistent. Toil might be readily apparent, but it’s not as simple to eliminate; attempts at fixing toil could potentially create new toil. Tedious tasks may also be essential to keeping core infrastructure pieces up-to-date. According to Englund, what often ends up happening is that only the specific engineer knows the niche mechanics of what they’re maintaining, making them irreplaceable—a power that some employees might abuse. “If you’re the only one who knows how to do something and you’re hoarding that information, it leads to inertia against resolving toil,” said Englund.

    Toil is pervasive. Toil is not limited to SRE or engineering. From UX to management or marketing, within most positions, you’ll encounter a degree of toil. This is because the ‘work as prescribed; is often much different than ‘work as done’, said Davis.

    Four Tips To Reduce Toil

    So, what can organizations do to conquer the nightmarish reality that is toil? Especially those that don’t have a dedicated engineering team to reduce drudgery?

    1. Find It!

    To reduce toil, you first have to find it. Sounds simple enough, right? Well, discovering toil might not be as obvious as it sounds. “You get into these toil situations where you might not even know you’re in it. How do you know that toil is encompassing what you’re doing?” asked Davis.

    To find toil, the Blameless team has a weekly session open to the whole company to examine ‘work as done.’ According to Davis, this has been very beneficial for discovering where toil occurs. It also helps garner perspectives from roles throughout the entire company.

    2. Standardize and Automate

    Next, a proven method to reduce toil is standardizing your engineering processes. Standardization, said Davis, is “another word for removing ambiguity.” For example, SREs can benefit from having a common series of steps to follow when responding to alerts. Runbooks that aggregate data to respond to issues can reduce toil in the data collection process while also helping improve mean-time-to-discovery and recovery rates.

    Standardizing change management is another way to reduce toil. If engineers are approaching change management in various ways, this could cause additional review and slow down the release process. Removing ambiguity from the change lifecycle can alleviate toil down the line.

    When you find yourself having to retain mental models for configurations, it’s a good sign that standardization is required, explained Englund. For example, perhaps some configurations are needed in some environments but are commented out in others. Documenting the specific configurations for different development environments (and automatically populating configurations) is one way to reduce toil and the chance for human error.

    3. Proactively Monitor

    More proactive monitoring is another way to reduce toil, according to Englund and Davis. “Responding to a crash loop is responding too late,” added Davis. Instead, he advocated that SREs look toward leading indicators that suggest the potential for failure so that teams can make adjustments well before anything drastic occurs.

    If SLIs like error rate and latency are getting bad, you must take reactive measures to fix them, causing more toil. Instead, proactive monitoring is best to see the cresting wave before the flood. Leading indicators could arise from following things like data queue operations connected to servers or the saturation of a particular resource. “If you can figure out when you’re about to fail, you can be prepared to adapt,” said Davis.

    4. Practice How to Improvise

    One major caveat of standardization is that you’re inevitably going to encounter edge cases that require flexibility. And when an outage or issue does arise, the remediation process is often very unique from case to case. As a result, not all investment into standardization pays out.

    Alternatively, teams that know how to improvise together are proven to be better equipped for unforeseen incidents—one study on Arctic Sea emergencies found collective improvisation to be imperative for emergency response situations. Similarly, collaboration is vital for software teams. Davis calls this the “practice of practice.” If you don’t practice backup restores, for example, teams may flounder in the case of a database outage. Yet, since every remediation effort is unique, it really boils down to learning how to collaborate effectively as a team. “We can gain a lot from getting together to practice,” added Davis.

    All the Small Things

    Toil is like manually typing an email signature every time you are about to hit “Send.” Maybe you’ve just been putting off configuring your signature in your email client. Or, perhaps you like to write a custom sign-off for each recipient. Regardless of the reason, the longer this repetitive motion is required, it’s a stick in the spokes of productivity.

    In the grand scope of things, this tedium can be a drain on time and resources. For every extra keystroke or click, every un-automated workflow or every copied-and-pasted code block, a small degree of toil is piled onto the daily workload of an engineer, dragging them away from focusing on what really matters.

    Standardization, automation, proactive monitoring and collaboration are all helpful elements to consider on your journey toward reducing toil. But of course, there is the trap of increased software development automation—the time saved building automation must outweigh the upfront development cost (and ongoing maintenance effort). Otherwise, you might end up creating even more toil.

  • BMC Integrates DevOps Mainframe Portfolio With Git

    BMC Integrates DevOps Mainframe Portfolio With Git

    BMC has expanded its efforts to bring DevOps best practices to the development of mainframe applications by integrating the BMC Compuware ISPW continuous integration/continuous delivery (CI/CD) platform with Git repositories.

    In addition, the company tightened integration between BMC Compuware ISPW and BMC AMI Ops platform and integrated BMC Compuware Topaz Workbench for building applications with code scanning tools from Vercacode.

    Finally, there is also now a BMC Enterprise Connector for Illumio that provides a bi-directional interface between the zero-trust segmentation platform from Illumio and the mainframe. In addition, the BMC AMI Command Center for Security system can now also surface malicious performance activity to accelerate incident response.

    John McKenny, senior vice president and general manager for intelligent Z optimization and transformation at BMC, said the overall goal is to make the mainframe just another platform where IT teams can apply DevOps best practices to build applications faster. That’s more critical than ever because mainframes are often at the core of digital business transformation initiatives and require integration with a wide range of distributed computing platforms. A recent survey published by BMC found two-thirds of respondents (66%) are investing in new technologies such as AIOps and artificial intelligence/machine learning (AI/ML), DevOps and integrations.

    That approach enables organizations to leverage existing mainframes in a way that minimizes technical debt rather than duplicating functionality, added McKenny.

    When it comes to DevOps in mainframe environments, the biggest challenge these days has more to do with culture than the maturity of the tools being provided, he said. Many of the IT teams building mainframe applications still rely on waterfall processes mainly because of simple inertia and a general fear of change, McKenny noted.

    There is, however, a new generation of IT professionals that have embraced modern development practices across all platforms to accelerate the rate at which applications are built and deployed, said McKenny. That shift is leading to the wider adoption of DevOps best practices within both mainframe and distributed computing environments, he added. In fact, as a result, enterprise IT has never been more hybrid, he noted.

    IBM continues to invest in mainframes, so the platform should remain relevant well through this decade and into the next. Though it’s been nearly 60 years since the venerable platform was introduced, it continues to host mission-critical applications for a broad range of enterprise IT organizations. Most recently, IBM added an IBM z16 edition of the mainframe that adds a dedicated on-chip AI accelerator in addition to quantum-safe cryptography. It’s not clear how quickly organizations that have mainframes will upgrade, but that level of investment suggests IBM is still investing heavily in mainframe research and development.

    Regardless of how—or even who—builds applications for the mainframe, tools such as Git repositories will be more widely used if for no other reason than to more easily share code. Now, the issue is improving the overall level of DevOps maturity within mainframe environments to keep up with the rapid pace at which applications are being built and updated across the rest of the enterprise.

  • GitLab Adds Fourth DORA Metric API to CI/CD Platform

    GitLab Adds Fourth DORA Metric API to CI/CD Platform

    The latest update to GitLab’s namesake continuous integration/continuous delivery (CI/CD) platform has added support for the application programming interface (API) for measuring change failure rates. This addition supports the fourth metric as defined in the DevOps Research and Assessment (DORA) framework.

    Version 14.10 of GitLab also expands the GitLab Runner Operator for Kubernetes to any distribution of the open source platform in addition to making it possible to manually trigger incident responses when needed.

    Finally, a compliance report that surfaces every individual merge request violation has been added along with a tool for setting up streaming audit events.

    Brendan O’Leary, staff developer evangelist for GitLab, said that as DevOps processes continue to mature, DORA metrics make it simple for IT leaders to measure overall progress. While it’s not likely that any single set of DevOps practices will be universally implemented across an entire enterprise, O’Leary noted it’s important for DevOps teams to keep track of key performance indicators (KPIs) that enable teams to identify areas for ongoing improvement. For example, it’s not uncommon for technical debt to accumulate in the absence of metrics that track the progress of builds, he added.

    In general, a transition to microservices-based applications is increasing the need for CI/CD platforms that make it simpler to build them. Each of these applications is constructed using microservices that are typically built independently of one another. The challenge is that each microservice has dependencies on other microservices, so the need for DevOps workflows to optimally manage that development process is becoming more widespread, noted O’Leary.

    In some cases, organizations are deploying a CI/CD platform for the first time to build these applications. In other cases, they are looking to replace a CI/CD platform that was adopted to build legacy monolithic applications. Regardless of the type of application, there is a need to continuously refine and improve software engineering practices to increase developer productivity.

    It’s not clear to what degree developers are voting with their feet to work for one organization versus another based on the overall quality of developer experience. Organizations that do have a consistent approach to software engineering, however, make it easier for developers to spend more time writing code rather than managing the build process. The challenge is to make sure the DevOps platform itself does not become a bottleneck that hinders the rate at which developers can build code. It’s also not clear whether organizations are building applications faster than they can secure it and ensure overall quality. The only way to know for sure is, of course, to track metrics.

    Naturally, not every developer is a fan of metrics. Application development is still as much art as it is science. There is, however, a general appreciation that the amount of code that needs to be written far exceeds the available talent to write it; any effort to make software engineering more efficient benefits everyone involved. As such, given all the code that needs to be written, a software engineer is often today the best friend a developer can have.

  • Hasura Adds Join Capability to GraphQL Engine

    Hasura Adds Join Capability to GraphQL Engine

    Hasura today announced it has extended its GraphQL engine to make it possible to join data generated by multiple sources.

    Hasura CEO Tanmai Gopal said GraphQL Joins makes it possible to join data from across different GraphQL services that can then be accessed via a single GraphQL application programming interface (API). The extension of the federation capabilities enabled by the Hasura GraphQL engine eliminates the need for custom code that would otherwise be required to join that data, he added.

    The Hasura engine automatically generates a GraphQL schema from a data source that can then be used to accelerate the development of APIs. GraphQL Joins extends that federation capability to now include multiple GraphQL and, eventually, other data sources accessed via, for example, legacy REST APIs, said Gopal. That capability will make it easier for a wider range of developers to build applications that aggregate data across multiple sources, he added.

    The core Hasura Engine is based on open source software that the company claims has now been downloaded more than 500 million times. Hasura makes available a cloud service based on that core engine. That approach eliminates the backend complexity that IT teams encounter when adding GraphQL APIs to an application environment that already has a range of APIs that internal IT teams need to support, noted Gopal.

    GraphQL was originally created by Facebook, and it’s still not clear to what degree GraphQL APIs will supplant REST APIs. Developers tend to prefer GraphQL APIs because they provide more granular control over what data is accessed. The challenge is the number of backend services that expose GraphQL APIs is still comparatively limited. Most IT teams will not be replacing REST APIs with GraphQL-based APIs overnight, but the percentage of new applications that rely on GraphQL APIs will steadily increase. DevOps teams looking for easier ways to provide developers with access to backend services via a GraphQL API can employ the Hasura Engine to automate that process.

    Overall, the number of APIs employed within IT environments is rapidly expanding as more microservices-based applications are deployed. Each microservice generates its own API. Over time, IT teams will find themselves managing a range of types of APIs to support multiple digital business transformation initiatives that an organization may have simultaneously launched. In addition to building APIs, many of those organizations are now consuming data via APIs exposed by another organization. Over time, the level of interdependency between APIs and applications will serve to make application environments much more complex. The good news is that APIs make it easier to upgrade—and even replace—backend services without disrupting application services.

    It’s not always clear, though, who within IT organizations will manage those APIs. They are often created by developers that then look to IT operations teams to maintain them. Before too long, it’s not uncommon for IT teams to find themselves managing hundreds, perhaps thousands, of REST and web services APIs—and soon, that may include many built using GraphQL.

  • SRE Vs. DevOps: The Wrong Question?

    SRE Vs. DevOps: The Wrong Question?

    The age-old question about the competition between DevOps and SRE sets up a false dichotomy. DevOps is a methodology while SRE is a team within operations. Although the two are often pitted against one another, developers also embody the skills and the capabilities to implement fixes. 

    Traditionally, application changes were reactive. The process of SRE formalizes problem resolution playbooks for better efficiency within the development life cycle. This has changed substantially over the past few years with DevOps seeing more traction and mainstream adoption.

    So what is the modern relationship between DevOps and SRE and how can they best be used together? Let’s understand DevOps first.

    Defining DevOps 

    According to Chef’s Embrace DevOps guide, DevOps is about transforming the way companies run; part of that transformation is understanding that companies should focus on managing people rather than products. DevOps evolved over the last decade and was originally born into the world of software. The adoption of cloud technologies, changes in the tech stack architecture, SaaS platforms, and security regulations have all impacted DevOps culture

    Some of the fundamentals of modern DevOps are:

    Everything-as-code: The current state of IT architecture has adopted an “everything-as-code” approach. Infrastructure, configuration, compliance and security can all be transformed into code.

    Automate everything: Codifying everything enables standardization of processes and policies across the organization. The processes are simplified into repeatable functional code, and this makes it easier to automate the development and deployment processes while significantly reducing human errors.

    Validation: There are many tools used for continuous integration, delivery and deployment in addition to other tools used for maintaining infrastructure and compliance. Without validation, there would be no way to know if everything is functioning as needed and it would be difficult to ensure seamless delivery in a highly agile environment.

    Above all, teams adopting DevOps methodologies take end-to-end responsibility of managing the application development life cycle (develop, deploy and maintain). They bridge the responsibilities gap between Dev and Ops into one team. 

    SRE Focus Areas 

    Successful site reliability engineering (SRE) teams focus on the volume of performance metrics and the process of shifting left the responsibility for managing and mitigating risk. Fundamentally, they share the same values as developers in creating efficient applications. However, SRE teams focus on introducing efficiencies based on incidents that occur and sometimes need development teams’ intervention to shift the risk left in the product development cycle. 

    Troubleshooting is one of the main responsibilities of SRE teams since they have to manage incidents. As a result, SRE teams have a strong knowledge of product design which is essential for product reliability, rollouts and reducing recovery time. Scalable automation is also a big part of the challenge SRE teams face. Oftentimes, tasks are done manually and this can increase the likelihood of human error. A solution is implementing a policy-as-code approach in concert with developer teams.

    It should be noted that when it comes to the responsibility and scope of work between SRE and DevOps, the lines are blurred—especially with the proliferation of APIs and when evaluating microservices. The types of tools being used are a differentiator since SRE teams measure efficiency through monitoring, detection and incident reporting systems. 

    Breaking the Silos 

    Modern organizations will fail when divided into silos. Developers understand that to optimize their internal processes, they need to use a DevOps methodology and involve SRE teams. For example, a startup growing and looking to scale needs development teams that are performing SRE functions with strong operational knowledge. It requires buy-in and understanding of every team member to know their role and the needs of the organization as it grows and responsibilities shift. 

    These fundamental values are crucial for an enterprise looking to achieve an efficient CI/CD pipeline. In a reactive cycle, SRE teams step in and are responsible for some parts of operations, but the DevOps paradigm is different because it integrates the responsibility of deployment, monitoring and remediation throughout the entire team. 

    Organizations embracing DevOps practices should embrace SREs’ expertise and welcome their practices into developer teams. SREs can leverage automation to fix issues as they occur and also make changes in software architecture to avoid such issues in the future. Compared to the reactive approach, developer teams are incentivized to keep things constantly running. 

    Scaling DevOps practices requires shared responsibility. Of note, developers have to answer when the phone rings and this can cause chaos in engineering teams responsible for large enterprise-grade applications with fast time-to-market and frequent update cycles.

    A Modern Perspective

    Efficiency is a core value shared by both SRE teams and the DevOps methodology. When organizations can fully integrate operations within the DevOps cycle, those silos can be broken down and integrate a shift left mentality. The traditional reactive remediation cycles won’t cut it anymore. Proactivity is essential for today’s lightning-fast application needs and continuous updates. 

    Application problems can be addressed immediately when approached with modern tooling and a policy-as-code approach enabling developers and SREs teams to work together. The modern relationship between DevOps and SRE teams should be one of coexistence. Both are needed for successful scalability within the enterprise. Many once thought SRE teams and developers couldn’t coexist in harmony, but debunking that myth helps organizations optimize their collaboration efforts. 

  • The Future of Low-Code Development

    The Future of Low-Code Development

    The days when IT teams relied on clunky software development processes and labor-intensive hand-coding to build tangible, reliable and modern applications are coming to an end. With the rise of new automation technology, rapidly rising expectations and demands from innovation-craving customers and end users and a shortage of developers, the software sector has been forced to seek alternative approaches to not only deliver their services and products but to also remain digitally-current. Now, overcoming this challenge is possible with low-code development platforms.

    What is Low-Code Development and Why all the Fuss? 

    Low-code development is a software development practice that empowers digital product teams and citizen developers to build apps without time-consuming hand-coding. In general, a typical low-code platform includes a visual integrated development environment (IDE), connectors to various backends or services, an application life cycle manager and an integrated design-to-code system.

    With these features and attributes, low-code platforms:

    • Abstract away the code behind complex commands and actions
    • Streamline how projects are being innovated and distributed in the span of weeks, not months
    • Enable citizen developers to build apps

    These tools are so effective because they break the mold and automate the app development cycle by providing reusable building blocks. These building blocks can easily be assembled into an entire app, allowing both experienced and beginner technical minds to handle a bigger volume of projects faster than ever. This flexibility is handy, especially when the digital world expects over 500 million apps and digital services to be built and deployed by the end of 2023, according to IDC FutureScape. That is more than all of the software solutions created in the last four decades. 

    A report by Gartner forecasts that by 2024, low-code adoption will be so widespread that 75% of the software solutions built around the world will be made with the help of such tools. While these tools won’t entirely replace traditional software development, they deliver a contemporary, simpler and faster approach to building apps.

    Benefits of Low-Code Development

    Whether it is automating individual manual tasks, eliminating old development models like waterfall methodology or making it easier for a tech newbie to build a prototype or a flexible app, low-code development has many benefits.

    The benefits of low-code software include:     

    Innovative projects can be assembled by a non-technical audience 

    Low-code app builders are game-changers. The need for experienced coders is reduced as this type of tool provides the necessary components and building blocks for non-technical audiences to be involved in full-cycle app development. Another recent Gartner report said that 80% of technology products and services will be created by people outside of tech-driven fields by 2024. And in times when the demand for commercial software, new progressive solutions and skilled developers exceeds the supply, low-code tools are a perfect fit for citizen developers, designers, professional developers, non-technical stakeholders and others.

    Velocity and optimized development cost

    Today, speed is everything. IT businesses and clients require their software to be built within short timeframes and within a strict budget. Legacy systems need rapid modernization without a big investment. One of the greatest advantages of low-code tools is that they let people build at scale without incurring heavy costs or consuming too much time. Automation apps, mission-critical systems and mobile applications can all be created with low-code software.

    Reinventing traditional processes and reshaping how software is built

    Using these automation tools, you don’t have to worry about HTML/CSS, scalability, coding rules, page layout, branding or screen sizes. As mentioned above, some low-code development platforms come with a system that covers everything from design to code and generates production-ready code in the end. Designers and developers come together to use a single platform that simultaneously:

    • Allows them to create solutions that are easy to maintain and that scale on cloud-native architecture
    • Modernizes and facilitates their work 
    • Improves productivity and collaboration
    • Fits their workflow and skills

    Low-code/no-code tools are quickly becoming the next prototyping tools in the enterprise—without needing the technical skills in traditional UX/visual designer-focused tooling. With low-code or no-code tools, screen design is typically done using drag-and-drop, WYSIWYG design-time experience; it’s usually as simple as making a PowerPoint deck. The main difference between this and a UX/visual design tool is that the low-code/no-code tool is building a running app in the background, with real code, connected data, real screen interactions and more. This means that any team member with an idea can express the design, not just a person who has access to a designer.

    No special skills are needed to build something tangible and real—while at the same time going beyond what a mockup or prototype can deliver.

    The future of tools in this space will include connectors and adapters to popular design tools, such as Sketch, Figma and Adobe XD. These connectors and adapters will enable digital product teams—designers and developers—to use a design process and then import designs, interactions, branding and themes into low-code tools, while still obtaining the considerable benefits of time and cost savings of not having to re-build screens that have already been designed pixel-perfect.

  • Digital.ai Extends Scope and Reach of DevOps Platform

    Digital.ai Extends Scope and Reach of DevOps Platform

    Digital.ai today unveiled the Ascension release of its namesake DevOps platform that adds pre-built metrics and best practices dashboards using a Test Lens capability to more easily employ analytics to identify software delivery bottlenecks.

    In addition, the company has added autonomous testing tools that automatically generate performance and security tests for mobile applications. These tools can be run by DevOps teams, developers or business users. An enhanced Change Risk Prediction capability enables machine learning algorithms to make more extensive use of historical data.

    Finally, Digital.ai has also added integrations with the open source Argo continuous integration/continuous delivery (CI/CD) platform and made available an Agility Sync tool for building custom integration with legacy application environments and opened an online marketplace for integrations.

    Jeff Moloughney, chief marketing officer for Digital.ai, said the goal is to extend the reach of the company’s DevOps platform. At its core, the platform has a value stream management (VSM) and version control software originally developed by XebiaLabs and CollabNet VersionOne before the two companies merged to create Digital.ai. The combined company subsequently acquired Numerify, a provider of analytics tools infused with artificial intelligence (AI), Experitest, a set of testing tools, and Arxan, a provider of an application security platform. The company claims that its platforms are used by more than 1,500 organizations.

    In general, DevOps is entering a new era as organizations realize how dependent they are on software to drive business processes, noted Moloughney. Historically, the adoption of DevOps practices has been driven from the bottom up within most organizations. Now, business and IT leaders are also looking to drive the adoption of a consistent set of DevOps best practices to gain more visibility into software delivery, he added.

    That does not mean, however, that organizations can dictate what tools individual developers can use, so the DevOps platform employed has to be extensible in terms of the available integrations, said Moloughney.

    At the same time, Molougney added that more DevOps processes will be automated using machine learning algorithms. Digital.ai is embedding these algorithms within its core platform to both uncover software delivery bottlenecks and automate routine tasks such as testing.

    It’s not clear to what degree organizations that have already embraced DevOps might be considering replacing their existing platforms but, regardless of size, most of them are encountering issues. On the plus side, the number of organizations that are adopting DevOps practices more broadly is increasing as more digital business transformation initiatives are launched. As those practices evolve, the expectation is many of those organizations will embrace analytics in the form of VSM to better optimize their efforts.

    In the meantime, the rate of DevOps adoption across enterprises will continue to vary widely. Each development team within an organization tends to define a set of DevOps practices based on their own requirements. The challenge, given all the dependencies that exist between those projects, is determining the actual rate of progress the organization is making as each of those isolated initiatives progresses.

  • Riverbed Unveils Unified Observability Platform

    Riverbed Unveils Unified Observability Platform

    Riverbed today launched a beta of a unified observability platform it will make available under the Alluvio by Riverbed brand name.

    Jim Hansen, senior vice president for product management at Riverbed, said the Alluvio by Riverbed observability platform combines several existing network and application performance management platforms into a single offering that is now infused with machine learning algorithms to provide deeper insights into IT environments.

    The goal is to provide an open observability platform that can not only aggregate data collected from both Riverbed and third-party offerings but also identify the best ways to resolve an IT issue, added Hansen.

    Scheduled to be generally available later this year, the Alluvio by Riverbed observability platform will differ from existing observability platforms in that it will enable IT teams to not just identify the root cause of an IT issue, but also note which processes should be employed to resolve it, he said.

    With this launch, Riverbed is attempting to reposition itself. Previously, the company offered network and application performance management platforms alongside a wide range of network software and hardware. Each of those offerings is now a source of data that can be fed into the Alluvio by Riverbed observability platform, noted Hansen.

    Observability, of course, has always been a core tenet of any DevOps best practice. Achieving that goal, however, has proven to be elusive. Most of the IT monitoring tools used today are designed to track a set of pre-defined metrics. Whenever there is an issue, IT teams typically convene in a war room where they try to uncover the root cause of, for example, a performance issue by comparing reports and the various dashboards generated by monitoring tools. It can take weeks to discover an issue that often only takes a few minutes to fix once the source of the problem is identified.

    In contrast, observability platforms promise to reduce the time required to discover IT issues by aggregating all the data generated by the IT environment within a single platform that correlates events and makes it easier to identify anomalous behavior. Armed with those insights, it becomes a lot simpler for IT teams to launch queries that enable them to resolve issues faster.

    Those insights are also increasingly being used to drive business decisions as organizations become more dependent on software to drive digital business transformation initiatives. However, a recent survey conducted by Riverbed finds three-quarters of business decision-makers (75%) said their organizations struggle to glean actionable insights from data generated by their technology infrastructure.

    The challenge IT teams inevitably encounter is they don’t always know the right questions to ask, which is an issue that can be addressed by machine learning algorithms capable of identifying anomalies indicative of an IT issue that needs to be resolved.

    There already is no shortage of observability platforms. The issue now is determining which observability platform to employ across a distributed IT environment that is becoming more instrumented with each passing day.