Category: DevOps Practice

  • Faster and Better Testing?

    Faster and Better Testing?

    The whole concept of Agile and DevOps was to iterate development faster and deliver results in a more timely manner. As we learned more about both methodologies, processes and policies were put into place that improved the quality of what was created. Early ideas of quality like, “We can just do another iteration,” still exist, but are largely not used. Rollbacks are a thing in most orgs, and though the environment is more complex, rollbacks are easier to manage in the smaller development changes that iterations generally represent.

    And once we got past the whole, “Anything that slows the process down is bad!” mentality that permeated early implementations of both DevOps and Agile development, we started seeing amazing things. But including things like security and functional testing were not viable in the fast-iteration world that Agile and DevOps created. And they really weren’t viable at most orgs in the slow-iteration world of waterfall, either. Staffing and time constraints made them fall far short of optimal in the vast majority of organizations. But putting them into the DevOps process challenged vendors to find a way to do things faster and challenged organizations to look at quality and security a little differently.

    And now, we have tools that can test—be it functional, integration or security—at the speed of DevOps. Tools that enable Agile development with an eye toward security. A far larger number of developers now acknowledge their part in application security and are creating more secure code.

    Keep an eye on how AI/ML is being used in testing—all forms of testing—and how it evolves in the next year or two. The same with full-on automation. I’ve made no secret that I view AI/ML in the testing space as advanced automation because of what it enables, so maybe “Watch what AI/ML-enabled automation is available,” is more accurate. The ability to create, run, process results and even modify code to resolve issues are all out there today, and getting better. Faster, more accurate, more automated.

    Much like back when intrusion detection became intrusion prevention, I would not just turn it on and walk away, but think about the ability to upskill developers; “Here is a list of things the automated system found, and a list of fixes it proposes.” They are literally being shown how to do their craft better.

    I’ve been a developer, so I’m not being offensive, here. If you get something that tells you, “This is an issue; here is why it happened and here is what to do to fix it,”take the opportunity to get better at coding. Look closely at the what, the why and how to fix it and incorporate that into your work.

    And keep rocking it. We’ll be making more stable and secure code, but you’ve kept systems running without that feedback and fixed the errors along the way. This just makes it easier to find the errors early—before they crash production and make a fire drill.

  • Datadog Dives Into Universal Service Monitoring

    Datadog Dives Into Universal Service Monitoring

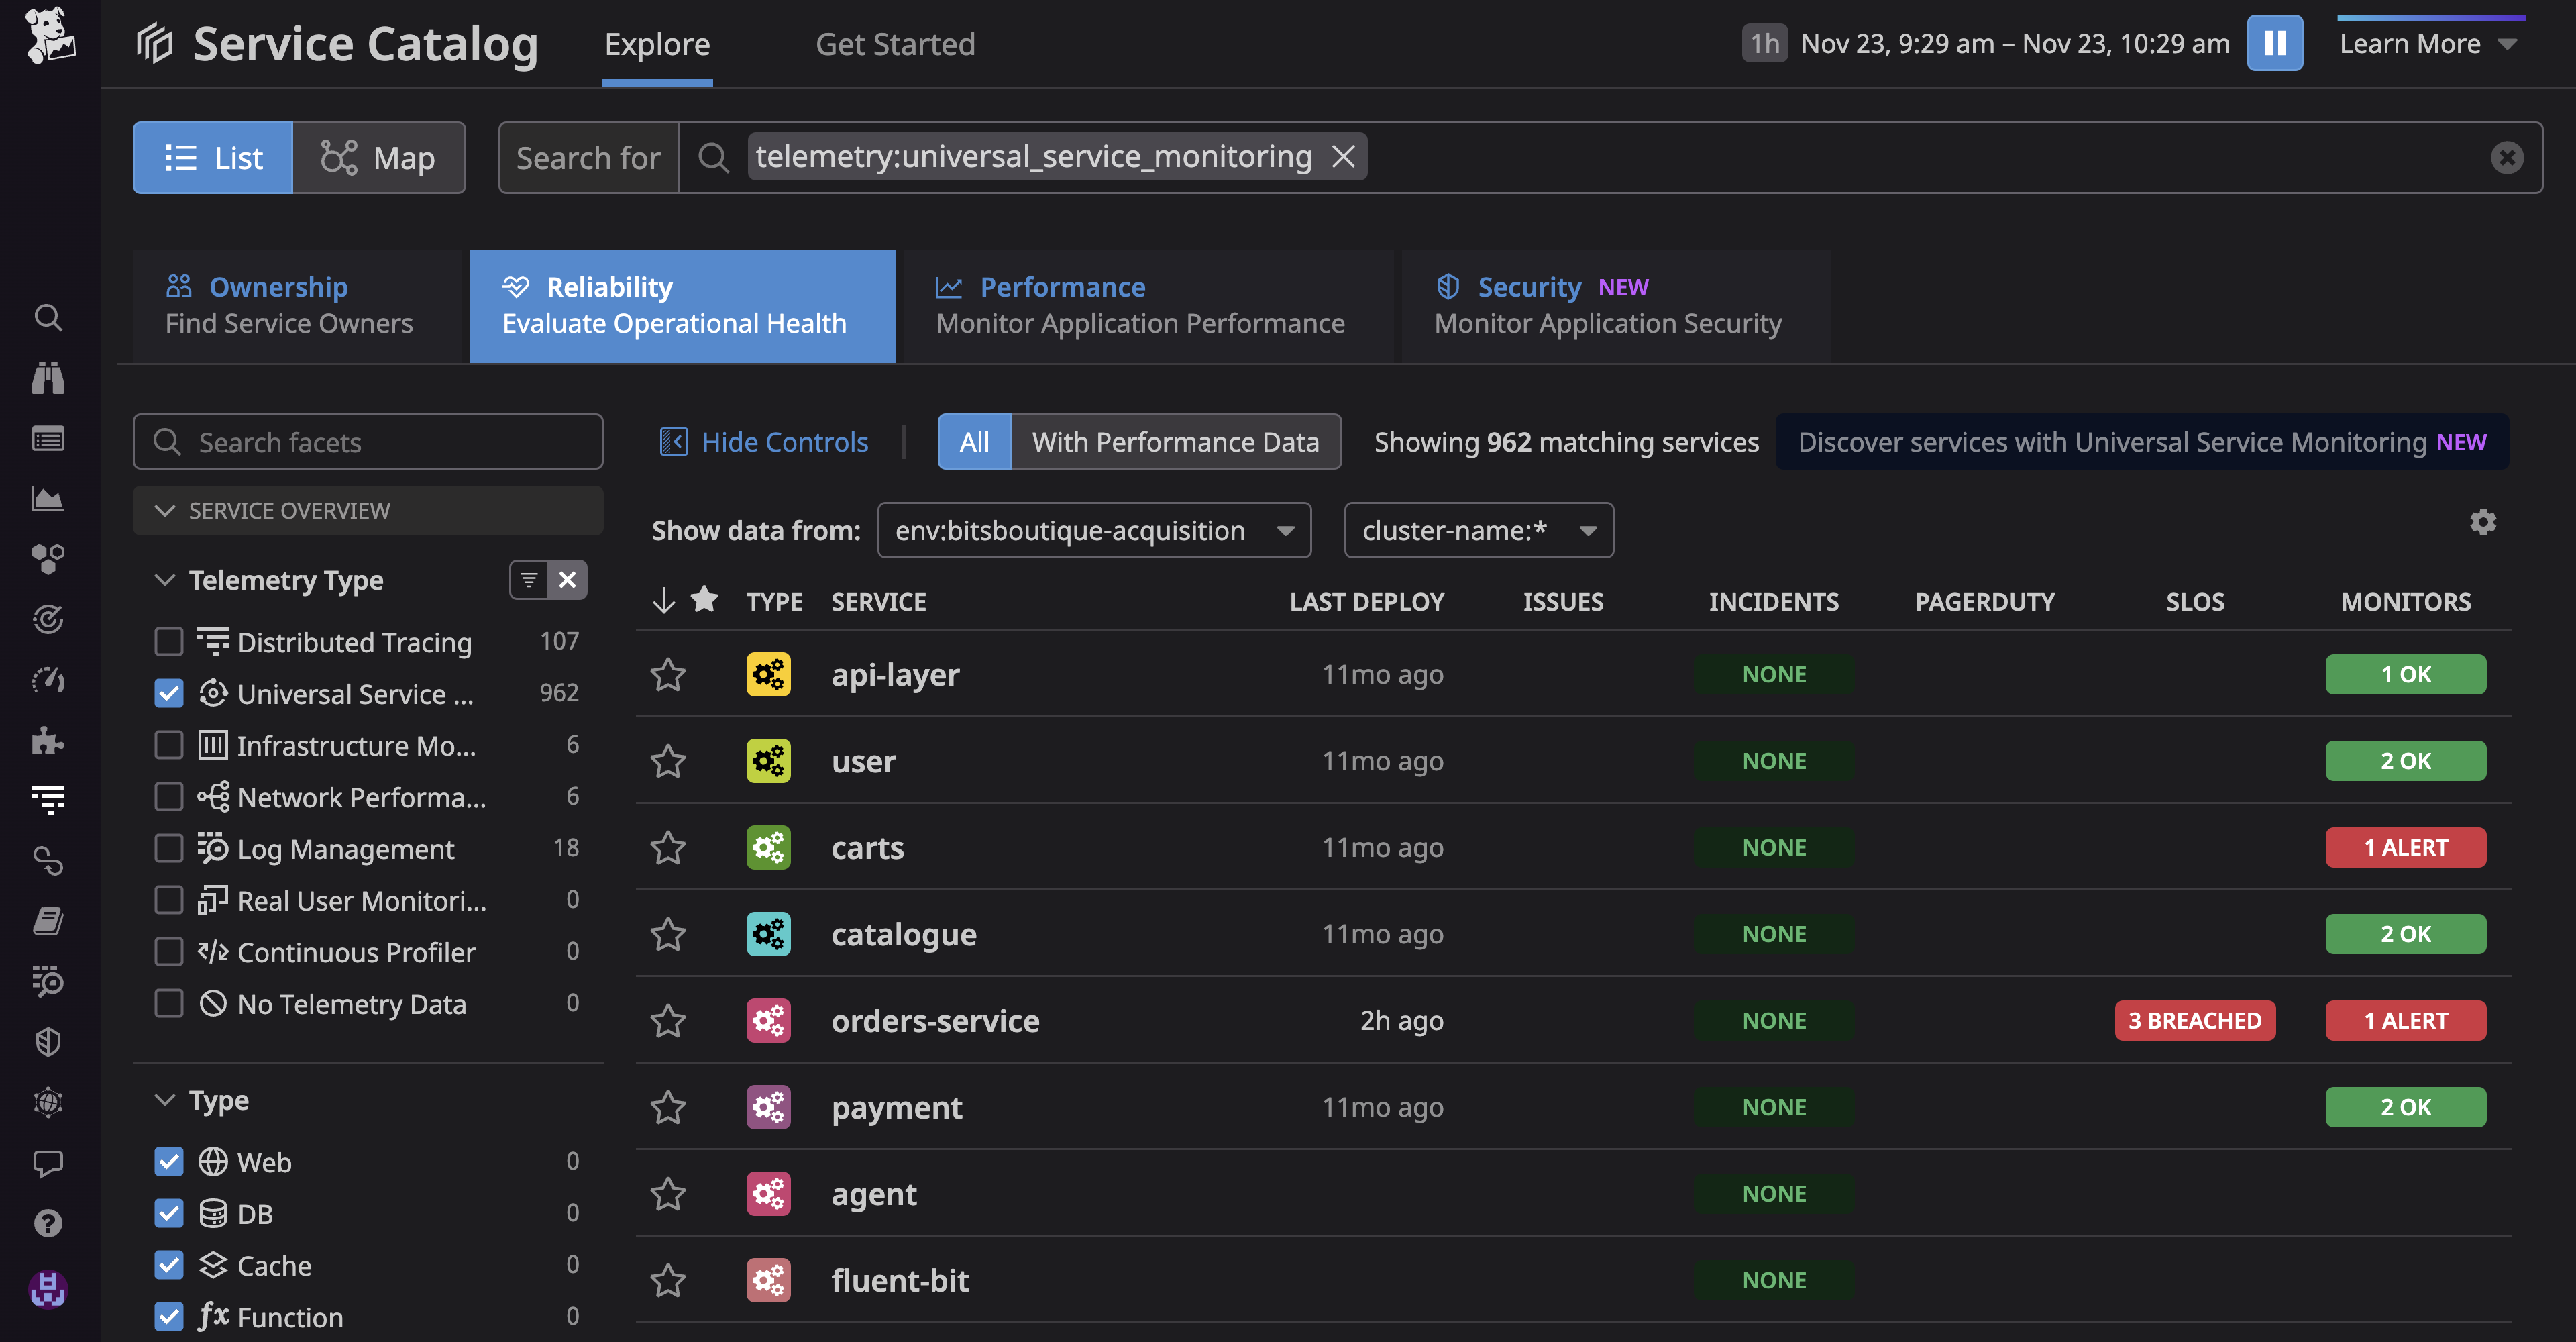
    Datadog, Inc. today made generally available a Universal Service Monitoring service that takes advantage of the extended Berkeley Packet Filtering (eBPF) microkernel in a Linux operating system to automatically detect all the services that make up an application environment without changes to the code used to construct them.

    Yrieix Garnier, vice president of product at Datadog, said as application environments continue to evolve IT teams are now trying to track not just individual microservices but also entire business processes such as order-to-cash. Before those services can be instrumented, however, DevOps teams need a simple way to discover them, he noted.

    Within the Linux operating system, eBPF makes it possible to employ a sandbox environment to identify and map the services that make up an application environment, including both internally developed and third-party services regardless of what programming languages were used to build them, added Garnier.

    DevOps teams also gain visibility into the health of every service and deployment through real-time request rate, error and duration (RED) metrics and correlated infrastructure metrics and application logs. They can then expand monitoring capabilities provided via Datadog agent software to employ distributed traces that can be correlated with observability data.

    The Datadog Universal Service Monitoring service is also integrated with the Service Catalog that Datadog makes available to determine which development team created a specific service.

    The goal is to close a visibility gap that has emerged as more IT organizations align their management efforts around specific application services in the age of digital transformation rather than the components that make up a service, noted Garnier.

    DevOps teams today are simultaneously being tasked with diving deeper into application environments to discover issues before services are disrupted and also tracking the services that span multiple application components. Collectively, the expectation is that DevOps teams will be able to ensure that application services are not just available but also consistently delivered. Ultimately, IT organizations are being tasked with removing much of the guesswork that has historically characterized the management of IT.

    Less clear is how much those shifts will ultimately drive the reorganization of IT teams that are still mostly organized around the platforms they support versus the services being delivered. However, as business leaders increasingly appreciate how dependent the overall organization is on application services, the need to manage them in a more comprehensive manner becomes apparent.

    In the meantime, DevOps teams are evaluating whether their existing tools and platforms enable them to accomplish that goal. Datadog is making a case for employing a service it manages on behalf of DevOps teams versus each DevOps team having to construct and maintain its own observability platform. Datadog, most recently, extended the reach of its namesake cloud-delivered monitoring and observability platform to address continuous testing, application security and cost management.

    It will be up to each organization to decide how best to achieve their observability goals. One thing that is certain is the current level of visibility they have into application environments is not nearly sufficient.

  • Logz.io Unveils Managed Open 360 Observability Platform

    Logz.io Unveils Managed Open 360 Observability Platform

    At the AWS re:Invent 2022 conference, Logz.io launched an Open 360 platform that combines multiple open source technologies to provide observability across both existing monolithic and emerging cloud-native application environments.

    Existing Logz.io offerings included in the Open 360 platform are Logz.io Kubernetes 360, a managed observability platform based on open source tools such as OpenSearch analytics software, Prometheus monitoring tools and Jaeger distributed tracing agents.

    In addition, Open 360 includes Logz.io Telemetry Collector agent software, Logz.io Data Optimization Hub dashboard, Logz.io LogMetrics Index for converting log data into metrics and the Logz.io Trace Sampling Wizard tool for configuring open source OpenTelemetry Collector agent software.

    Logz.io CEO Tomer Levy said rather than requiring organizations to combine a set of disjointed open software tools to create an observability platform, instances of open source tools have been curated by Logz.io. The goal is to streamline the number of tools and platforms that DevOps teams will need to observe multiple classes of applications, he noted.

    It’s still early days as far as the adoption of observability platforms is concerned, but it’s apparent that as application environments become more complex the monitoring tools DevOps teams rely on today will need to evolve. Observability platforms, in general, promise to unify logs, metrics and traces in a way that makes it simpler to launch queries to identify the root cause of an issue rather than simply tracking a set of pre-defined metrics.

    The rate at which DevOps teams will embrace observability will naturally vary, but the choice many DevOps teams are trying to navigate is how much to rely on proprietary observability platforms rather than using open source software to construct their own. Logz.io is making a case for finding a middle ground between those two extremes by relying on a managed service based on open source tools.

    Observability has always been a core DevOps tenet, but achieving and maintaining it is challenging. Most DevOps teams today aspire to maintain some level of continuous monitoring. However, as it becomes easier and less costly to instrument applications, interest is rising in observability platforms that simplify the investigation of anomalies indicative of an issue that could disrupt a distributed application environment.

    More challenging still, DevOps teams are also now managing a much wider range of application types as cloud-native applications based on microservices deployed on Kubernetes clusters are deployed alongside legacy monolithic applications running in the cloud and on-premises IT environments. The Logz.io approach enables DevOps teams to manage those applications at a lower total cost, noted Levy.

    Regardless of the approach to observability, the increasing complexity of application environments has become a major challenge for organizations that are increasingly sensitive to costs. Many of them can’t afford to hire additional DevOps engineers. Instead, the focus is on increasing the productivity of existing DevOps teams using a new generation of observability platforms that should cost less to acquire and deploy than to expand existing teams of DevOps engineers. That may not necessarily eliminate the need to hire additional DevOps engineers, but it should ensure organizations are getting the most out of the DevOps teams they already have.

  • Zilliz Unfurls Managed Vector Database Service

    Zilliz Unfurls Managed Vector Database Service

    Zilliz this week made generally available a managed cloud service that can now be spun up in less than five minutes. The service is based on the company’s open source Milvus vector database.

    Frank Liu, director of operations for Zilliz, said the managed Zilliz Cloud service running on the Amazon Web Services (AWS) cloud will make vector databases much more accessible to a wider range of application developers.

    Vector databases are gaining traction because they provide artificial intelligence (AI) application developers with a more efficient method for managing the unstructured data need to train AI models. Currently, many of those teams are relying on labels and tags to classify and manage data. The Milvus vector database employs deep learning algorithms and its own AI model to create and store, index and manage vectors to more efficiently classify data, said Liu.

    Based on a cloud-native architecture that, for example, employs Kubernetes to scale consumption of cloud resources more efficiently, Zilliz Cloud can also scale to process tens of billions of high-dimensional vector data for data-intensive applications, he added. The company claims Zilliz Cloud delivers up to 10 times greater throughput and five times lower latency for read and write operations for data-intensive workloads.

    Other attributes of the managed Zilliz Cloud include support for multi-language software development kits (SDKs), a web-based graphical user interface to search and explore data, SOC 2 compliance, network isolation using IP whitelists and full data encryption in transit (TLS).

    In the future, Zilliz also plans to add support for Microsoft Azure Cloud and Google Cloud Platform in addition to graphical processor units (GPUs) to optimize the performance of its deep learning algorithms.

    Potential use cases for a vector database span everything from image retrieval and video analysis to fraud detection to drug discovery. Organizations that already use Milvus, which is being advanced under the auspices of the LF AI & Data Foundation, include eBay, Shopee and SmartNews.

    In general, the rise of data-intensive workloads is driving more organizations to embrace DataOps best practices to optimize the management of massive amounts of data. Organizations that build AI models are typically at the forefront of those efforts given the massive amounts of data typically required to train AI models. The challenge organizations have historically faced is not many have the internal expertise required to manage a vector database. The Zilliz Cloud eliminates the requirement by relying on the expertise of a team of database administrators trained by Zilliz to operate a managed service.

    It’s not clear at what rate organizations are embracing vector databases to build AI models. As the next era of applications are constructed, it’s only a matter of time before the machine learning operations (MLOps) practices used to build AI models converge with DevOps practices used to build the applications in which those models will be embedded. The challenge is the data science teams that build AI models tend to also have a distinct DataOps culture all their own; DevOps teams will need to find a way to embrace and extend that.

    In the meantime, the number of types of databases being used to build applications will only continue to expand so it will be up to each DevOps team to know when to manage each one themselves versus relying on a managed service.

  • Top 10 US States for a Coding Career

    Top 10 US States for a Coding Career

    Coding jobs are in high demand and the Bureau of Labor Statistics projects that computer and information technology employment will grow 13% by 2030. Alongside the increasing demand, coding has emerged as a highly flexible career option with room for growth. 

    If you’re looking to build a lucrative career in coding, researchers at Scrapfly.com pulled together a list of the top 10 states for coders and what the average salary is in those states.

    Scrapfly.com, a web scraping API, calculated each state’s job openings per 100,000 people, as well as the median annual wage. Delaware came out on top with 759 coding jobs per 100,000 people, with a median wage of $108,440. Behind it is Vermont with 519 jobs per 100,000 people and a median wage of $99,210. 

    Surprisingly, the least populous state in the U.S., Wyoming, rounded out the top three with 488 jobs per 100,000 people. 

    “As you can see by the data, it’s a common misconception that you have to get a job in one of the more populous states in order to get the dream job as a software developer. Wyoming is a great example of a state that is small in population but is really pushing the boundaries in terms of creating jobs within the tech industry,” Scrapfly.com researchers said. 

    Despite having the fourth-highest annual salary, Alaska placed seventh on the list with 443 jobs per 100,000 people. Behind it, Massachusetts had the highest median wage at $128,160 per year. 

    Numbers seven through 10 on the list all bring in at least $100,000 per year, on average, with New Hampshire and Rhode Island providing 411 and 395 jobs per 100,000 people. 

    Furthermore, Montana, South Dakota and North Dakota come in at numbers four, five and six with their median wages varying between $80,000 and $78,000. In those states, between 458 and 475 jobs per 100,000 people were recorded. 

    “Whether you’re already established in the coding world or looking to kickstart your career journey, there are plenty of states that provide ample opportunity to flourish,” said Sparkfly.com’s research team. 

    Although many people don’t have a coding background, it is easier than ever to learn the skills necessary to get a job in coding. Indeed.com advised learning a programming language like JavaScript, Python or Swift and taking a coding class. It also touched on the importance of contributing to open source, building projects and expanding your portfolio. 

    “This research demonstrates that a career in tech and coding is more accessible than many believe. We can see this not only by the sheer number of job openings across the states but by the attractive average salaries too,” the researchers said.

  • Blue-Green Deployment: What Are the Options?

    Blue-Green Deployment: What Are the Options?

    Blue-green deployment is a change management strategy for software releases. Blue-green deployments require two identically configured hardware environments. One environment is active and serves end users while the other remains idle.

    Blue-green deployments are typically used for applications with strict uptime requirements. First, new code is released to staging environments and fully tested. Once the code is reviewed, the team adjusts the router configuration to redirect application traffic to the staging environment. This staging environment then becomes the production environment.

    If problems are found after the switch, the team switches traffic back to the old production environment and continues running the original version. Once the new code is validated in production, the team can update the code in the idle production environment, and use it to test the next release. For more background, see this detailed blog about the blue-green deployment pattern.

    Blue-Green Deployment Benefits

    Here are some of the main advantages of blue-green deployments.

    Standby System
    A blue-green deployment always ensures a server is on standby, providing a crucial backup when the system fails. In addition to facilitating software updates, this approach improves risk management, allowing you to switch to the backup server during a malware breach.

    Redirecting traffic to the other system version is easy because it has the same infrastructure. The system can stay live and functional while the teams fix issues.

    Smooth, Fast Releases
    A blue-green deployment allows product owners to push software to production quickly. It offers the flexibility to release an update at any time, with no downtime required. End-users don’t feel the impact of each release. DevOps teams can also benefit from smooth releases because they don’t have to race to meet deadlines for scheduled outages.

    Simple Rollback Process
    Rolling back an update is also fast in a blue-green deployment. Simple rollbacks reduce the risk of experimenting in a production environment. You can implement rollbacks by setting the application to read-only or using a load balancer to handle active transactions during the cutover. This can be significant for Kubernetes security because if security vulnerabilities are discovered in the cluster, you can easily roll back to a previous safe version.

    No Downtime
    A blue-green deployment allows you to avoid downtime, whether scheduled or unexpected. You can shift users to the other model during maintenance checks and fixes. Upgrades can occur anytime because there is no need to wait for times with lower traffic (i.e., midnight).

    Testing in Production
    Testing in production allows you to check a live product’s functionality, showing how it performs in the real world. The drawback of this approach is that it can expose end-users to bugs during testing. A blue-green deployment lets you test the product in an inactive production environment, minimizing the risk of bugs making it to the live environment.

    Blue-Green Deployment in Kubernetes

    Many development teams are migrating to Kubernetes as an environment for development, testing and production deployments. Kubernetes makes it easy to deploy applications and can also be used to automate blue-green deployments.

    However, Kubernetes does not provide out-of-the-box blue-green deployments. It has a Deployment object that allows “rolling updates”—this allows you to update your applications without downtime by incrementally replacing pods with the latest version of an application.

    This is similar to a blue-green deployment but doesn’t offer all the benefits. Rolling deployments can make it difficult to roll back if there are issues with the new version. You might require Kubernetes health checks to determine the status of pods within a deployment. Applications might take time to roll out, while the pure blue-green pattern allows you to switch over to a new version instantly.

    Blue-Green Deployment in Kubernetes: What are the Options?

    Argo Rollouts
    Argo Rollouts is a set of Kubernetes controllers and CRDs that provide advanced deployment features for Kubernetes such as blue-green and canary deployments, experiments, and other progressive delivery capabilities.

    Argo Rollouts optionally integrates with Kubernetes ingress controller implementations and service meshes, leveraging traffic shaping to incrementally switch traffic to new versions during updates. Rollouts can also query and interpret metrics from other systems to validate key KPIs, and automatically promote or roll back releases.

    Flagger
    Flagger is a progressive delivery tool that automates the release process of applications running on Kubernetes. It reduces the risk of introducing a new software version into production by gradually migrating traffic to the new version while measuring metrics and performing conformance testing.

    Flagger implements multiple deployment strategies (canary releases, A/B testing, and blue-green deployments) and integrates with various Kubernetes ingress controllers, service meshes, and monitoring solutions.

    GitLab CI/CD
    GitLab is a collaborative DevOps platform and open-source code repository for large software development projects.

    In addition to a code repository, GitLab also provides CI/CD automation and issue tracking. GitLab repositories allow the hosting of different software versions and entire development pipelines, allowing users to roll back software and environments in case of unexpected problems.

    GitLab supports both manually triggered deployments and scheduled deployments to Kubernetes production systems, using progressive deployment (including blue-green deployment).

    CircleCI
    CircleCI is a CI/CD platform that helps engineering teams build, test, and deploy software, while viewing code changes in real-time in a dashboard UI.

    CircleCI can be deployed to virtually any target and can be easily configured to integrate with other services, for deployment strategies such as feature flags, blue-green and canary deployments. It supports both fully automated deployment processes or a process with manual approvals, with the ability to easily customize deployment configuration.

    Conclusion

    In this article, I explained the blue-green deployment pattern, its benefits, and how it can be beneficial for Kubernetes deployments. I introduced four tools that can help you implement blue-green deployments in your Kubernetes clusters:

    ● Argo Rollouts – Part of the open source Argo project. Includes Kubernetes controllers and CRDs that provide advanced progressive deployment features.
    ● Flagger – An open source progressive deployment tool for K8s that supports canary releases, A/B testing, blue-green, and more.
    ● GitLab CI/CD – Supports both manually triggered deployments and scheduled deployments to Kubernetes production systems.
    ● CircleCI – Supports deployment to Kubernetes clusters, with deployment strategies such as feature flags, blue-green and canary deployments.

    I hope this will be useful as you learn to implement progressive deployment patterns in your Kubernetes environment.


  • Five Great DevOps Job Opportunities

    Five Great DevOps Job Opportunities

    DevOps.com is now providing a weekly DevOps jobs report to highlight opportunities for DevOps professionals as part of an effort to better serve our audience.

    Our goal in these challenging economic times is to make it easier for DevOps professionals to advance their careers.

    Of course, the pool of available DevOps talent is still relatively constrained, so when one DevOps professional takes on a new role it tends to create an opportunity for others.

    The five job postings shared this week are selected based on the company looking to hire, the vertical industry segment and, naturally, the pay scale being offered.

    We’re also committed to providing additional insights into the state of the DevOps job market. In the meantime, for your consideration:

    LinkedIn

    Major League Baseball
    New York City
    Senior DevOps Engineer
    $150,000 to $190,000

    SimplyHired

    Coca-Cola
    Atlanta
    Product Lead Data DevOps
    $110,000 to $160,000

    ZipRecruiter

    Sierra Nevada Corp.
    Englewood, Col.
    DevOps Engineer II
    $104,827 to $144,138

    Indeed.com

    Paramount
    New York City
    Azure DevOps Engineer
    $90,000 to $105,000

    Dice.com

    North American Bancard
    Remote
    Google Cloud Platform DevOps Engineer
    $80,000 to $120,000

  • VMware Brings Java 17 Support to Spring Boot Framework

    VMware Brings Java 17 Support to Spring Boot Framework

    VMware this week made a Spring Boot 3.0 update for building microservices-based Java applications that is based on the latest long-term support release for the Java Standard Edition (SE) platform.

    Michael Minella, senior director of software engineering at VMware, said the latest edition of the framework supports Java 17. The hope is that adding this support will encourage organizations to move from Java 8 to the latest long-term release of the platform without requiring multiple upgrades to other previously released editions of Java SE.

    In addition, Spring Boot 3.0 now also natively supports a high-performance Java development kit (JDK) known as GraalVM along with version 6.0 of the Spring framework for building Java applications using OpenJDK, an open source version of Java SE that VMware made available earlier this month.

    VMware added support for Micrometer and Micrometer Tracing to improve the observability of Spring applications that will increasingly include multiple microservices dependencies.

    Finally, VMware also added support for Jakarta Enterprise Edition (EE) 10, an open source extension of Java SE that is being advanced under the auspices of the Eclipse Foundation.

    Minella said support for Java 17 coupled with GraalVM provides a stable foundation for building Java applications that are significantly faster than applications that rely on Java 8—still the most widely used edition of the platform. DevOps teams should begin to adopt a new standard for building and deploying the Java applications that still dominate enterprise IT environments, Minella said.

    There is, of course, no shortage of programming languages being used to build enterprise applications. After three decades, however, Java continues to dominate, in large part because of the sheer number of developers that have Java programming skills.

    It’s less clear how quickly legacy Java applications will be updated to run on Java 17 and the GraalVM. Now that Java 17 is supported in Spring Boot—the most widely used framework for building Java applications—the pace of adoption for the latest long-term release of the Java SE platform should accelerate in 2023.

    In addition, Minella noted the latest edition of the Spring framework will put organizations in a better position to take advantage of forthcoming advances such as Project Loom, an OpenJDK effort to replace threads with a lighter-weight concurrency model based on fibers that are managed via the Java runtime rather than the underlying operating system.

    Collectively, these and other technologies will make it less expensive to run Java applications that are significantly faster than previous generations of applications, he added.

    Most DevOps teams will find themselves managing a mix of Java applications—constructed using multiple variants of the core Java SE platform—for many years to come. However, it’s probable most new Java applications will be based on Java 17. In addition, there will be efforts to modernize legacy applications based on previous iterations of Java SE. As a result, most DevOps teams working in enterprise IT environments should expect to see an increase in the overall number of Java-based projects using microservices moving through their pipelines in the months ahead.

  • Rezilion Adds Windows Support to Dynamic SBOM Tool

    Rezilion Adds Windows Support to Dynamic SBOM Tool

    Rezilion has added support for Windows applications to its tool for dynamically generating software bills of materials (SBOMs).

    Rezilion CEO Liran Tancman said in addition to existing support for Linux applications, it’s now possible to analyze all the components that make up a Windows application runtime environment in real-time.

    That capability also makes it possible to search for and pinpoint the location of components, such as the Log4j vulnerability, across millions of files and on thousands of hosts, containers and applications, he added.

    Rezilion has created a searchable proprietary next-generation vulnerability database (NGVDB) that identifies which issues impact specific classes and functions. In addition to surfacing remediation suggestions, the capability also reduced the number of false positives that IT teams would otherwise have to track down.

    The SBOM tool the company provides builds on that capability to provide insights into the complete attack surface of an application that could be exploited by cybercriminals.

    In general, the components of a Windows application are more challenging to track and analyze because of the many different frameworks created to build them over the last few decades. However, with more than half of all applications running on Windows, the need to create SBOMs for those applications has become a more pressing concern, especially in the wake of an executive order issued by the Biden administration that requires federal agencies to provide SBOMs for every application they use.

    It’s not clear how many enterprise IT organizations will be following suit, but the general expectation is that SBOMs will soon be a lot more prevalent than they have been. In the wake of a series of high-profile cybersecurity breaches, there is now more scrutiny of software supply chains than ever.

    The challenge, of course, is determining which vulnerabilities to remediate first once they are identified in an application. There are simply too many vulnerabilities to patch all at once, so DevOps teams need to be able to identify which vulnerabilities are the most severe. For years, cybersecurity teams have been creating spreadsheets filled with long lists of vulnerabilities, but there is usually no context provided in terms of how severe a vulnerability is. As a result, developers would allocate a small portion of their time to applying patches that are prioritized based on intuition and level of complexity rather than severity.

    It may still be a while before most organizations that build software are able to consistently create accurate SBOMs. It may be even longer before the organizations that consume those SBOMs have the processes in place to operationalize them. In theory, an organization, if necessary, should be able to prevent software from being deployed based on the list of components included in the SBOM. However, that decision is not always straightforward. There is usually a range of reasons for including a potentially vulnerable component in an application that needs to be considered.

    One way or another, the overall security of applications is about to steadily improve. The only issue is how much pain will need to be experienced to achieve that goal.

  • Switching From FluentD to Vector Log Aggregation Tool

    Switching From FluentD to Vector Log Aggregation Tool

    Log files are extremely important to the data analysis process as they contain essential information about usage patterns, activities and operations within an operating system, application, server or device. This data is relevant to a number of use cases across an organization from resource management, application troubleshooting, regulation compliance and SIEM and business analytics and marketing insights. To manage logs created by these use cases and make use of this wealth of data, log aggregation tools enable organizations to systematically collect and standardize log files. However, choosing the right tool can be quite challenging.

    This blog will detail and compare the popular open source fluentD and Vector tools for log aggregation.

    fluentD Configuration and Efficiency Calculation

    When using orchestration tools like Kubernetes to deploy containers or other API resources, there is a need for a log aggregator to store the pod or node logs in a cloud platform. For a particular requirement, fluentD was used as a log aggregator tool to push K8s pod logs to cloud storage buckets with a sample configuration as shown below:

    <match kubernetes.**>

    @type <cloud platform name>

    project <project name in cloud platform>

    keyfile <credential json to access the cloud storage> bucket <cloud storage bucket name> object_key_format <name for the file to be used>

    path <file prefix/path where the file have to be stored>

    <buffer tag,time>

    @type file

    path /var/log/fluent/gcs timekey 1m timekey_wait 30 timekey_use_utc true flush_thread_count 16 flush_at_shutdown true flush_mode interval flush_interval 1 chunk_limit_size 10MB retry_max_interval 30 retry_wait 60

    </buffer> <format>

    @type json </format>

    </match>

    Using this system, fluentD was pushing only 47.62% of total logs to cloud storage. Since there was a loss of more than 50%, changes were made to the configuration. In most of the changes, the efficiency was somewhere between 40% and 50%, with a maximum efficiency achieved at an average 67% for an entire day. Below are some of the changes made along with the percentage of logs that were pushed to cloud storage:

    <buffer tag,time> @type file

    path /var/log/fluent/gcs timekey 1m timekey_wait 30 timekey_use_utc true flush_thread_count 16 flush_at_shutdown true retry_max_interval 60 retry_wait 30

    </buffer> Efficiency:- 46.32%

    <buffer tag,time> @type file

    path /var/log/fluent/gcs timekey 1m timekey_wait 30 timekey_use_utc true flush_thread_count 16 flush_at_shutdown true

    </buffer> Efficiency:- 49.89%

    <buffer tag,time>

    @type file

    path /var/log/fluent/gcs timekey 10m timekey_wait 0 timekey_use_utc true flush_at_shutdown true

    </buffer> Efficiency:- 37%

    <buffer tag,time> @type file

    path /var/log/fluent/gcs timekey 30 timekey_wait 0 timekey_use_utc true flush_thread_count 15 flush_at_shutdown true

    </buffer> Efficiency:- 60.88%

    <buffer tag,time> @type file

    path /var/log/fluent/gcs timekey 1 timekey_wait 0 timekey_use_utc true flush_thread_count 16 flush_at_shutdown true flush_mode immediate

    </buffer> Efficiency:- 66.77%

    Vector Deployment, Configuration and Resultant Efficiency

    To improve this further, the open source Vector tool by Datadog was also considered. This tool was suitable for K8s setup with a similar configuration as fluentD and was installed in the nodes.

    A Helm command was used to clone the official repository in its VMs; the configuration was changed as described below and installed it as an agent. Vector comes in two working modes: Agent and aggregator. While agent is the plain mode that pushes logs/events from source to destination, aggregator is used to transform and ship data collected by other agents (in this case, Vector).

    The installation of this tool requires a Helm repository in the local machine to fetch the source code. Hence the below commands were run in a sequential pattern before installing Vector in a K8s cluster:

    helm repo add vector https://helm.vector.dev (Adding vector repo to helm list)

    helm repo update (Updating the helm repos)

    helm fetch –untar vector/vector . (command to clone the repository to local machine)

    Configuration:-

    data_dir: /vector-data-dir

    sources:

    <Custom source id>:

    type: kubernetes_logs (because we are using kubernetes as our source)

    exclude_paths_glob_patterns: <Array of directories which has be excluded when collecting the logs from the nodes> (Optional)

    sinks:

    <Custom sink id>:

    type: <Destination cloud storage>

    inputs: <Array of source id’s from where log has to be pushed>

    bucket: <Bucket name of cloud storage>

    key_prefix: <Path inside the bucket where the logs has to collected> (Optional) encoding:

    codec: <Encoding of the log file> (Optional) Command to install the Vector:-

    helm install vector . –namespace vector

    After deploying Vector in the development environment and testing it, the efficiency was ~100% with negligible loss. The switch was then made to Vector and deployed in the production environment. Vector can ship up 100,000 events or logs/sec, which is a very high throughput rate compared to other tools for log aggregation performance. Vector was able to achieve 99.98-100% efficiency even in the Kubernetes production cluster.

    To learn more about how DataOps can enable highly performant data pipelines with real-time logging and monitoring, watch this video.