Category: DevOps Culture

  • What Chaos Engineering Is (and Isn’t)

    What Chaos Engineering Is (and Isn’t)

    The birth of chaos engineering happened somewhat accidentally in 2008 when Netflix moved from the data center to the cloud. The move didn’t go as planned.

    The thinking at the time was that the data center locked Netflix into an architecture of single points of failure, like large databases and vertically scaled components. Moving to the cloud would necessitate horizontally scaled components, which would decrease the single points of failure. But the move to horizontally scaled cloud deployment practices did not produce the boost to uptime of the streaming service that they expected.

    The specific methods for making a system robust enough to handle instances disappearing was not important. It might even be different depending on the context of the system. The important thing was that it had to be done, because the streaming service was facing availability deficits due to the high frequency of instance instability events. In a way, Netflix had simply multiplied the single-point-of-failure effect.

    Enter Chaos Monkey. Chaos Monkey gave the company a way to proactively test everyone’s resilience to a failure, and do it during business hours so that people could respond to any potential fallout when they had the resources to do so, rather than at 3 a.m. when pagers typically go off.

    Then, Dec. 24, 2012, happened. Amazon Web Services (AWS) suffered a rolling outage of elastic load balancers (ELBs). These components connect requests and route traffic to the compute instances where services are deployed. As the ELBs went down, additional requests couldn’t be served. Since Netflix’s control plane ran on AWS, customers were not able to choose videos and start streaming them.

    To ensure that all of these teams had their services up to the task, an activity was created to take a region offline. Well, AWS wouldn’t allow Netflix to take a region offline (something about having other customers in the region) so, instead, Netflix simulated the activity; labeled “Chaos Kong.”

    Fast-forward to about 2015. Netflix had Chaos Kong working on large-scale vanishing regions and had introduced Chaos Monkey, which worked on small-scale vanishing instances.

    In these early days of chaos engineering at Netflix, it was not obvious what the discipline actually was. There were some catch phrases tossed around about “pulling out wires,” or “breaking things,” or “testing in production,” paired with many misconceptions about how to make services reliable, and very few examples of actual tools to help support that work.

    To formalize the discipline, I was given the task of developing a charter and roadmap for a chaos engineering team at Netflix in early 2015. I built and managed that team for three years. My co-author of “Chaos Engineering: System Resiliency in Practice,” Nora Jones, joined the chaos engineering team early on as an engineer and technical leader. She was responsible for significant architectural decisions about the tools we built as well as overseeing implementation.

    To start, I sat down with my teams to formally define chaos engineering. We specifically wanted clarity on:

    • What is the definition of Chaos Engineering?
    • What is the point of it?
    • How do I know when I’m doing it?
    • How can I improve my practice of it?

    We researched resilience engineering and other disciplines in order to come up with a definition and a blueprint for how others could also participate in chaos engineering. After about a month of working on a manifesto of sorts, we produced the Principles of Chaos Engineering. The discipline was officially formalized:

    “Chaos Engineering is the discipline of experimenting on a distributed system in order to build confidence in the system’s capability to withstand turbulent conditions in production.”

    This definition established that it is a form of experimentation, which sits apart from testing. It also mentions “turbulent conditions in production” to highlight that this isn’t about creating chaos. Chaos engineering is about making the chaos inherent in the system visible. The point of doing chaos engineering is to build confidence.

    The principles go on to describe a basic template for experimentation, which borrows heavily from Karl Popper’s principle of falsifiability. In this regard, chaos engineering is modeled very much as a science rather than a technique.

    What Chaos Engineering Is

    The principles define the discipline so that we know when we are doing chaos engineering, how to do it and how to do it well. The more common definition for chaos engineering today is, “The facilitation of experiments to uncover systemic weaknesses.”

    The steps of Chaos Engineering experimentation are as follows:

    1. Start by defining “steady state” as some measurable output of a system that indicates normal behavior.
    2. Hypothesize that this steady state will continue in both the control group and the experimental group.
    3. Introduce variables that reflect real-world events like servers that crash, hard drives that malfunction, network connections that are severed, etc.
    4. Try to disprove the hypothesis by looking for a difference in steady state between the control group and the experimental group.

    By design, there is great latitude in how to implement these experiments.

    Experimentation Versus Testing

    Testing, strictly speaking, does not create new knowledge. Testing requires that the engineer writing the test knows specific properties about the system that they are looking for in advance. Complex systems are opaque to that type of analysis—humans are simply not capable of understanding all of the potential side effects from all of the potential interactions of parts in a complex system. This leads us to one of the key properties of a test.

    Tests make an assertion, based on existing knowledge, and then running the test collapses the valence of that assertion, usually into either true or false. Tests are statements about known properties of the system.

    Experimentation, on the other hand, creates new knowledge. Experiments propose a hypothesis, and as long as the hypothesis is not disproven, confidence grows in that hypothesis. If it is disproven, then we learn something new. This kicks off an inquiry to figure out why our hypothesis is wrong. In a complex system, the reason why something happens is often not obvious. Experimentation either builds confidence, or it teaches us new properties about our own system. It is an exploration of the unknown.

    No amount of testing in practice can equal the insight gained from experimentation, because testing requires a human to come up with the assertions ahead of time. Experimentation formally introduces a way to discover new properties. It is entirely possible to translate newly discovered properties of a system into tests after they are discovered. It also helps to encode new assumptions about a system into new hypotheses, which creates something like a “regression experiment” that explores system changes over time. Because chaos engineering was born from complex system problems, it is essential that the discipline favors experimentation over testing.

    Verification Versus Validation

    Using definitions of verification and validation inspired by operations management and logistical planning, we can say that chaos engineering is strongly biased toward the former.

    Verification

    Verification of a complex system is a process of analyzing output at a system boundary. A homeowner can verify the quality of the water (output) coming from a sink’s faucet (system boundary) by testing it for contaminants without knowing anything about how plumbing or municipal water service (system parts) functions.

    Validation

    Validation of a complex system is a process of analyzing the parts of the system and building mental models that reflect the interaction of those parts. A homeowner can validate the quality of water by inspecting all of the pipes and infrastructure (system parts) involved in capturing, cleaning, and delivering water (mental model of functional parts) to a residential area and, eventually, to the house in question.

    Both of these practices are potentially useful, and both build confidence in the output of the system. As software engineers, we often feel a compulsion to dive into code and validate that it reflects our mental model of how it should be working. Contrary to this predilection, chaos engineering strongly prefers verification over validation. chaos engineering cares whether something works, not how.

    Note that in the plumbing metaphor we could validate all of the components that go into supplying clean drinking water, and yet still end up with contaminated water for some reason we did not expect. In a complex system, there are always unpredictable interactions. But if we verify that the water is clean at the tap, then we do not necessarily have to care about how it got that way. In most business cases, the output of the system is much more important than whether or not the implementation matches our mental model. Chaos engineering cares more about the business case and output than about the implementation or mental model of interacting parts.

    What Chaos Engineering Is Not

    There are two concepts that are often confused with chaos engineering, namely breaking stuff in production and anti-fragility.

    Breaking Stuff

    Occasionally, in blog posts or conference presentations, we hear chaos engineering described as “breaking stuff in production.” While this might sound cool, it doesn’t appeal to enterprises running at scale and other complex system operators who can most benefit from the practice.

    A better characterization would be “fixing stuff in production.” Breaking stuff is easy; the difficulty lies in mitigating blast radius, thinking critically about safety, determining if something is worth fixing, deciding whether you should invest in experimenting on it—the list goes on.

    Breaking stuff could be done in countless ways, with little time invested. The larger question here is, how do we reason about things that are already broken when we don’t even know they are broken?

    “Fixing stuff in production” does a much better job of capturing the value of chaos engineering, since the point of the whole practice is to proactively improve availability and security of a complex system. Chaos engineering is the only major discipline in software that focuses solely on proactively improving safety in complex systems.

    Anti-Fragility

    People familiar with the concept of anti-fragility, introduced by Nassim Taleb, often assume that chaos engineering is essentially the software version of the same thing. Taleb argues that words like “hormesis” are insufficient to capture the ability of complex systems to adapt, and so he invented the word “anti-fragile” as a way to refer to systems that get stronger when exposed to random stress.

    An important, critical distinction between chaos engineering and anti-fragility is that chaos engineering educates human operators about the chaos already inherent in the system so that they can be a more resilient team. Anti-fragility, by contrast, adds chaos to a system in hopes that it will grow stronger in response rather than succumbing to it.

    As a framework, anti-fragility puts forth guidance at odds with the scholarship of resilience engineering, human factors and safety systems research. For example, anti-fragility proposes that the first step in improving a system’s robustness is to hunt for weaknesses and remove them. This proposal seems intuitive, but resilience engineering tells us that hunting for what goes right in safety is much more informative than investigating what goes wrong.

    The next step in anti-fragility is to add redundancy. This also seems intuitive, but adding redundancy can cause failure just as easily as it can mitigate against it, and the literature in resilience engineering is rife with examples where redundancy actually contributes to safety failures. Perhaps the most famous example is the 1986 Challenger disaster. The redundancy of O-rings was one of three reasons that NASA approved the continuation of launches, even though damage to the primary O-ring was well known internally for over fifty of the prior launch missions over the span of five years.

    There are numerous other examples of divergence between these two schools of thought. Resilience engineering is an ongoing area of research with decades of support, whereas anti-fragility is a theory that exists largely outside of academia and peer review. It is easy to imagine how the two concepts become conflated, since both deal with chaos and complex systems, but the spirit of anti-fragility does not share the empiricism and fundamental grounding of chaos engineering. For these reasons, we should consider them to be different pursuits.

    A combination of real-world experience applying the original four principled steps to experimenting on systems at scale, paired with additional thoughtful introspection, led the chaos engineering team at Netflix to push the practice further than experimentation. These insights became the “Advanced Principles,” which guide teams through the maturity of their chaos engineering programs and help set a gold standard toward which we can aspire—we’ll cover these in a follow-up post.

  • Linux Foundation Makes Available Software Manifest Tool

    Linux Foundation Makes Available Software Manifest Tool

    The Linux Foundation is making available a set of free tools for building software bills of material (SBOMs) based on the software data package exchange (SPDX) file format it curates.

    Backed by more than 20 organizations, SPDX is an effort to standardize the way metadata describing the contents of a software package is described.

    The SPDX specification was submitted last fall to the International Organization for Standardization (ISO) by the Joint Development Foundation, an arm of the Linux Foundation.

    The Linux Foundation, as part of its efforts, is also making available a free, online training course to provide IT teams with the foundational knowledge required to create and maintain SBOMs.

    Kate Stewart, vice president of dependable embedded systems for the Linux Foundation, said SBOMs play a critical, often overlooked role in maintaining the security of a software supply chain. One of the major challenges organizations have today is that an SBOM isn’t often created, which makes it harder to discover what software components have been included in a package. That makes it difficult for organizations to determine if they are employing a version of a software component that now has a critical vulnerability that was just recently reported, noted Stewart.

    Even when there is a SBOM, its construction can vary from one team or organization to the next. The tools provided by the Linux Foundation are intended to standardize how the fields used to describe a SBOM are defined, added Stewart.

    The SBOM tools being advanced by the Linux Foundation are, in part, a response to President Biden’s executive order pertaining to the security of software supply chains, added Stewart. The National Telecommunications and Information Administration (NTIA), as a result, is now asking for wide-ranging feedback to define the minimum requirements for a SBOM.

    It may take time before there is an agreed upon SBOM standard, but as microservices based on containers become more prevalent, it’s also apparent the issue will become more pressing. More, smaller packages of software being deployed in the enterprise without manifests will only further exacerbate an application security crisis that has deepened in the wake of recent high-profile software supply chain breaches.

    Ultimately, a SBOM should automatically be self-generated as part of any DevOps workflow. The challenge is there is still a massive amount of software being created outside of any formal DevOps workflow. On top of that, the massive amount of poorly documented legacy application software already deployed in an enterprise IT environment makes it clear how big an issue the lack of a simple SBOM really is.

    It’s not precisely clear who inside an organization should be responsible for standardizing SBOMs. The challenge is that within many organizations it’s not the kind of issue for which developers are rewarded, much less motivated, to solve. Nevertheless, everything from application security issues to the massive amount of technical debt that stems from duplication of software development projects can all be traced back to the lack of a simple manifest.

    Of course, now that many organizations are starting to appreciate just how dependent they are on software, more questions are being asked about how it’s constructed. The thing that many of the business executives asking those questions are about to discover (with some incredulity) is how much of the software the organizations depend on is still being built using methods that have more to do with a medieval craft than they do a manufacturing line.

  • Code Ownership Is Key to Accelerate Debugging

    Code Ownership Is Key to Accelerate Debugging

    App stability is a fundamental part of every app experience. Broadly speaking, app stability is a measurement of the number of total app sessions that are crash-free or the percentage of daily active users who do not experience an error. End users have little patience for apps that crash or fail. Every application, whether it’s B2B- or B2C-oriented, suffers some level of instability and fails occasionally. Ideally, organizations should aim for app stability scores close to 99.999%. To achieve that quality of performance, software engineers must be fast and efficient in fixing coding errors that are frequently the cause of app crashes.

    But that’s a major challenge using the traditional approach to debugging. Most major applications have a wide variety of engineers, including completely separate engineering teams, all working from a single code base. Each team typically uses their own unique issue tracker to monitor errors, such as Jira or Asana. In addition, teams typically use their own channel in a collaboration platform to communicate internally, like Slack or Microsoft Teams. This causes silos between the various engineering teams, limiting communication and visibility between each team.

    When an error occurs, all the engineering teams are alerted about the bug through their own issue trackers. From there, they figure out where the error occurred in the code and who is specifically responsible for fixing it. This requires each team to manually review code as they try to locate the bug, which wastes precious time as engineers duplicate one another’s efforts. Because teams are using different communication channels, there’s little to no collaboration or alignment between the various engineering teams during this process. Overall, this approach to debugging is a cumbersome and inefficient undertaking that slows the process of repairing apps, ultimately hurting the end user experience.

    Consider a real-world example. Suppose your team is one of a dozen engineering teams, all working together on an application that creates a mobile game. Perhaps your team works on maintaining the in-app purchases feature set, while another works on the account setup flow and yet another team works on character customization features. If a bug suddenly crashes the app for a significant portion of users (resulting in a clear drop in the app stability score), every team will receive an error alert through their issue tracker notifying them that a coding issue has caused the application to fail. No one will know if their team’s code was responsible. As a result, each team is forced to go through the laborious process outlined above. If it turns out that the bug was in the character customization code, then the teams responsible for in-app purchases and account setup have wasted valuable time and resources searching for the error.

    The only team that should be notified of a bug is the one responsible for the part of the code a bug originates from. The emerging concept of code ownership makes this possible, providing a faster and easier approach to debugging. With this method, organizations create code owner files to determine which engineers or teams are responsible for each section of code, feature flags or experiments. If section X within the code fails, then team X will be responsible for addressing it. In the example above, only the team responsible for the code associated with character customization would need to find and fix the bug.

    This makes it much easier to respond to application issues and allocate the correct resources to remedy those issues. For end users, code ownership means that malfunctioning apps will be fixed faster, improving the customer experience and boosting business metrics. From an internal POV, engineering teams become far more cost- and time-efficient, freeing developers to take on new projects they actually enjoy working on.

    A culture of code ownership also helps engineering teams adopt other best practices for debugging. One major example is error prioritization. Not all bugs cause significant app instability and need to be fixed right away. When a team can ignore errors unrelated to their code, they have more time to fully hone in on and evaluate the errors they are responsible for. With this focused approach, they can establish metrics determining if they need to fix a bug immediately or if it can wait.

    Simply put, code ownership eliminates the confusion and guesswork associated with the process of debugging, allowing engineering teams to easily identify, own, prioritize and remedy bugs. Embracing code ownership is critical for companies to improve app stability, which is the most fundamental measure of an app’s health. This ties directly into business outcomes, because app stability is closely associated with customer retention, customer growth, sales and revenue. By speeding up debugging efforts, code ownership has a pronounced, positive impact on stability, boosting each of those metrics.

  • Automatic Right-Sizing is Magical Thinking

    Automatic Right-Sizing is Magical Thinking

    Some months ago, AWS evangelist Corey Quinn wrote a short blog post titled “Right Sizing Your Instances Is Nonsense.” As usual, Corey was spot-on in his takedown of cost-reduction-magic-AI industry hype. But his piece only scratches the surface. I would take the argument a step farther and say that anyone who tells you they can automatically and generally “right-size” compute instances simply doesn’t understand how software works.

    Does that strike you as overly aggressive? Stay with me. Even if you don’t wind up agreeing, there’s a lot to be learned about AIOps from a discussion of “automatic instance right-sizing.”

    What is Right-Sizing?

    Quoting directly from the website of one of the many services that claim to provide “right-sizing” for cloud instances:

    “The Recommendations Engine leverages the time series data of relevant utilization metrics for your resources, then creates a statistical model around average and peak utilization periods. The tool leverages historical utilization data to identify performance characteristics across instance types, families and zones to provide valid recommendations for your workload.”

    The idea behind this “right-sizing” is quite simple, really: track a bunch of cloud service metrics (and maybe a bunch of OS metrics, too, if they are available), use some statistical model—commonly called “AI” on VC decks—and magically deliver recommendations for a more cost-effective cloud instance type.

    There’s just one problem: creating a useful statistical model from generic metrics is practically impossible unless your software is purpose-built to support it, and that is never a software design goal. In fact, software is almost always built in a way that is completely contrary to this goal, and for very good reasons. To understand why, let’s go over the assumptions behind “right-sizing”:

    1. The software will be able to use all given resources
    2. Performance will improve (or degrade) predictably and uniformly with added resources
    3. Metrics accurately describe application load
    4. Scaling dimensions are independent
    5. There will be no side effects on connected systems

    It turns out, none of these assumptions behind right-sizing are generally true.

    A Crash Course in Software Scaling

    In theory, software is bottlenecked on resources, be they CPU, disk, RAM, network, what have you. In practice, however, it is extremely difficult to build software that can fully utilize resources.

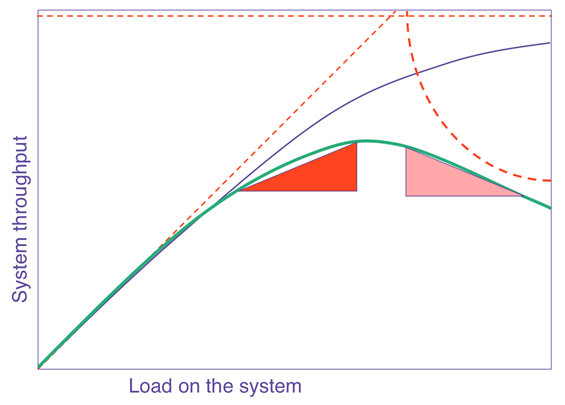
    The general curve that describes how software scales with resources or load is known as the Universal Scalability Law (USL). In a nutshell, it says that on any chart showing scale versus performance, you will see a region of linear scaling where adding resources (say, CPU cores) proportionally increases performance; however, you will then see where performance continues to increase on a nonlinear basis, with smaller and smaller gains with every additional resource until, at some point, the benefit is so marginal as to be completely negligible. This is known as Amdahl’s law, which states that the performance of every program is limited by the serial part.

    Beyond Amdahl lies the issue of retrograde scaling, the existence of which people often forget about until the consequences hit them smack in the face. In this issue, adding resources actually slows down the system. That’s right. From this point onward, larger servers will make your software slower.

    The reason this happens is that, to scale linearly, the workload and resources must be completely isolated and decoupled from each other, which isn’t realistically possible. There are always shared components, e.g. the kernel scheduler, the memory controller, the main PCI bus, perhaps the algorithm requires locking. In any case, the net result is queueing on the shared resource, which might also become a bottleneck when overloaded. Think of a supermarket checkout: you can admit more and more shoppers into the store, but they will still end up waiting at the checkout, eventually, no matter how many registers you open and staff. Performance is limited by the number of checkout counters, not by the number of shoppers or clerks. Worse yet, if the queue gets out of control (maybe people got tired of waiting and shopping carts are literally abandoned in front of remaining shoppers, blocking the path to checkout — think of this as the contention of retries and timeouts), the throughput of checkout will decrease as counters are starved for shoppers.

    right-sizing

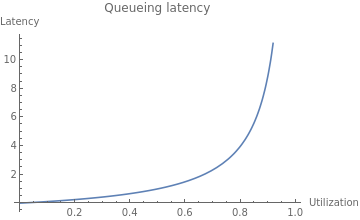
    The USL shows us what happens to throughput as we scale, but what about latency?

    right-sizing

    As resource utilization approaches 100%, the wait time for the resource will approach infinity in a nonlinear fashion. This is why systems are designed to run at low utilization, so that quality of service does not degrade too much. You might see a server running at 50% utilization and think, “We can use a server with half the resources and save money!” but if you actually try to do that, you will degrade latency and quality of service to an unacceptable level, most likely causing an outage.

    The Dark Arts of Configuration

    Even if your software is able to take advantage of available resources in theory, it needs to be properly configured to use them. Buffer sizes, thread pool sizes, memory heap size, number of connections—most software has numerous options to tune it for resources and specific workload. You can’t just change the box size and expect it to work! Not to mention, it’s quite possible your current configuration is far from optimal. I’ve substantially reduced cluster sizes on several occasions by making a one-line configuration change.

    For example, a common web server configuration is the number of concurrent requests the server can handle (often expressed as number of threads), which relates to the number of CPU cores available, the amount of memory available to the specific workload and the average time it takes to handle a request. The problem you are solving isn’t “What instance size will have the best ROI?” but rather “What combination of instance size and configuration will have the best ROI?” That is a totally different question that requires specific knowledge of the application to answer.

    Let Them Eat Cache

    In the old days, when you tried to allocate memory beyond what was currently available, the operating system would simply refuse your request. Ah, the good old days were simple! Alas, in our quest to simplify programming and resource management, and to allow software to efficiently adapt to a changing environment, we made common use of resource tradeoffs. For example, a complicated computation can be calculated again and again using the CPU, or the results can be saved and reused, saving CPU time and trading it for the use of RAM or disk. This pattern is quite common; when you overallocate memory, the operating system may trade off CPU to free memory by compressing memory objects, or it may trade off disk space by paging out RAM to swap. Java, Node.js and Go each have a similar tradeoff where they spend CPU time on garbage collecting to free RAM. Modern software makes numerous tradeoffs between CPU, RAM, disk and network in multiple dimensions. The end result is that different resources are coupled in many unexpected and obscure ways.

    Lies, Damned Lies! (And Metrics)

    Speaking of that server running at 50% CPU utilization, it is quite possible that server is also maxed out on CPU at the same time. How can this be? It’s because the metrics you see are not raw data but aggregates—in many cases, averages—and aggregates hide certain behaviors that can be very important; for example, peaks and bursts, such as the ones you get from compaction, garbage collection and other periodic processes that routinely run in modern software. There are billions of events happening every second on a modern server, and only a few data points of metrics emitted every minute. All metrics are loss-y; it’s simple math, really. But machine learning (ML) models are only as good as the data they work on, so if the metrics weren’t specifically created to show the relevant behaviors—and they weren’t—the model would be completely blind to their existence.

    What is “Performance,” Exactly?

    Whenever we deal with resource allocation, we are interested in its impact on performance, which raises the obvious yet rather uncomfortable question: what’s your definition of “performance?” Is it throughput? Latency? Mean or the 99th percentile? Of which transaction? Or, perhaps you are mostly interested in the rate of purchases executed on the website? These are all different things, and often, optimizing one might degrade the others.

    This kind of discussion is the first step in any performance engineering session—but completely absent from the scope of “right-sizing” services, and the last thing you want is the generic cost function of the ML model costing you money.

    This wouldn’t be so bad if all performance goals could be achieved at once, but, sadly, some of them are in opposition: e.g., higher throughput causes higher latency due to queueing effects. When making changes to software systems, we have to know what performance metrics are important to us.

    The Curse of Local Optimization

    It is very tempting to look at a cluster of machines as an independent system. But if that system is doing something meaningful, it is part of some bigger system, and changing the configuration will likely have an effect on the larger system it is a part of. When we make changes to subsystems, it is with the intent of improving the system as a whole, to make the customer happy and make more money. But when a change to a subsystem is motivated by a desire to reduce the cost of the subsystem, the result is often an increase in the overall cost of the system! This is because the local cost of subsystems is relatively small compared to the cost of the entire system, not to mention the possible reduction in the income of the system. For example, you could save lots of money by using older, slower servers, but your customers won’t be very happy with a slow application and your profits will suffer—which will probably cost you much more than whatever you saved.

    To take this ad absurdum, you could save 100% of the subsystem cost by turning it off completely. Of course, the assumption is that changing server sizes will not have any side effects, which, as discussed, is highly unlikely. There will be side effects on connected systems as well, some of which will not appear immediately. Load is variant, and operational overprovisioning and buffers were often put in place for a reason. It’s quite likely the reason for low utilization is safety margins.

    The Problem With “Right-Sizing”

    The basic problem with “right-sizing” is the rather obvious, yet implicit, assumption that there is such a thing as “the right” size. Software engineering is all about tradeoffs, precisely because it’s very rare (if it happens at all) that one thing can be improved without making another thing worse. Tradeoffs mean business decisions to make, and you really don’t want a generic ML heuristic to make those for you. ML is very good at dealing with problems where a lot of data is available, the data is high quality, the data is predictive of behaviors (which isn’t the case for complex systems!) and most important, the problem is well defined. Most problems in AIOps are very far from this. Don’t take it from me, take it from the people who excel at both high-scale ops and ML.

    Even if it was feasible to make such ML models work, software is unable to automatically adapt to different machine sizes and fully utilize server resources. If it were, companies like ScyllaDB and Azul Systems wouldn’t need to exist. Creating software that is scalable and resource-efficient on modern hardware is a very difficult problem, and without those building blocks, ML models are constructing very shaky structures.

    It’s worth emphasizing that I’m not arguing against adapting the size and configuration of servers, only that doing so automatically and blindly for some local “cost-saving” goal isn’t the solution you might think. The goal of such changes should be to raise the overall quality and performance of the larger system guided by a theory of how that system works. ML is not a replacement for human thought and learning. There might certainly be an “optimal” instance type, or even a few, but “optimal” implies a target metric that certainly isn’t cost reduction. No system exists for the sole purpose of being inexpensive. All systems exist to serve business requirements first, and to be low-cost second.

  • Survey Reveals Slight Decline in Level of SRE Toil

    Survey Reveals Slight Decline in Level of SRE Toil

    The amount of routine toil that site reliability engineers (SREs) perform declined slightly in the last year even though IT environments in general are becoming more complex to manage.

    An annual survey of 300 SREs conducted by Catchpoint, a provider of an IT monitoring platform, in collaboration with VMware and the DevOps Institute suggests that the amount of toil—defined as low-level manual tasks—declined 15% in the last year.

    Only 22% of respondents claim to be scientifically measuring toil, so, to a degree, the survey results are apocryphal. Overall, the survey, published this week, finds SREs are, not surprisingly, spending the bulk of their time on responding to incidents and outages, followed by participating in postmortem analysis and on-call rotations. The primary sources of toil cited in the survey are too much technical debt, lack of alignment of priorities and goals, lack of appreciation of business value, lack of training and support and lack of collaboration.

    In terms of automation adoption, the most common use cases cited are release management, infrastructure management and application management. The tools most commonly employed by SREs are used to monitor infrastructure, networks and application performance. Adoption of artificial intelligence (AI) tools to manage IT operations (AIOps) remains low. The survey also finds respondents are roughly split evenly between centralized (42%) and decentralized (38%) approaches to managing IT. Another 20% said they have adopted a hybrid approach. Lack of visibility across the stack (53%) was the most cited cloud application monitoring challenge.

    The survey also finds only half of respondents continually refine their service level objectives (SLOs).

    Leo Vasiliou, director of product marketing for Catchpoint, said it’s clear that SREs are becoming more proactive in terms of preventing and containing the impact of IT incidents. The challenge they face is lack of visibility and context as those IT environments become more complex. Complexity is increasing, in part, because of the rise of cloud-native computing platforms running microservices-based applications that have lots of dependencies.

    Less clear right now is the percentage of IT environments managed by SREs today. In theory, a single SRE can do the same amount of work as multiple IT administrators by automating processes using various DevOps tools rather than relying on traditional graphical tools. However, SREs are hard to find and retain. It’s also not always apparent to what level of automation needs to be attained to qualify to be an SRE or, for that matter, what certifications may be required. Interest in becoming an SRE is rising, in part, because they typically command higher salaries.

    In the meantime, it’s clear organizations will need to find ways to automate the management of IT to a much greater extent. Most organizations cannot afford to hire a small army of IT professionals to manage IT environments that become more complex with each passing day. Everything from DevOps best practices and next-generation observability tools that promise to provide more context to AI platforms will all be part of the mix. The challenge is finding a way to implement those tools before IT management spins further out of control.

  • Does it Matter That We’re Still Working in Silos?

    Does it Matter That We’re Still Working in Silos?

    Seventy-two percent of business leaders believe that cross-departmental working at the enterprise level benefits their employees’ experience and engagement. However, 68% of these same organizations admit to working in silos—the complete opposite of collaboration.

    So, there seems to be a conundrum. We know that working in silos is detrimental to our employees, customers and the business as a whole, yet, we’re still doing it.

    The question is: why?

    Our Protective Bubble

    To work in a silo means to build a protective bubble around you and your team, where nothing comes in and nothing goes out. It’s a zone of comfort, shielding your department from the rest of the organization.

    Siloed teams keep processes and knowledge to themselves. They work independently, for the most part, toward their own goals. By actively keeping themselves to themselves, they resist cross-functional collaboration of any type.

    As a result, those in the protective bubble are oblivious to the problems, processes, knowledge and successes outside of their immediate vicinity. Imagine what they’re missing! Someone from inside the bubble could have an idea that could solve one of an enterprise’s issues, or they may be the key to elevating an existing idea to the next level. But they’re in the bubble because they tend to feel overprotective of their work and that of their team–so forget about hearing those great insights.

    Silos Are a Hard Habit to Break

    The likelihood is that if one of the teams in your organization is working in a silo, then many others are too. And letting departments stay safe in their protective bubbles is far easier than rocking the boat and trying to change the way that several groups work.

    And once we have silos, they become part of the furniture. We build our routines and the way we work around them and suddenly they become ingrained in who we are, much like a bad habit we never intended to continue, but now cannot stop.

    This explains why we continue to work in silos despite knowing the detrimental impact they are having. A habit is hard to break. And even if we do start on the journey to change, it’s often easier to give up when the going gets tough than push through the problems. Take smoking for example; (one of the most difficult habits to break, sure, but hugely beneficial if you can do so) a 2015 survey found that only 7% of those who attempted to quit did so in six to 12 months. Changing ways of working has to be easier than that, right?

    Bursting Those Bubbles

    If staying stagnant and failing to grow or develop is more your thing, then, by all means, stay in your safe silos.

    But if becoming a more efficient, engaging, and effective business is important to you (which it should be), then you cannot expect to grow if all organizational teams are moving in different directions, not sharing their processes, ideas and insights. And much like quitting smoking cold turkey is a recipe for failure, expecting to diminish our silos in one day also is not a viable option.

    There is a solution that can incrementally burst those bubbles in a manageable and effective way: enterprise service management (ESM). Collaboration and communication are the main benefits of working in an ESM system; it provides organizations with one place for all departments to work in. Each team can set up and share processes, import knowledge and provide services through ESM.

    And by working in this unified area, departments are unconsciously collaborating. Teams can learn from each other, thanks to the universally available knowledge, and can share processes without even realizing it’s happening.

    For example, say the IT department is alerted to a printer fault in the ESM system. They first try to fix the defective item, but unfortunately, it’s not possible; they mark the printer as needing to be replaced. A notification is sent to the purchasing team asking them to buy a new printer; the order and delivery information then goes to facilities that will procure and fit the new device.

    Departments are able to keep their responsibilities and meaning, which was often their primary reason for staying siloed, while also being empowered to work better with their colleagues–and they don’t even have to lift a finger to improve the collaboration; ESM provides the space and the processes to do so.

    The Domino Effect

    The thing with ESM is, though, that we can’t just chuck all of our departments into the system at once and expect it to solve all our problems. We must implement it slowly, sometimes even one team at a time. But once we have freed one department from its protective bubble, it becomes the catalyst for something of a domino effect.

    It’s easy to work independently when everybody else is doing it, but the minute others start collaborating, it’s a different story. Imagine it’s a Friday night and you’re at home with no plans and all your friends are, too. It’s easy to be content with the situation. Now, imagine all your friends are out at a bar socializing and having fun instead, with all the pictures flooding your social media feed—the fear of missing out sets in.

    The same is true of siloed working. When we’re all in our bubbles, there is no organizational connection that we’re missing out on. But if we suddenly start to see departments collaborating and succeeding thanks to shared knowledge and processes, we want to be involved, too. And the more teams suffer from the fear of missing out, the more bubbles we’re bursting until there aren’t any more left.

    Stick or Break the Silos?

    It’s easy to unconsciously take up the habits of siloed working; after all, we thrive with our own responsibilities and a close-knit team. But it has to be a conscious decision to break down our organizational silos; it can be a long, difficult journey to do so.
    So, are you going to stick with the habit? Or find a way to collaborate and communicate better together?

  • Using Chaos Engineering to Build Resilient Systems

    Using Chaos Engineering to Build Resilient Systems

    Over the past decade, chaos engineering has become one of the most popular approaches in DevOps. It’s uniquely adapted to complex cloud-based systems and has the potential to succeed where more conventional approaches may not.

    Chaos Engineering Explained

    Traditionally, DevOps teams worked with systems hosted on single servers. They would analyze logs with a fine-toothed comb, looking for potential anomalies. They implemented automated tests to ensure the system worked to spec.  They employed root cause analysis to debug applications.

    Modern systems use cloud-based distributed architectures and are much too complex for this approach to be successful; they contain hundreds, and sometimes thousands of instances.  In many cases, their behavior can be chaotic, making it nearly impossible to predict.

    Because of this, modern systems need to be designed for resiliency from the outset. Chaos engineering was developed to foster resilient system design by deliberately anticipating failure modes.

    Two Steps to Chaos

    Here’s how it works. After characterizing a state of “health” for their system, DevOps teams perform a chaos experiment. Just like physics or chemistry experiments, chaos experiments involve setting up two versions of a system: the experimental version and the control.

    The experimental system is then subjected to a barrage of virtual kicks and punches which could range from injecting faults to disrupting a data center. DevOps teams then pore through the resulting logging data, attempting to understand how the chaos experiment affected the state of the system.

    Chaos engineering has two major differences from conventional DevOps practice. First, while conventional forms of testing supply a controlled input and test for a predefined output, chaos experiments are far more open-ended. They’re designed from the outset to expect the unexpected, requiring analysis of the whole system to give novel insights.

    Second, they are performed on live systems. This makes chaos engineering controversial, as its experiments have the potential to affect real users. Still, it makes it much more powerful than alternative approaches. Chaos engineering encourages resilient design by taking genuine risks with systems in the wild.

    Why Companies Embrace Chaos Engineering

    Chaos engineering has been around for over a decade. In that time, it’s been adopted by several of the biggest names in tech. Netflix, the company that pioneered the approach, is still the most well-known for their use of fault injection.

    In 2008, Netflix was moving from an in-house data center to the cloud. They knew that, as they expanded, their application would undergo massive horizontal scaling.  Because any one of its thousands of instances could fail at any moment, it needed to be resilient.

    They created the first chaos experiment, Chaos Monkey. This worked by randomly turning off instances in Netflix’s live application to check it was fault-tolerant. This practice sounds dangerous, but it encouraged Netflix engineers to design resilient system architectures.

    Chaos Monkey sounds bananas, but it worked. In its first five years of operation, there was only one failure which was promptly fixed by an on-call engineer. That failure was caused by Chaos Monkey itself.

    Facebook is another big company to adopt chaos engineering. They created Project Storm in the wake of 2012’s Hurricane Sandy.  Although the hurricane itself didn’t affect Facebook, it served as a wake-up call. A storm hitting one of Facebook’s data centers could wreak havoc.

    In 2014, Facebook took the step of turning off traffic to one of their data centers. Although no end users were affected, traffic loading went haywire on all sorts of different subsystems.

    Once Facebook had successfully identified this weakness in their system’s resilience, they could preemptively design traffic management software that would be resilient in the face of a live data center shutdown.

    As more and more companies use cloud computing and hyperscale data centers, chaos engineering is likely to become an essential feature of DevOps strategy.

    Applying Chaos Engineering In Your Company

    Chaos engineering is the ideal approach for complex, distributed systems. Chances are, your DevOps team either runs their application in the cloud or is planning to migrate to it.

    Serverless computing, in the guise of systems like Kubernetes and Heroku, is popular with an increasing number of organizations. Now it’s common for systems to contain hundreds or even thousands of instances, hosted in massive data centers.

    So far, we’ve only seen chaos engineering from 10,000 feet. It’s time to look at how you can make it work on the ground.

    First, we need to understand the roles observability and monitoring play in chaos engineering.  To successfully implement chaos experiments, there needs to be a high level of system visibility.

    Dealing with Data

    Marius Moscovici outlines four strategies for extracting valuable insights from data. He discusses the importance of detecting anomalies in your data stream, something a chaos engineer needs to be good at.

    Whether it’s the haywire traffic in Facebook’s Project Storm or the deactivation of Netflix instances, chaos experiments rely on the ability to diagnose unusual patterns in data.

    1. Profiling Normal System Behavior

    In order to detect anomalies, you need to have a good idea of what your system normally does. In their book on chaos engineering, Netflix used the analogy of human vital signs. Just as doctors know that 98.6°F is a normal human body temperature, their IT counterparts need to characterize a “normal” state of “health” for their DevOps system.

    Many log analysis and observability tools in the market offer machine learning capabilities to help achieve this.

    2. Detecting Anomalies Across The Board

    Anomaly detection should be integrated into every step of your data analysis. You need to be able to detect anomalies across the board, not just in places you happen to be looking at. Because chaos engineering, unlike more conventional forms of testing, is designed to reveal new and unexpected information it’s vitally important to have a completely open data strategy.

    3. Data Scientists On the Lookout

    Always be on the lookout for potentially anomalous behavior. Chaos engineering will require your company to take its DevOps strategy to a new level, both in terms of your team’s mindset and the sophistication of their logging tools.

    Because chaos engineering requires you to analyze all available data without making assumptions, it’s necessary to leverage machine learning to extract patterns from your logs.  Chaos engineering requires a scientific mindset and an appreciation of the power of data.

    4. Create Alerts

    Finally, make sure that anomalous behavior is being flagged and that the team is aware when it occurs. If possible, dynamic alerts should be used to avoid false positives and alert fatigue which is common with static thresholds.

    Engineering with Chaos

    More and more organizations are migrating to the cloud and building highly distributed application infrastructures. DevOps teams are being forced to confront chaos and complexity on a daily basis.

    While the complexity of modern IT systems has necessitated chaos engineering, it has also enabled it. In a chaotic world, chaos engineering brings the order of an engineering approach.

  • MediaOps Wins Two Gold Hermes Creative Awards for Video and Podcast

    MediaOps Wins Two Gold Hermes Creative Awards for Video and Podcast

    We are thrilled to announce that MediaOps is the recipient of two Hermes Creative Awards. TechStrong TV won the Gold Award in the video/informational category and DevOps Chats won the Gold Award for audio/podcast series.

    The Hermes Creative Awards is an international competition for creative professionals involved in the concept, writing and design of traditional and emerging media. Hermes Creative Awards recognize outstanding work in the industry while promoting the philanthropic nature of marketing and communication professionals. Hermes Creative Awards are administered by the Association of Marketing and Communication Professionals (AMCP). Judges are industry professionals who look for companies and individuals whose talent exceeds a high standard of excellence and whose work serves as a benchmark for the industry.

    Our main goal here at MediaOps is to create and produce high-quality, educational and informational content to our audience, covering IT industries and practices that are re-shaping the world of technology, including DevOps, cloud-native, cybersecurity and digital transformation. These awards are a testimony to all the hard work and dedication that goes into producing these programs. We are proud of our MediaOps team and honored to receive recognition for our work.

    The two MediaOps broadcast programs recognized by the AMCP are:

    • TechStrong TV: Gold Award winner in the video/informational category. TechStrong TV is a streamed broadcast featuring fresh video news and information three days a week and on-demand content from conferences and shows two days a week on the Digital Anarchist network. TechStrong TV features interviews with industry thought leaders, covering the latest news on DevOps, cybersecurity, cloud native and digital transformation.
    • DevOps Chats: Gold Award winner in the audio/podcast series category. DevOps Chats is a “fireside chat” podcast featuring DevOps.com and Security Boulevard Editor-in-Chief, Alan Shimel, discussing relevant topics with luminaries and thought leaders in the DevOps and security industries.

    The MediaOps team would like to thank the Hermes Creative Awards for recognizing the content we publish. Most of all, we would like to thank you, our audience, for all the support you have given us throughout the years.

    TechStrong TV is available on the web at Techstrong.tv, with on-demand segments available on DigitalAnarchist.com and the MediaOps community sites (DevOps.com, Security Boulevard, Container Journal). TechStrong TV is also available on LinkedIn Live (DevOps.com page), Facebook Live (DevOps.com page), YouTube (DevOps TV channel), on the DevOps.com mobile app for iOS and Android, and on TV via DevOps.com app for OTT channels on Apple TV, Roku and Amazon Fire TV. 

    Episodes are available after broadcast on-demand at Digital Anarchist, the next-gen streaming service for tech communities, which offers in-depth coverage on DevOps, cybersecurity, cloud-native and digital transformation, adding high-quality content on a regular basis. DevOps Chats are published on SoundCloud and iTunes, and are also available on Digital Anarchist.

  • How Real-Time Debugging Improves Reliability

    How Real-Time Debugging Improves Reliability

    When designing and building software, service reliability is always at the top of the list of critical focus areas for development teams. Every team that builds software typically has, either directly or indirectly, service level agreements with their customers. These are, essentially, agreed-upon metrics or performance criteria that teams use to measure and ensure the reliability of a software system.

    Organizations may measure reliability in different ways, looking at metrics like service availability, mean time to failure or mean time to repair. Regardless of how an organization chooses to measure reliability, you can often assess the health of an organization based on how reliable their applications are. Since we know that reliability issues happen regardless of how well we prepare for them, having tools to solve those issues quickly and efficiently becomes critical to maintaining smooth operations.

    The Health of Your Organization

    Most software development organizations today have key performance indicators (KPIs) which they measure to understand how well they’re doing and to be able to quickly and easily measure the health of their application development processes. If teams are finding that they are not meeting KPI’s, it’s often a sign that something fundamental needs to change or that new and improved processes need to be put in place. Teams that are constantly measuring what they’re doing well and where they are falling short with a data-driven approach are typically the teams that come out ahead.

    In short, a team’s ability to measure and hit KPI’s and service level agreements with their customers directly influences the overall success and health of that team. If an organization isn’t producing applications that are reliable and available when their customers need them, it’s unlikely that company will have customers for very long. When reliability issues do occur, it’s critical that developers can immediately go to the source of the issue in their code to ensure that they can solve those customer issues as quickly and efficiently as possible. One such approach is to give developers the ability to do real-time debugging directly in the environment where those issues occur, without needing to create costly reproduction environments or having to figure out how to reproduce issues locally that are, many times, data dependent.

    Reliability is Shifting Left

    Historically, software reliability has fallen on the shoulders of operations or production support teams who manage the deployments and runtime of software after it’s been deployed to production (and after developers have thrown the code over the metaphorical wall). Things have changed in the recent years, in that many of today’s development teams are responsible for their applications from development all the way through to running and supporting those applications in production. Because of this, developers have more incentive than ever to ensure that their software has reliability built in, or at least the ability to quickly debug reliability issues when things go wrong.

    Real-time debuggers are one such category of tools that development teams are choosing to package with their applications in order to solve those hard-to-address customer issues faster. Real-time debuggers are solutions which allow development teams to gather code-level debugging information such as snapshots of local variables, stack traces, tracing information and profiling data. All of this data (which traditionally relies on developers having the right logs in their code and, if not, deploying new debug builds) becomes instantly available, on-demand whenever an issue arises. This faster approach to identification of issues can drastically improve the reliability of applications by allowing developers to solve issues in a fraction of the time it would normally take.

    Teams Focusing on Reliability Move Faster

    Many development teams have shifted to an agile approach to delivering software; the goal being to respond quickly to business needs and to get new, valuable features to their customers as quickly as possible. Even though this is a helpful step, unplanned events can and will happen, which need to be planned for as much as possible ahead of time. In a recent Forbes article by Rookout CEO Shahar Fogel, he discusses how businesses should consider these software bugs as mini outages. Any time teams are dealing with software bugs or other unplanned issues, it costs the business revenue and can potentially leave customers frustrated. Focusing on metrics like mean time to repair (and giving developers the tools they need to reduce the mean time to repair) can give teams the ability to better predict how long unplanned issues will take to remediate once they occur.

    In the book Accelerate by Nicole Forsgren, Jez Humble and Gene Kim, the authors discuss the notion that, by giving developers tools to fix problems when they occur, teams create an environment where developers accept responsibility for global outcomes such as quality, stability and reliability. Investments in technology are also an investment in people. So, it’s no wonder that by investing in technologies that can help improve reliability, teams will be able to move faster. This means happier customers, happier employees and a thriving business.

    By focusing on service reliability, development teams are not only able to move more quickly, but are also directly contributing to the overall health and success of their organization. We’re seeing the onus of reliability shifted from operations teams to development teams, which adds newfound importance on ensuring development teams are building reliability into their product. Real-time debugging tools are one potential solution to ensuring that developers have the ability to quickly address unplanned customer issues which can directly impact the perceived reliability of an application.

  • The Gamification of Everything

    The Gamification of Everything

    Cross-pollination, for the non-scientific, is one of the key foundations of biodiversity on Earth. It is evolution in action—responsible for reinforcing the traits that make plants stronger and ensuring the survival of many species.

    On a far smaller scale—but equally crucial, from a business point of view—technology applications that move across industry delineation generally gets stronger. The traits that make great tech awesome in one domain combined with the unique use cases and experience of another domain result in more powerful and more flexible technology. And it’s not just a one-way street. Tech often moves back and forth across industry segments, and each time it crosses the line, its DNA improves. That means that, ultimately, the original domain tends to be strengthened by cross-pollination, too.

    This is exactly what’s happened with gaming development technology in recent years. And I’m not just talking about best practices. I’m talking about actual purpose-built gaming development technology that’s spread across and penetrated into industries like automotive, e-commerce, entertainment, architecture, real estate and more.

    This cross-pollination has left top-tier gaming tech players like Epic’s Unreal and Unity in a vastly superior position. In fact, it seems that cross-pollination is becoming an integral part of the growth strategy for these and other gaming tech companies. They’re not only betting their tools will shape the next generation of user experience in multiple industries–they’re also making strategic acquisitions that will make this happen.

    What Does Cross-Pollination Look Like?

    Cross-pollination of gaming tech takes a number of forms–some quite overt, others more subtle. For example:

    • The gamification of mobility–Gaming tech is bringing a new level of interactivity and visualization to the automotive industry. For visualizing self-driving, safety testing, visualizing automotive components, creating online showroom visualizations of vehicle interiors and more–gaming tech is deeply integrated into automotive development, manufacturing and retail.
    • The gamification of entertainment–Game development tools are revolutionizing the way entertainment companies develop content. From scene development based on a gaming methodology and gaming engines, to an entire popular series shot in one location using Unreal–gaming tech has radically changed the scene and series development pipeline.
    • The gamification of business software–The gamification of business software is streamlining processes, training and workflows. From companies like Invrsion, which offers game-like virtual reality tools for retail, to Salesforce, which adopted a game motif for key training—business functionality augmented by gaming tech and gaming user experience enhancements are becoming standard.
    • The gamification of education–Learners learn best when they’re having fun–and also when they have goals, targets and achievements to reach for. Sites like Khan Academy and apps like Duolingo have brought gaming tech and methodologies into the virtual classroom, changing paradigms for educators and learners alike.
    • The gamification of everything else–Shopping for clothes online during lockdown? The functionality that lets you “try on” garments is based on gaming tech. Designing a new pharmaceutical molecule using VR augmentation? Gaming tech. Urban design? Yep—gaming tech. And the list goes on.

    Why Gaming? A Unique Technology Incubator

    The question that companies in any industry should be asking is: why is gaming able to create such powerful, flexible and inspiring tech that lends itself so well to cross-pollination?

    The answer is multifaceted. First off, gamers are out-of-the-box thinkers, to say the least, and game developers–well, they broke the box before the gamers even got there. Gaming tech was born in a development environment on steroids—tight schedules, computing intensive processing, insane competition and frequent release cycles. This makes for a space that’s both receptive to new tech and open to new ways of doing things.

    Secondly, gaming is a ridiculously dynamic industry that is undergoing incredible growth, and the pandemic has only accelerated this trend. More money coming in translates to more investment in developing, improving or acquiring tech, as well as to launching more and more new games.

    Finally, in the gaming world, human resources cross-pollination is built in. Game developers move between studios all the time. This spreads tech advancements like–pardon the sensitive reference–a virus. Because if something worked well for you in one job, you’re going to want to use it in your next position.

    The Takeaway

    In both the natural and business worlds, cross-pollination is necessary for survival. Gaming tech is leaking into other industries for one key reason: it is frequently superior. And this cross-pollination of gaming tech benefits both the industries that adopt it and the gaming industry itself.