Category: Application Performance Management/Monitoring

  • Datadog Unfurls Application Security Service

    Datadog Unfurls Application Security Service

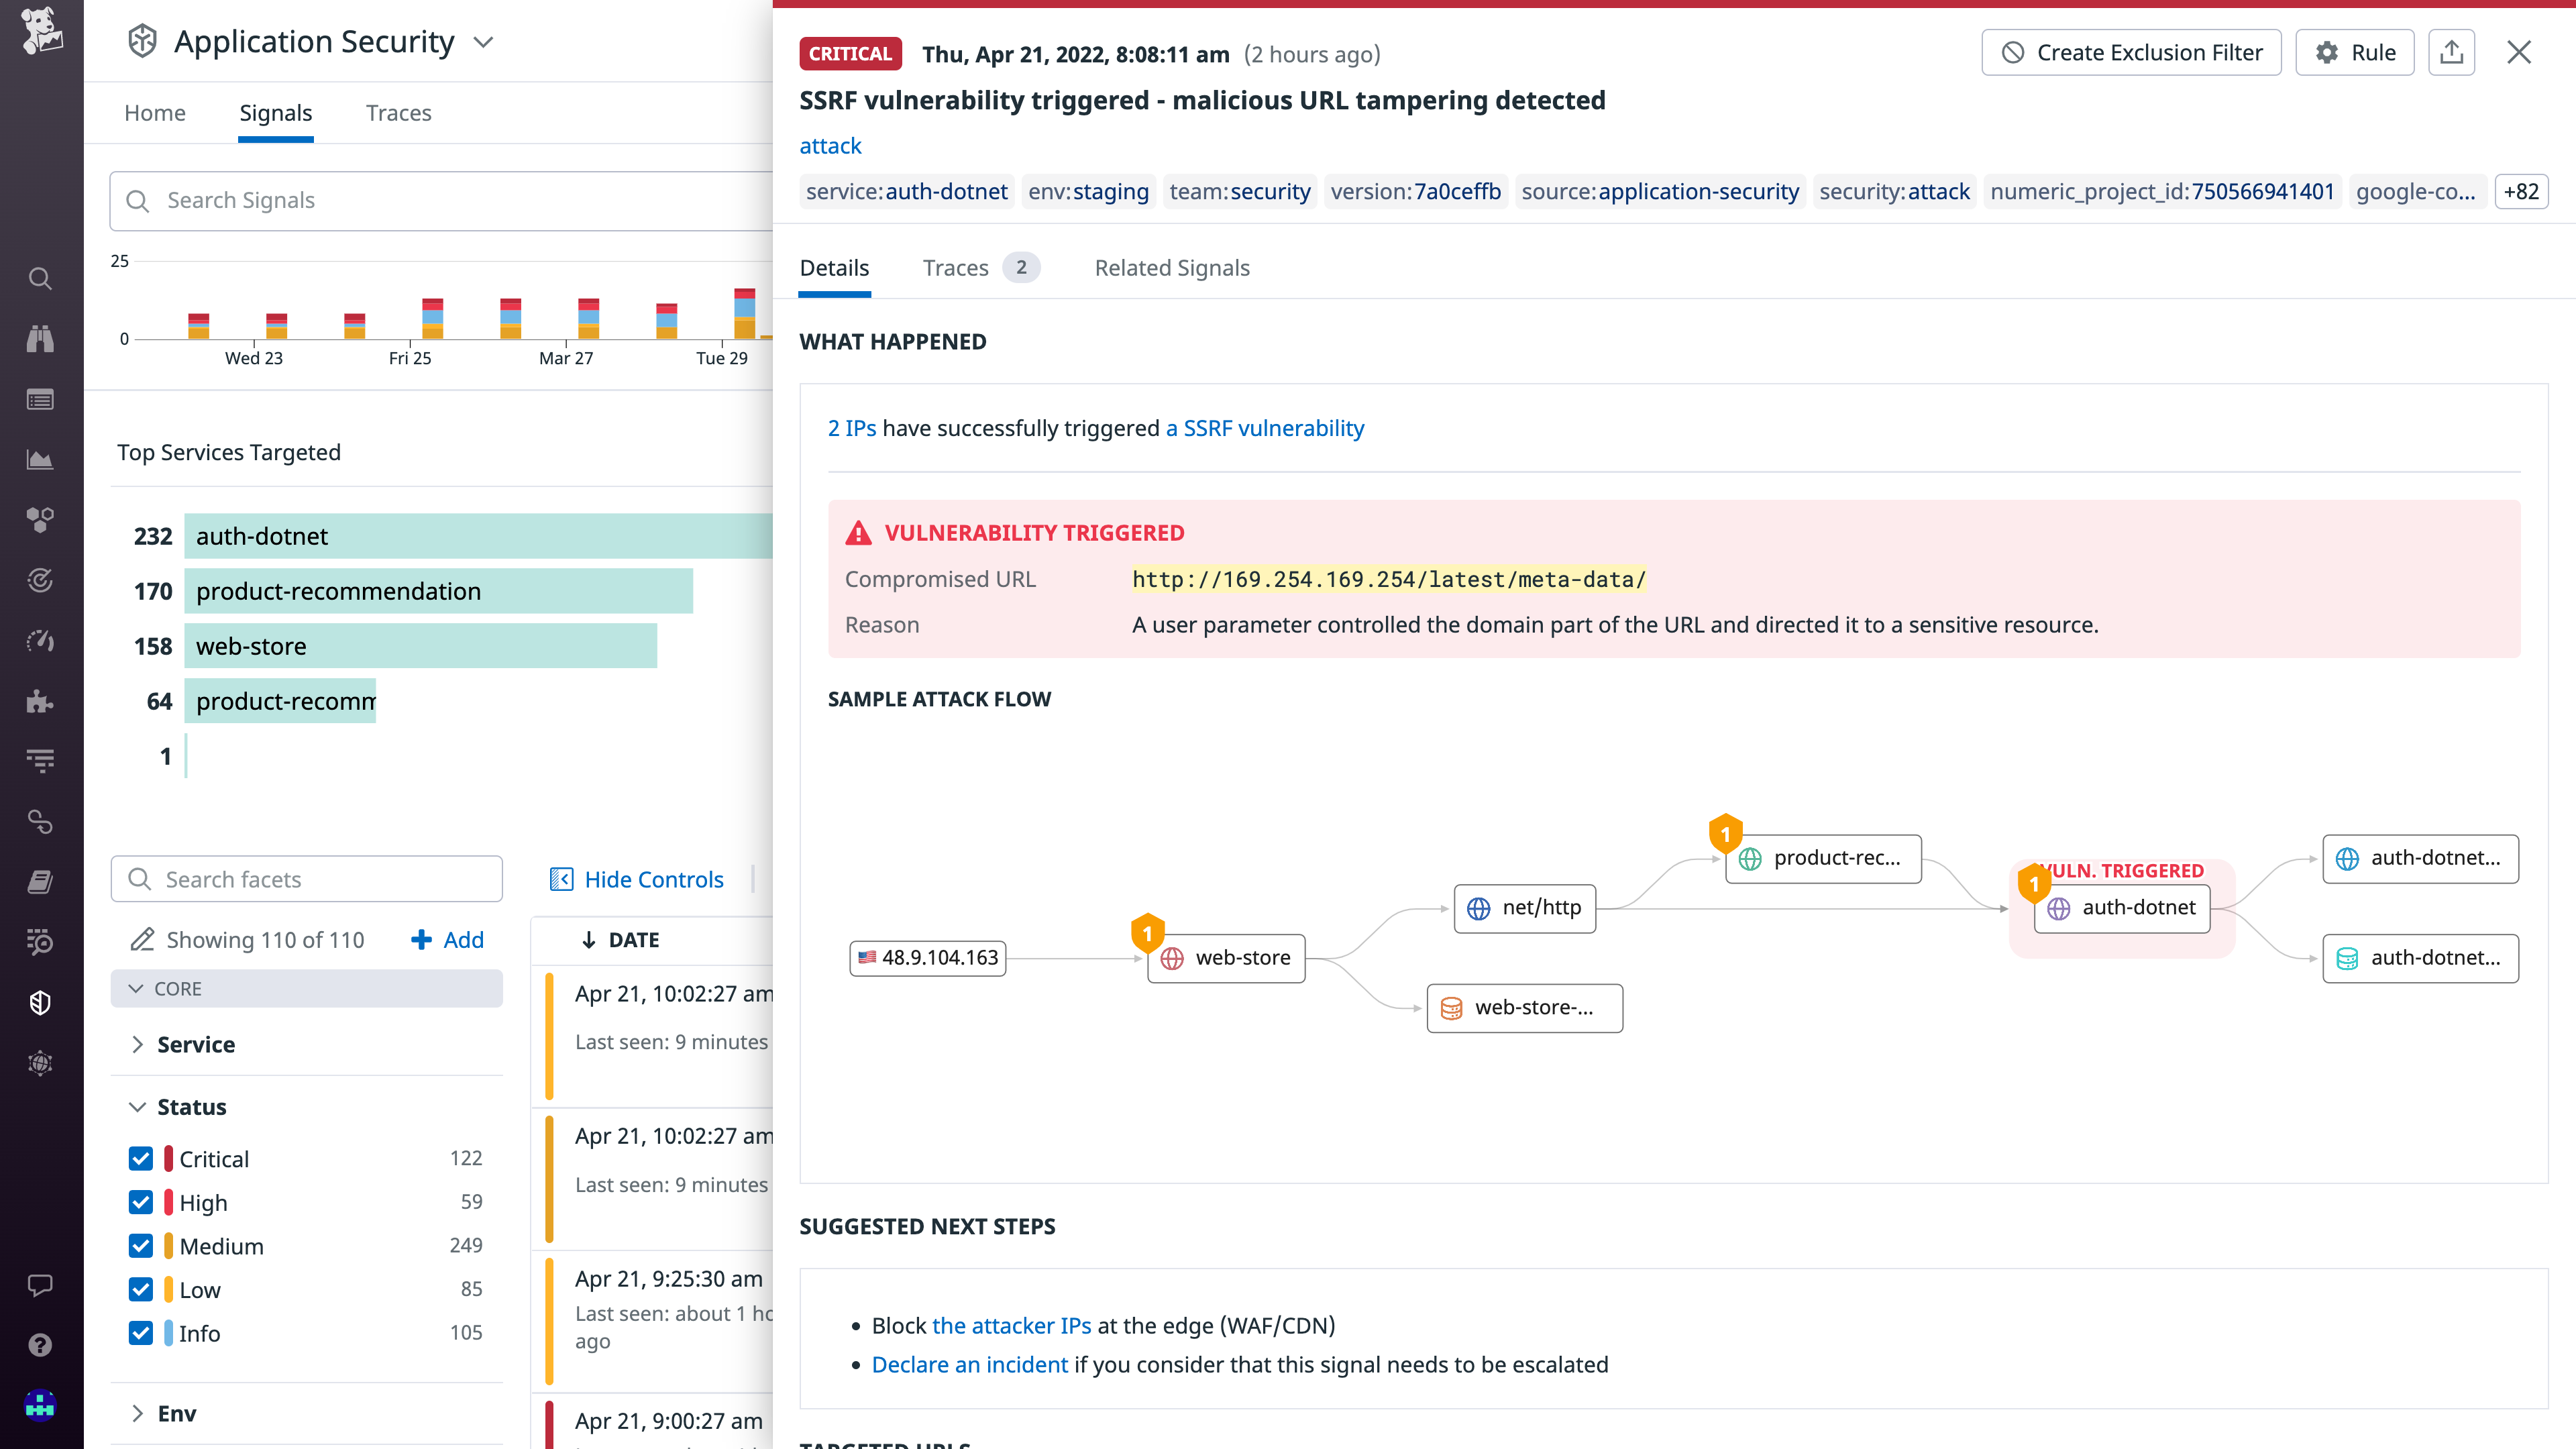
    Datadog, Inc. today made generally available an Application Security Monitoring (ASM) service that is based on the same agent software that many DevOps teams already use to monitor applications.

    Pierre Betouin, vice president of product for the cloud security platform at Datadog, said ASM is designed to make it simpler for DevOps teams to add additional DevSecOps best practices to their existing workflows. The ASM service is based on a runtime application self-protection (RASP) engine and web application firewall that Datadog gained with the acquisition of Sqreen a year ago.

    ASM then employs distributed tracing to discover code-level vulnerabilities such as server-side-request forgeries (SSRFs), SQL injection and cross-site scripting (XSS) flaws. It is designed to extend an existing Datadog Cloud Security Platform that includes cloud security posture management (CSPM), cloud workload security (CWS) and cloud SIEM services.

    The overall goal is to make it simpler for DevOps teams to address application security by eliminating the need to deploy and maintain a separate set of agents within applications, said Betouin. That approach reduces resistance among DevOps teams that would otherwise be concerned about the additional overhead another approach to application security would add to an application environment, he added.

    The number of organizations looking to implement DevSecOps best practices is expected to increase in the weeks and months ahead in the wake of a series of high-profile breaches and zero-day vulnerability disclosures. Many organizations are now performing security reviews across their entire software supply chain as part of an effort to discover any malicious malware that might have been inserted into applications.

    The challenge those organizations face is that as application environments become more dynamic, maintaining application security becomes more difficult as code is continuously updated. The best way to address that engineering challenge is to extend the reach of an observability platform that many DevOps teams already have in place, noted Betouin. Ultimately, the goal is to automate application security as much as possible but that’s not going to be achievable if DevOps teams lack the context required, he added.

    It’s not clear at what rate organizations are embracing DevSecOps best practices. However, it’s clear that DevOps teams are being held more accountable for application security. Most developers are now charged with becoming application security experts overnight, so the only way to effectively ensure application security is to uncover security flaws before applications are deployed in production environments.

    There are, of course, multiple ways of achieving that goal. Datadog is betting that the path of least resistance is via a cloud service that connects to agent software inserted within those applications. DevOps teams have been inserting agent software, in one form or another, into those applications for years. The issue is that with each new agent added there is yet another software component that needs to be deployed and regularly updated. If not carefully tracked, a DevOps team could find itself attempting to manage an entire portfolio of agent software for every platform employed.

  • Riverbed Unveils Unified Observability Platform

    Riverbed Unveils Unified Observability Platform

    Riverbed today launched a beta of a unified observability platform it will make available under the Alluvio by Riverbed brand name.

    Jim Hansen, senior vice president for product management at Riverbed, said the Alluvio by Riverbed observability platform combines several existing network and application performance management platforms into a single offering that is now infused with machine learning algorithms to provide deeper insights into IT environments.

    The goal is to provide an open observability platform that can not only aggregate data collected from both Riverbed and third-party offerings but also identify the best ways to resolve an IT issue, added Hansen.

    Scheduled to be generally available later this year, the Alluvio by Riverbed observability platform will differ from existing observability platforms in that it will enable IT teams to not just identify the root cause of an IT issue, but also note which processes should be employed to resolve it, he said.

    With this launch, Riverbed is attempting to reposition itself. Previously, the company offered network and application performance management platforms alongside a wide range of network software and hardware. Each of those offerings is now a source of data that can be fed into the Alluvio by Riverbed observability platform, noted Hansen.

    Observability, of course, has always been a core tenet of any DevOps best practice. Achieving that goal, however, has proven to be elusive. Most of the IT monitoring tools used today are designed to track a set of pre-defined metrics. Whenever there is an issue, IT teams typically convene in a war room where they try to uncover the root cause of, for example, a performance issue by comparing reports and the various dashboards generated by monitoring tools. It can take weeks to discover an issue that often only takes a few minutes to fix once the source of the problem is identified.

    In contrast, observability platforms promise to reduce the time required to discover IT issues by aggregating all the data generated by the IT environment within a single platform that correlates events and makes it easier to identify anomalous behavior. Armed with those insights, it becomes a lot simpler for IT teams to launch queries that enable them to resolve issues faster.

    Those insights are also increasingly being used to drive business decisions as organizations become more dependent on software to drive digital business transformation initiatives. However, a recent survey conducted by Riverbed finds three-quarters of business decision-makers (75%) said their organizations struggle to glean actionable insights from data generated by their technology infrastructure.

    The challenge IT teams inevitably encounter is they don’t always know the right questions to ask, which is an issue that can be addressed by machine learning algorithms capable of identifying anomalies indicative of an IT issue that needs to be resolved.

    There already is no shortage of observability platforms. The issue now is determining which observability platform to employ across a distributed IT environment that is becoming more instrumented with each passing day.

  • What’s the Difference Between SLI, SLA and SLO?

    What’s the Difference Between SLI, SLA and SLO?

    If you’re just getting into site reliability engineering (SRE) or platform engineering, you’ve probably come across a bunch of new terminologies, like SLI, SLA and SLO. These benchmarks are commonly referenced in the day-to-day life of an SRE but may seem foreign to outsiders. So, what are the differences between these abbreviations?

    Well, one of the hallmarks of the SRE approach is to gauge performance and set targets for application metrics. These targets can be thought of as reliability thresholds. If a site’s latency reaches a certain point, for example, it may break the agreement the software provider has with its consumer.

    SREs create and monitor service-level performance benchmarks for all sorts of metrics, such as uptime, latency, error count, mean-time-to-recovery and throughput, among others. But not all these performance goals are part of public agreements. Companies usually take a more proactive approach to setting more internal targets to stay far away from breaking external agreements and user trust. It’s become a best practice to set these baselines to retain functional, reliable systems.

    As mentioned, the type of targets range from firm partner commitments to more internal goals. Below, we’ll attempt to define, in simple terms, the differences between service-level agreement (SLA), service-level objective (SLO) and service-level indicator (SLI). While these concepts share many similarities, it’s important to understand how they are applied in practice. Keep in mind that each company may have a nuanced understanding of these terms and may conceive and apply them differently.

    Service-Level Indicator (SLI)

    First off, service-level indicators (SLIs) refer to the actual metrics produced by software services. This is a direct measurement of a service’s behavior. These are the real numbers that indicate overall performances, such as error rate and latency over time.

    One example of SLI would be the number of successful requests out of total requests over a one-month period. Say an engineer used an application monitoring tool that ingests data from production logs. This data showed that out of one million requests made, ten requests failed. An SLI for availability would thus be 99.999% uptime.

    Service-Level Agreement (SLA)

    Second, most technologists are familiar with service-level agreements (SLAs). Even if you’re not, you’ve likely agreed to many throughout your history as a digital user. SLAs are like a pact between the software provider and the software user or client. These binding commitments often note availability expectations that must be upheld. SLAs may also include responsiveness to incidents and bugs. It depends on the contract, but if an SLA is broken, some kind of penalty may be incurred such as a refund or a service subscription credit.

    These days, the average business relies on many cloud-based SaaS, PaaS and IaaS. Just to initiate something as simple as an online payment might require hitting multiple remote servers. But if all these services just went offline whenever they felt like it, our digital operations would come to a grinding halt. SLAs are thus necessary for enterprise software contractual agreements to ensure both parties meet specific standards.

    Once an engineer tracks SLIs and has an idea of typical behavior, they can then set an SLA that makes sense. If we take the example above, an SRE may consider guaranteeing a lower threshold than what is being actively monitored. This would ensure that application performance, at its current pace, doesn’t break any legal or contractual obligations. In this scenario, perhaps the SLA mentions an availability objective: No more than 100 requests fail per one million requests made. This would essentially equate to 99.99% uptime.

    Service-Level Objective (SLO)

    Lastly, service-level objectives (SLOs) are similar to SLAs but explicitly refer to the performance or reliability targets. An SLA may refer to specific SLOs. Or SLOs may be tracked just for internal purposes. As Google described, “the availability SLO in the SLA is normally a looser objective than the internal availability SLO.”

    You don’t want the end users to be the first people clamoring about a 400%+ latency rise in your mobile web apps. Thus, SRE teams typically keep a close eye on performance to ensure they never even get close to breaking SLAs. Some do this by setting and monitoring internal baselines that are more ambitious than the SLA threshold.

    If we take our example above, if an SLA guarantees a service uptime of 99.99%, the business may set an internal target of 99.995%. In other words, for every one million requests, no more than 50 should fail. If software systems aren’t hitting these marks, it’s a sign that the company must reevaluate designs and search for bottlenecks. Or, perhaps engineering teams have goals to improve the average downtime for the next quarter—an internal objective could be set at a higher standard than the currently perceived performance.

    As the Google Cloud blog described, “every service should have an availability SLO—without it, your team and your stakeholders cannot make principled judgments.” It’s a good reminder to be modest in your reliability commitments, they added, as consumers will come to expect this level of performance. On the other hand, setting more ambitious internal performance targets has the benefit of delivering a better result than the agreement on paper, increasing a software service’s competitiveness.

    Real-World Performance Benchmarks

    Keep in mind that the above numbers are simply for demonstration purposes. One interesting resource for real-world figures is API.Expert, a service that queries popular APIs and posts weekly performance statistics. Since APIs are the heart of many UI-based platforms (and our digital economy at large), these benchmarks stand as a good indicator of average uptimes and latencies in the industry.

    For example, at the time of writing, API.Expert’s Enterprise APIs collection ranked Microsoft Office365 and Pivotal Tracker at the top, both with a 100.00% pass rate and a 220 ms and 248 ms latency, respectively. On the other end of the spectrum, Docusign is at 99.93% with an 877 ms latency and Box is at 99.99% with 414 ms latency.

    SLIs, SLAs and SLOs—Oh My!

    Although it may sound good to an unpracticed ear, an SLA of 99.99% still equates to 52 minutes and 36 seconds of downtime per year. That’s nearly an hour of downtime in which customers are left scratching their heads or, worse, searching for other options. For traumatic health care situations, a loss of connectivity could be a matter of life and death.

    Although creating SLAs and SLOs is important to gauge system health, the reality is that it can be challenging to track and enforce them. “These agreements—generally written by people who aren’t in the tech trenches themselves—often make promises that are difficult for teams to measure,” according to the Atlassian knowledge center.

    In summary, SLIs demonstrate the real behavior of software systems. These metrics inform the creation of SLAs, which must be met to ensure B2B agreements. These SLAs often reference particular service-level objectives (SLOs) that must be met, which usually give more breathing room around SLIs. Lastly, in a digital economy with accelerating digital expectations, it makes sense to monitor internal SLOs and improve baselines over time.

  • How Engineers Can Contribute to API Security

    How Engineers Can Contribute to API Security

    I’m an engineer, not a security professional. I’ve worked at several startups over the years and have discovered ways to shift my engineering mindset to include a security focus and to incorporate security into my coding practice. 

    I’ve found that when you work with others, an engineering organization can significantly contribute to API security. But how we think about software makes it difficult to get started. There is an alternative perspective—a road not taken—that must be considered when it comes to securing endpoints from threat actors. 

    The Road Not Taken

    Engineers create and optimize applications to solve problems for real users. Engineering time is often in short supply, so we optimize the speed at which we can write those applications. To speed up our processes, we simplify problems and find reusable patterns or techniques. Add a bit of glue, and you have software.

    This perspective is constructive. Thoughts come first and software comes next. And when refactoring existing code for software, we need to think this way. But this utility comes at a cost: If the software works, we only see what it should do. The real story behind the scenes can be much more complex.

    A few years ago, I worked with an engineer on new endpoints for an authorization API. We were working out an issue in the implementation where I could call the endpoints out of order and bypass a challenge. We worked through the example, and he said, “But they are supposed to be called in 1-2-3 order.”

    Attackers don’t share this perspective. Instead, they want to manipulate the software to act in their own interests. They ask, “What is possible?” instead of “What is it supposed to do?” and find ways in which the system fails. To an attacker, the glue is more interesting than the design.

    While probing, an attacker may be thinking some of the following questions: 

    “The password reset endpoint is on v2? Is v1 still running?” 

    “What happens if I skip the verify endpoint?” 

    “What happens when I pass null in the challenge? Empty string? SQL injection?”

    As creators, we’ve converged on this constructive perspective. To build secure software, we need to consider the road not taken and incorporate greater security into our applications.

    Playing Defense

    When you are defending software, your limited time is a disadvantage. There are many engineers—and some have been writing software for many years—which means that you have a lot of code to defend. Each application depends on hundreds or thousands of open source projects, from libraries to deployment tools to server operating systems. 

    Security tools can help you think from both perspectives, especially those that automatically discover endpoints and track response statistics. You can use this data to understand how code maps to your public API surface. 

    In addition to tools, here are several suggestions for on the ground techniques that you could try out.

    Read the Code

    Pick an application, find out where the authentication and authorization code is and read it. Even if you aren’t a strong coder, you can learn something interesting. Better yet, try and take the attacker’s perspective and look for ways you can exploit the code and make it work for you. For instance, you may see the following:

    “SQL injection might be possible in this area. I might be able to extract information about other accounts.”

    “Authorization is complex and confusing in this area. I might be able to use my standard user account to execute actions on other accounts.”

    “Logging is very weak in this sensitive area. I might be able to hammer this endpoint without being noticed.”

    “Code or comments indicate the developer assumes the application is secure for a particular reason. Can I break those assumptions with an external request?”

    The knowledge gained in performing an exercise like this is priceless. You can use it to guide the rest of your API/AppSec work (pentesting, scan remediation, etc.). Further, you’ll often find logical vulnerabilities that scans couldn’t detect.

    Read Code Reviews

    Engineers make decisions in pull requests (PRs). Content in past PRs and review comments have tons of context and can be used to help inform your decision-making. Look through the history, then think through some security-focused review questions:

    “If the code tries to enforce security constraints, can I think of a way around them?”

    “Are there obvious security mechanisms that should be part of this change but are missing?”

    “Would unusual attacker behavior appear in logs?”

    Examining these reviews and understanding the broader context can provide you with valuable information. You might find a sensitive action without any authorization logic, ways a user account can access data owned by other users, or a path through the password reset flow without a valid challenge token.

    Work With Engineers

    If your engineers are working on security-relevant code, ask for some time to talk. Find out what they are working on (and why). Help them think like an attacker, and explain some of the techniques an attacker might use to break their app. And remember to take the road not taken while you work to ensure the security of your applications. 

  • How DevSecOps Teams Can Level Up

    How DevSecOps Teams Can Level Up

    In 2019, I wrote a post detailing the traits of DevSecOps—the practice can be defined as the process of security automation in which IT and security are more de-siloed. DevSecOps introduces a more intentional culture wherein security-by-design principles are baked into the software development process early on. All in all, the aim is to have security enable development, not stall IT and slow down the SDLC.

    So, years later, how is DevSecOps doing? Has it achieved this ideal? Well, I recently met with Jeff Williams, CTO and co-founder of Contrast Security, for insights into the state of modern DevSecOps. According to Williams, most large companies still have real problems with application security and software dependency providence is constantly in question. We’ve recently seen this reality rear its ugly head amid exploits in frameworks like Log4j and Spring4Shell.

    Large organizations are likely carrying tens of thousands of vulnerabilities in their backlog. Yet, as consumers, we happily trust software for our critical applications without knowing what lurks behind it. “The industry has a real transparency problem,” said Williams. And as applications are getting more interconnected, they are getting more complicated and they’re getting more critical, Williams added. “These three Cs—connected, complicated and critical—make security harder.” These conditions are culminating in what he called “a perfect storm.”

    6 Ways DevSecOps Teams Should Respond

    So, how should DevSecOps teams respond to the seemingly endless barrage of new vulnerabilities and attacks? Williams shared some general ways teams can increase their security posture.

    1. Practice Security in Sunshine

    It’s easy to point fingers when something goes wrong, especially if it’s a serious vulnerability or attack. Instead, Williams encouraged teams to practice what he calls “security in sunshine.” This is an attitude that gives more transparency to security issues internally. Embracing a culture of blameless retrospectives can ensure employees are comfortable bringing up issues within their team.

    Security in sunshine can be adopted in an external-facing way as well. Williams likened it to how, in product manufacturing, it’s standard practice to share a bill of materials (BOM) with trade partners. We may see similar labeling standards emerge for software in the form of software bills of materials (SBOMs) so that external consumers are better aware of dependencies and potential threats, Williams suggested.

    Cybersecurity awareness certainly takes a communal effort that requires transparent communication. We see this realized daily in bug bounty programs, CVE reports and fixes to open source software. Bringing potential threats into the light of day is necessary to squash vulnerabilities before they are exploited.

    2. Translate High-level Requirements

    Security guidelines issued by bodies such as NIST and ISO are essential to keep in mind. Implementing the concepts these guidelines recommend, such as the principle of least privilege, multifactor authentication and zero-trust architecture, are considered best practices by most security professionals. However, these high-level requirements don’t often translate down to the developer on the ground floor. “The developer needs those requirements translated down four levels to specific technologies they’re working with,” said Williams.

    A programmer needs more realistic advice on how these guidelines affect, say, Spring Boot applications or how they should configure permissions in AWS. According to Williams, teams must interpret these abstract recommendations with more concrete annotations that meet the nuances of the technology stack they’re working in. The same process is required to help developers create projects compliant with data regulations, as it’s difficult to take this high-level advice into practice. Translating these requirements into more readable terms is an excellent way to de-silo security and development teams.

    3. Shift Smart

    In recent years, there’s been a lot of talk about shift left. The idea is that to reduce security threats later on, organizations need a tighter grasp on security earlier in the software development life cycle. Shifting security left is often enabled with tools that hold code accountable for potential threats using automated analysis.

    However, Williams sees this as an area where organizations need to be careful. Not all security tools are developer-friendly and might introduce inefficiencies at scale. Instead of shifting left, he advocates for “shifting smart” to introduce security at junctures where it’s most efficient. “You don’t want to shift all security left—you want to shift right too,” explained Williams. “Spread it out over the whole life cycle.”

    4. Avoid Added Steps

    There’s more than one way to bake a cake. Similarly, there’s more than one way to cook up a great software application. As such, most organizations are dealing with multiple tools, making it harder to apply security consistently across all stacks.

    Security should be catered to the specific tooling and processes being used, Williams explained. But that requires answer certain questions like where is a software development team in their journey? Are they waterfall or Agile? How does each CI/CD pipeline behave?

    Obviously, there are many unique factors to consider. Ideally, tooling should be flexible enough to attach itself to existing infrastructure, Williams said, instead of adding additional steps to an already sprawling tooling ecosystem.

    5. Take Security Seriously

    And, of course, there’s the cultural element. “It’s 2022, and companies still don’t take security seriously—they need to change,” said Williams. “It doesn’t matter how they get there—that they get there matters most.”

    Admittedly, cultural change is a slow evolution and the best way to advance will be to add practices and technologies progressively over time. Thus, Williams recommended iteratively inserting pieces, measuring outcomes and proving value along each step of the journey.

    6. Update Outdated Tools

    WhiteHat Security found the average time it took to fix critical vulnerabilities in the spring of 2021 was 205 days. But such a long timeline is at odds with the pace of new threats and the need to patch them quickly.

    The industry is changing the way they do AppSec, said Williams. Traditional DevSecOps security tools, he said, such as static analysis tools, dynamic analysis tools and web application firewalls, are outdated and less accurate compared to newer technologies like interactive application security testing (IAST) and runtime application self protection (RASP). Accuracy, speed and scalability will be important characteristics for security automation tools that don’t require additional human intervention or produce too many false positives.

    DevSecOps Is Still Maturing

    A healthier DevSecOps practice aims to decrease the “vulnerability escape rate,” as Williams called it. Hopefully, by providing instant feedback on designs, engineers will learn not to repeat the same mistakes, thus decreasing the number of vulnerabilities they introduce.

    In summary, DevSecOps is still maturing. Looking to the future, a stronger DevSecOps approach will require a more open attitude to mitigate threats. It also requires practical guidance as not all top-down guidelines translate well into the active development environment. Applications will require proper code hygiene, and the software supply chain itself must be protected, too, in addition to conducting active monitoring of production environments.

  • Survey Shows Shift to SRE Principles to Automate IT Management

    Survey Shows Shift to SRE Principles to Automate IT Management

    A global survey of 1,500 IT decision-makers conducted by F5 found that, on average, organizations are managing more than 200 applications deployed across an extended enterprise as well as more than 20 different security and delivery technologies.

    Lori MacVittie, principal technical evangelist in the Office of the CTO for F5, said that level of complexity makes it apparent that IT teams will need to embrace higher levels of automation to manage the IT environments that are now at the core of a wide range of digital business transformation initiatives. The survey revealed that more than three-quarters of respondents (77%) were embracing site reliability engineering (SRE) principles to automate the management of IT.

    A full 95% of respondents also planned to mine operational data for insights they could use to improve the customer experience and drive business growth. However, 98% of respondents also said they are currently unable to extract those needed insights from their existing systems. A total of 90% said they planned to implement some form of artificial intelligence (AI) to achieve that goal. More than two-thirds of respondents said their organizations realized that creating superior digital interactions for customers will require modernizing business processes and back-office functions.

    As part of those efforts, the survey suggested that application workloads are being shifted across highly distributed computing environments. In addition to the 84% of respondents that are planning to move workloads to the edge, the survey found two-thirds of organizations (67%) are currently or planning to repatriate applications from the cloud to a data center environment in the next 12 months. A total of 93% of respondents reported using some type of as-a-service offering delivered via the cloud today.

    Naturally, securing that many platforms also represents a major challenge. However, despite inherent risks, more than three-quarters (76%) of respondents said, given the choice, they’d turn off security measures to improve performance. That lack of willingness to sacrifice performance suggests that attitudes to security may not have changed much despite all the breaches that now regularly occur, said MacVittie.

    It’s not clear to what degree managing enterprise IT environments has become untenable; however, it’s clear that legacy manual processes will need to become automated. Organizations can’t afford to keep hiring IT staff to manage IT platforms that span everything from the network edge to public clouds. In fact, the survey makes clear that DevOps practices—in the form of the SRE principles first defined by Google—are gaining traction. That doesn’t necessarily mean everyone managing IT is becoming an SRE or an engineer, but it does suggest that automation frameworks are being more widely used.

    It may be a while before those automation frameworks are ubiquitous. However, one way or another, many of the tasks that have historically conspired to make working in IT tedious are going to disappear. The issue, of course, is to not wind up with islands of disconnected automation that introduce more complexity.

  • Atlassian Expands DevOps Tools Portfolio to Improve Collaboration

    Atlassian Expands DevOps Tools Portfolio to Improve Collaboration

    Atlassian has added an extensible catalog for tracking software components, dubbed Compass, to its portfolio of DevOps tools along with an Atlassian Data Lake and Atlassian Analytics cloud service that makes it simpler to aggregate and query data collected from the company’s portfolio of tools.

    In addition, Atlassian is making its Atlas collaboration framework—formerly known as Team Central—formally available in beta. That framework, in effect, provides an overlay through which different collaboration tools adopted by various DevOps teams can be more easily integrated.

    Compass provides DevOps teams with the ability to map all the components they use to assemble their software as well as the teams that own them. DevOps teams can access shared components and documentation along with scorecards to allow them to measure and evaluate their architecture based on the baselines, security or compliance requirements they might be required to meet. It can be extended to other applications via an integrated Apps engine using Forge, the existing Atlassian cloud development environment.

    Tiffany To, head of product for Agile and DevOps at Atlassian, said Compass is designed for DevOps teams that are typically trying to manage 50 or more microservices. It is designed to be deployed alongside the Jira project management software that is widely used by software development teams to manage multiple projects.

    Atlassian Analytics, meanwhile, is based on a visualization and analytics platform the company gained last year with the acquisition of Chartio. Initially, the Atlassian Data Lake will include data from Jira Software and Jira Service Management tools with support for additional Atlassian platforms planned.

    Collectively, these tools are part of an ongoing Atlassian effort to make it simpler to integrate multiple DevOps teams, said To. Many of those teams prefer to maintain autonomy over the tools they select. The challenge that creates is organizations need some type of overlay through which they can collaborate and share best practices, she said.

    A survey of 2,000 developers conducted by Atlassian found half of the respondents exercise strong autonomy over the tools they use, with more control over tool selection gained as developers become more experienced. The same survey also found that 65% of developers felt they should be responsible for more of the software product life cycle than they currently are.

    It’s apparent that most organizations building software are trying to strike a balance between developer autonomy and centralized control. Developers are expensive to hire and retain, so there is a natural tendency to make available the tools they prefer. That, however, can lead to a level of tool sprawl that makes it difficult to determine the overall state of application development and deployment within an organization.

    Regardless of the approach, the need to remove as much friction as possible from DevOps workflows is clear, especially as the number of simultaneous application development projects continues to multiply. The challenge and the opportunity, of course, is achieving that goal while keeping developers happy.

  • Survey Shows Increased Focus on Modernizing IT, Retiring Apps

    Survey Shows Increased Focus on Modernizing IT, Retiring Apps

    A survey of 140 enterprise architects and IT leaders published today suggested that, while moving applications to the cloud remains a priority, more attention is being paid to reducing technical debt by retiring applications.

    Conducted by LeanIX, a provider of a platform for managing enterprise architecture and managing value stream management (VSM), the survey found 40% of respondents identified reducing technical debt created by legacy applications and modernizing legacy systems as their top IT priorities. A full 96% said their company has at least one project planned for this year aimed at reducing technical debt with more than half (52%) noting that retiring IT applications is the primary means they will employ to reduce technical debt.

    Nearly 60% considered migrating applications to the cloud to be a high priority, as well. However, less than a quarter of respondents (24%) identified cloud initiatives as a top IT priority. The second most important cloud initiative, identified by 41% of respondents, is to increase the number of SaaS applications being employed.

    Regardless of the approach to the cloud, nearly three-quarters (73%) of respondents said enterprise architects should form a closer connection with software development teams, with an almost equal percentage agreeing on the importance of tracking the business impact of software development.

    However, only 16% of those surveyed considered the evolution and improvement of their security posture a top priority, even though more than two-thirds considered security initiatives—such as improving risk assessment capabilities and adopting more zero-trust IT offerings—as important or highly important.

    Dominik Rose, vice president of product management for LeanIX, said enterprise architects—or someone within IT who assumes responsibility for enterprise architecture—are trying to minimize disruptions to the business as IT environments continue to expand and evolve. The challenge they encounter is there is usually a divide between software development teams and the rest of the business. The size of that divide will vary by organization; in general, though, digital business transformation initiatives should help bridge the gap—assuming enterprise architects can establish and maintain close connections with software development teams, noted Rose.

    LeanIX is making a case for an enterprise architecture management (EAM) platform that provides visibility into IT environments. The company also makes a VSM offering available on top of that platform that provides visibility into software delivery processes. The number of organizations that have adopted VSM platforms remains relatively small, but as organizations depend more on software to drive digital processes, the need for senior business and IT leaders to have more visibility into software delivery schedules is expected to increase.

    In the meantime, it remains to be seen just how aligned DevOps teams are with the strategic goals of the business. The ability to build and deploy software faster does not automatically equate to gaining a deeper understanding of the needs of the business. In fact, there may come a day when software is built and deployed faster than most organizations can effectively absorb unless they have some equivalent of a VSM platform in place.

  • Overcoming IT Complexity With Full-Stack Observability

    Overcoming IT Complexity With Full-Stack Observability

    Organizations embarking on digital transformation journeys tend to develop complex infrastructures. They update their legacy applications while adding multi-cloud, virtual and cloud-native capabilities. Eventually, IT pros find themselves managing diverse, complex and distributed networks including cloud, system, application and database infrastructures.

    To rein in the resulting complexity, organizations tend to amass monitoring and managing tools. The goal is to simplify systems oversight—but instead, silos tend to develop because teams use a wide variety of tools to manage their networks or infrastructures. 

    This piecemeal approach worsens operational blind spots and delays problem resolution. It also increases security exposures. Soon, overwhelmed IT pros can’t keep pace with app modernization or infrastructure dynamics because they’re awash in complexity.

    Though this scenario is common, it’s not inevitable. IT teams can ease their digital transformation journey by implementing an integrated and cost-effective full-stack, end-to-end monitoring service capable of overcoming complexity and silos. 

    Organizations require full-stack observability.

    How Observability Differs From Traditional Monitoring

    Observability goes beyond traditional monitoring. Traditional monitoring helps IT organizations understand the actual state of their infrastructure and applications. It captures and processes volumes of infrastructure and application telemetry data and notifications and displays which components are up, which ones are down and which ones have changed. 

    Usually, traditional monitoring focuses on a specific network, cloud or infrastructure. It tracks application and infrastructure elements so IT pros can identify anomalies and investigate problems as they arise.

    Monitoring relies on metrics-oriented dashboards built to assess telemetry data against manual or basic statistically relevant thresholds. Monitoring tools are invaluable, but they don’t offer cross-domain correlation, service delivery insight, operational dependencies, or predictability. Modern systems have complex multi-cloud environments and a deluge of telemetry data: This counts as a shortfall.

    Observability does more. It measures the internal states of systems by examining the outputs and looks at applications and systems in their entirety—from the end-user experience to server-side metrics and logs.

    But observability also includes monitoring as a critical element. To gain observability, you must first collect information through monitoring. Observability uses the insights and metrics generated through monitoring to understand what’s causing the issue at hand. 

    Monitoring aggregates and displays the data to determine whether the systems are operating as expected. The analysis of this information is compared with expected outcomes and objectives. This allows IT pros to understand the state of their infrastructure and applications. 

    Silos are thus avoided because complex environments are viewed in their entirety.

    Observability in Action

    Once in place, observability allows IT organizations to continuously improve performance, availability and digital experience across complex, diverse and distributed hybrid and cloud environments.

    With observability, organizations can quickly find and resolve anomalies. However, full-stack observability goes beyond monitoring and expedited problem resolution: It supplies insights, automated analytics and actionable intelligence through cross-domain data correlation, machine learning (ML) and artificial intelligence for IT operations (AIOps). It works across massive real-time and historical metrics, logs and trace data.

    Observability goes beyond the silos and the piecemeal approach associated with traditional monitoring. And when observability isn’t limited—when it includes ML and AIOps—it uses the large volume of gathered data and supplies insights, automated analytics and actionable intelligence to help IT staff expedite problem resolution. It also enables ITOps, DevOps and security organizations to achieve consistent, optimized and predictable business service delivery with continuously improved digital experience and IT productivity. 

    The result is customers and employees benefit from better-run systems. The technology provides organizations of all sizes and industries with comprehensive, integrated, and cost-effective functionality through cloud-connected on-premises or software as a service (SaaS) deployment flexibility.

    When embarking on digital transformation journeys, organizations don’t need further complexity—certainly not while they update legacy applications and add a plethora of modern services and capabilities to their stack. The key to reducing complexity is observability.

    Observability simplifies the transformation process. It reduces operational noise to benefit ITOps, DevOps and security teams. They can become more proactive in issue and anomaly detection to achieve optimum IT performance, compliance, and resilience. With full-stack observability, any organization—no matter its size or industry—can reduce IT complexity while readying itself for digital transformation.

  • New Relic Adds SLO Tools to Observability Platform

    New Relic Adds SLO Tools to Observability Platform

    New Relic this week made a service level indicator (SLI) and service level objective (SLO) capability generally available within the New Relic One observability platform. The new capability makes it possible for DevOps teams to customize metrics, unified health reports and alerts.

    Alex Kroman, general manager and senior vice president for product engineering for New Relic, said the goal is to enable DevOps teams to more easily optimize services that span multiple applications and software components at a time when more organizations are relying on software to drive digital business transformation initiatives.

    IT teams have, of course, been tracking SLOs for decades. However, as application environments have become more distributed—thanks, in part, to the rise of microservices—achieving and maintaining SLOs has become more challenging. DevOps teams often lack an understanding of which metrics are most relevant to the business and even when they do, they have historically relied on manual processes and ad hoc tooling, noted Kroman.

    In contrast, New Relic is providing those capabilities in a way that makes it simpler to manage service levels at no additional cost, he added. DevOps teams can, for example, create SLIs in one click to automatically establish a baseline of desired performance and reliability. The platform also provides recommendations based on historical data to both establish benchmarks and customize and configure SLIs and SLOs.

    Those capabilities make it simpler to set service boundaries and track reliability across teams based on benchmarks, tags and reports that include bespoke views for both service owners and business leaders. In effect, via an application programming interface (API) exposed by New Relic, it becomes possible to employ dashboards to gain visibility across an entire business process, said Korman.

    It’s still early days as far as the modernization of SLOs is concerned, but it’s clear that, over time, they will be managed as code along with everything else in a DevOps workflow. The more organizations become dependent on applications to drive digital business initiatives, the more critical it will become for DevOps teams to track SLOs. The decision that must be made is the degree to which it makes sense to manually implement some form of SLO-as-code versus relying on an observability platform that can be accessed as a cloud service.

    Observability, of course, has always been a core tenet of DevOps. Few organizations are able to really achieve it, however, because most IT teams have been monitoring little more than a pre-defined set of metrics. Modern observability platforms make it easier for site reliability engineers (SREs) to launch queries against aggregated instances of metrics, logs and distributed traces to ascertain the root cause of an issue. The issue then becomes how to correlate the results of those queries against the service levels that businesses expect from a set of applications that might be driving, for example, an order-to-cash process. After all, knowing what occurred within an IT environment doesn’t always easily translate into a report that the average business executive can easily comprehend.