Author: Mike Vizard

  • NPMs Sabotaged as OSS Sustainability Crisis Continues

    NPMs Sabotaged as OSS Sustainability Crisis Continues

    A long-simmering debate over the sustainability of smaller open source projects moved beyond the theoretical when two widely used open source node packaged modules (npm) were deliberately sabotaged this week, allegedly by a primary contributor.

    Colors.js is an npm that has been downloaded more than 3.3 billion times, with more than 19,000 projects depending on it. Faker, meanwhile, has been retrieved 272 million times, with over 2,500 projects depending on it. Colors.js enables organizations to print colorful text messages on the console, while faker is used to generate fake data for testing applications. Developers that pulled a recently published Colors.js version found their applications caught in an infinite loop, printing ‘LIBERTY’ ‘LIBERTY’ ‘LIBERTY’ followed by a sequence of gibberish non-ASCII characters. Functional code, meanwhile, was also removed from Faker.

    Ax Sharma, senior security researcher for Sonatype, a provider of an open source software security platform, noted these actions occurred in the wake of the series of zero-day vulnerabilities that impacted the widely used Log4j logging tool for Java applications. Sharma first reported the update issues with Color.js and Faker.

    The small team of contributors that work on the Log4j project found themselves creating multiple updates to the package to address vulnerabilities of varying severity on the common vulnerabilities and exposures (CVE) list. There is some debate, however, over how many of those vulnerabilities warranted a CVE listing given their severity, said Sharma.

    That issue has now emerged as a flashpoint for contributors to smaller open source projects. These contributors contend that larger organizations are taking advantage of their efforts without making any substantial contributions to a project in return, much less compensating any of the contributors for their time and effort. The recent updates made to the npms are, essentially, a protest statement, explained Sharma.

    It’s not clear whether other contributors to small open source projects might follow suit, but the debate over the sustainability of these projects has become heated. Many contributors to open source software assume that the organizations who use the free software they created should assume responsibility for securing it. That “user beware” approach to security is understandable for contributors that are not compensated for their efforts. However, when asked to patch open source projects used by billion-dollar organizations—and do so on an urgent, emergency basis—the resentment among those volunteer contributors rises sharply.

    Fortunately, some effort is being made to address these issues. The Open Source Security Foundation (OpenSSF), an arm of the Linux Foundation, raised $10 million to help maintainers embrace best practices and better protect open source projects from malicious code. Google has pledged $1 million to help open source developers adhere to National Institute of Standards and Technology (NIST) guidelines in response to the Biden administration’s recent executive order on cybersecurity. Administered as a pilot program by the Linux Foundation, that effort is part of a larger $10 billion commitment that Google previously made to open source security.

    White House national security adviser Jake Sullivan also recently sent a letter to major software companies and developers inviting them to discuss initiatives to improve open-source software security. The first step is a one-day discussion this month hosted by Anne Neuberger, the deputy national security advisor for cyber and emerging technology. In the letter, Sullivan specifically noted that while open source software has accelerated the pace of innovation, much of it is maintained by volunteers. This is now a key national security concern, he noted.

    It’s not clear how this emerging open source sustainability crisis will play out. However, DevOps teams might want to consider how dependent they are on open source projects whose contributors might have issues with how their work is being exploited.

  • CNCF Takes LitmusChaos Platform to the Incubation Level

    CNCF Takes LitmusChaos Platform to the Incubation Level

    The technical oversight committee (TOC) for the Cloud Native Computing Foundation (CNCF) announced today it is elevating the open source LitmusChaos application testing platform to the incubation level.

    LitmusChaos is a chaos engineering platform donated to the CNCF by ChaosNative in 2020. Since then, it has seen adoption within production environments by more than 25 organizations, including Intuit, Lenskart, Orange, Red Hat and VMware.

    ChaosNative CEO Uma Mukkara says LitmusChaos was developed to provide DevOps teams with a chaos engineering platform built using containers that makes it easier to scale up and down than existing monolithic alternatives. The platform itself, however, can be used to test both monolithic and microservices-based applications.

    The platform consists of a Chaos Operator based on a software development kit (SDK); a ChaosHub for hosting and sharing experiments; Litmus Workflows that declaratively chains experiments (either in sequence or parallel) to build a chaos scenario; a centralized control plane, dubbed ChaosCenter, to design, schedule and monitor Litmus Workflows; Litmus Probes for creating chaos scenarios that automate steady-state validation and remediation actions and a Chaos Observability tool to export Prometheus metrics.

    In total, there are now more than 400 contributors to the LitmusChaos project and more than 4,000 pull requests have been made. Mukkara said since the beginning of this year, Litmus operator installations have grown to more than 2,000 per day. Going forward, the goal for 2022 is to significantly increase the number of LitmusChaos integrations there are for a wider range of DevOps platforms, added Mukkara. Additional sets of experiments for Kubernetes and non-Kubernetes targets, improved observability and integration with other platforms—via the open source OpenTelemetry agent software also being advanced by the CNCF—is also planned.

    In general, it’s still early days as far as the adoption of chaos engineering with DevOps workflows is concerned. However, Mukkara said that as more organizations embrace observability to better understand IT processes, the number of organizations that also use chaos engineering to test IT resiliency should also increase. In fact, as IT environments become more complex—thanks mainly to the rise of microservices-based applications—chaos engineering approaches to testing may someday be required, noted Mukkara.

    In the meantime, there are still a lot of IT professionals that are uncomfortable with chaos engineering approaches to testing that deliberately break underlying services to test the resiliency of an application. The core idea, however, is that no application should have a single point of failure that could lead to it becoming unavailable. In theory, a microservices-based application won’t fail because when a service becomes unavailable calls are automatically rerouted to another service. The performance of that application will degrade, but it won’t go offline. The challenge is that building an application that achieves that level of resiliency using microservices requires a significant amount of DevOps expertise.

    Regardless of how an application is constructed, the one thing that is clear is how dependent organizations are on applications to drive revenue. As such, the tolerance for application failures—or performance degradation—has never been lower.

  • GitLab Revamps Observability Strategy After Acquiring Opstrace

    GitLab Revamps Observability Strategy After Acquiring Opstrace

    GitLab plans to make observability a more integrated element of its continuous integration/continuous delivery (CI/CD) platform after acquiring Opstrace.

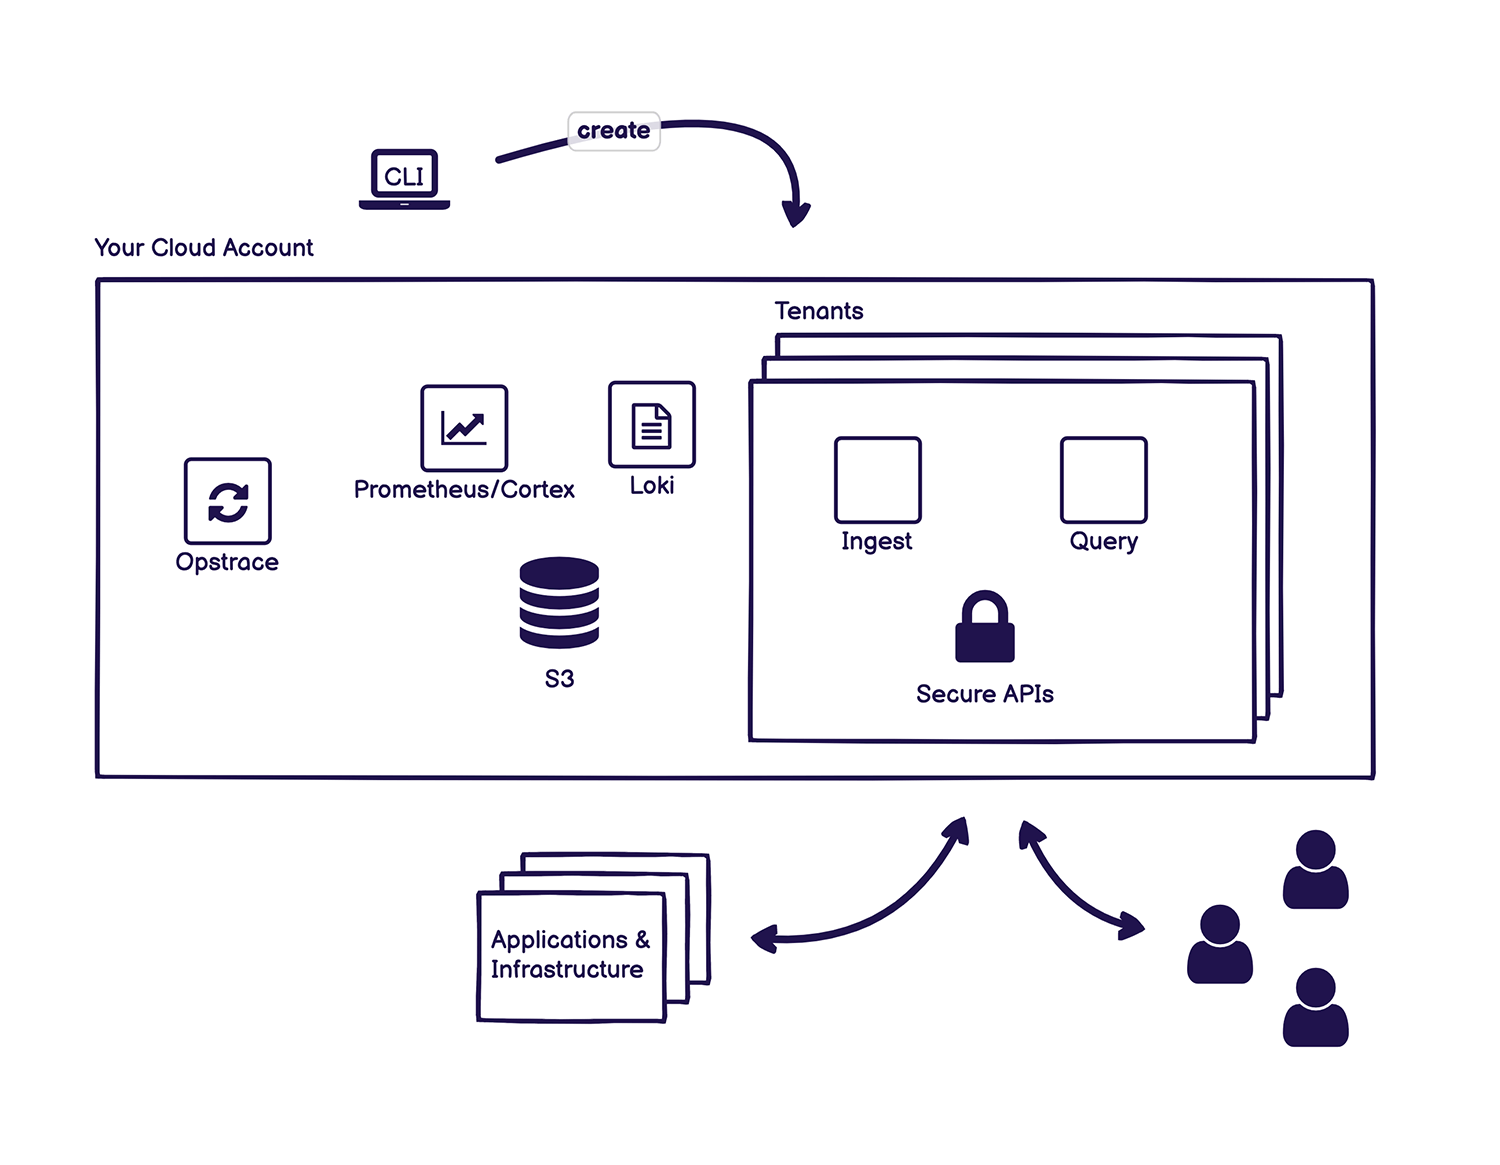
    Opstrace’s open source project exposes a horizontally scalable application programming interface (API) created by Cortex for Prometheus, an open source monitoring platform being advanced under the auspices of the Cloud Native Computing Foundation (CNCF). It then makes use of a Loki API to collect log data.

    DevOps teams can also point an existing instance of Prometheus to Opstrace or any instance of Fluentd or Promtail software they are using to collect log data, with support for a wide variety of other APIs, such as the Datadog agent, planned. A command line interface (CLI) is provided to set an instance of Opstrace that creates a controller through which the collecting of log data is managed.

    Kenny Johnston, senior director for product management for GitLab, said as part of an ongoing effort to make observability more accessible, GitLab plans to integrate Opstrace by default with GitLab Monitor for organizations that use either the self-managed version of GitLab or the software-as-a-service (SaaS) platform.

    Opstrace currently collects logs and metrics and support for distributed traces is planned. The goal is to extend the overall scope of observability capabilities that GitLab already provides within its CI/CD platform, noted Johnston. The goal is to make it simpler for DevOps teams to employ observability capabilities and interrogate data to optimize workflows without acquiring a separate observability platform, he added.

    GitLab is betting that, as Prometheus continues to gain traction, more DevOps teams will prefer to extend its reach into the realm of observability rather than having to manage a separate platform.

    Although observability has always been a core tenet of DevOps best practices, achieving it has proven to be a challenge. At best, most organizations can continuously monitor IT environments based on predefined metrics that identify when a specific platform or application is performing within expectations. Observability combines metrics, logs and traces—a specialized form of logging—to instrument applications in a way that makes it simpler to troubleshot issues without having to rely solely on a limited set of pre-defined metrics that have been created to monitor a specific process or function.

    The rate at which DevOps teams will embrace observability will naturally vary. In 2022, the biggest obstacle might not be the technology as much as it is simply understanding what queries can help DevOps teams better understand the root cause of an IT issue before there is a major disruption. In the long term, it’s expected that machine learning algorithms will leverage the data collected by observability platforms to automatically identify issues that might lead to a disruption long before it actually occurs.

    One way or another, the ability to discern events even within the most complex IT environment is steadily improving. Whether that’s accomplished as an extension of monitoring or by embracing true observability may not be all that relevant—as long as the ultimate goal is achieved.

  • Intel Expands Scope of OneAPI Toolkit Initiative

    Intel Expands Scope of OneAPI Toolkit Initiative

    Intel has made available a 2022 edition of its oneAPI toolkit through which it makes processor extensions accessible to DevOps teams.

    James Reinders, chief evangelist for Intel software products, said the goal is to make it simpler for DevOps teams to expose extensions to any company’s processors in the runtimes developers use.

    At its core, the oneAPI toolkit is a collection of APIs that Intel created for x86, graphics processing units (GPUs), application-specific integrated chips (ASICs), field programmable gate arrays (FPGAs) and other classes of processors.

    Reinders noted that developers have never had as much ready access to so many different processor classes before. The challenge organizations face, however, is making it simpler for developers to take advantage of those capabilities in a way that doesn’t require them to write low-level code, he added.

    The oneAPI 2022 toolkit adds additional capabilities including the world’s first unified compiler implementing C++, SYCL and Fortran, data-parallel Python for CPUs and GPUs, advanced accelerator performance modeling and tuning and performance acceleration for artificial intelligence (AI) and ray tracing visualization workloads. Collectively, Intel said it has made 900 new and enhanced features available via the oneAPI toolkit in the last year, including deeper Microsoft Visual Studio Code integration, support for Microsoft Visual Studio 2022 and Microsoft WSL2 for Linux development on Windows.

    As IT continues to evolve it will become more routine for developers to invoke heterogeneous classes of processors within the same application, said Reinders. Those capabilities will drive an explosion of software development innovation through the rest of the decade and beyond, he added.

    Intel is especially focused on making it easier for developers to invoke inference engines that take advantage of processor extensions to run AI workloads, Reinders said. Going forward, most applications will take advantage of machine learning algorithms that run inference engines optimized by Intel via extensions to its processors. As those workloads are constructed, integrating AI models within DevOps workflows will become the next major challenge, noted Reinders.

    It’s too early to say how simplified access to heterogeneous processors, also known as XPUs, might change the application development landscape. The one thing that is clear is IT organizations now have more options than ever. The issue now is finding a way to invoke all those capabilities in a way that doesn’t overwhelm developers. DevOps teams will play a key role in deciding which processors and associated extensions to make available to their development teams.

    In the meantime, the battle for processor dominance will only intensify in the months ahead. DevOps teams will need to decide how comfortable they are using processors manufactured by a single company like Intel or whether they want to employ a mix of processors provided by multiple vendors. Regardless of what they decide, it appears APIs will play a critical role in making it easier to benefit from advances in processor technologies.

  • LogDNA Survey Surfaces Observability ROI Concerns

    LogDNA Survey Surfaces Observability ROI Concerns

    A Harris Poll of 200 senior engineering professionals suggests it may be a while before most DevOps teams are able to achieve true observability in their IT environments.

    The survey was conducted on behalf of LogDNA, a provider of an observability platform, and found nearly three-quarters of respondents (74%) are struggling to achieve their observability goals despite investing hundreds of thousands of dollars. In fact, well over a third (38%) said they are already investing $300,000 annually on observability tools.

    Despite those investments, less than half of respondents are very satisfied with their ability to use log data. Key areas of frustration include the challenges of collaboration with colleagues spanning multiple teams (67%), the fact that the tools are not easy to use (66%) and the routing of security events (58%).

    Nevertheless, the bulk of survey respondents said they are optimistic about observability. A full 85% of participants said they believe true observability is possible.

    LogDNA CEO Tucker Callaway said the core issue that many organizations fail to recognize is that observability is really a data literacy and management challenge. Organizations are collecting logs, metrics and traces from a wide range of tools and platforms without thinking through optimal data pipeline construction. The result is an aggregation of data that has not been normalized to simplify surfacing actionable intelligence, he said. In fact, many organizations quickly discover that all they’ve really accomplished is increase their data storage costs, said Callaway.

    In the absence of that data normalization, Callaway noted it becomes exceedingly difficult for cross-functional teams to query all the data being collected within a repository.

    At its core, observability promised to make it easier to identify IT issues before they cause a disruption. Observability in one form or another has always been a core tenet of any DevOps best practice. Initially, DevOps teams focused on continuous monitoring as the most effective way to proactively manage application environments. However, it can still take days, sometimes weeks, to discover the root cause of an issue. Observability platforms make it possible to correlate events in a way that makes it easier for analytics tools to identify anomalous behavior that might be indicative of the root cause of an IT issue.

    In contrast, traditional IT monitoring focuses on predefined metrics to identify when a specific platform or application is performing within expectations. Observability platforms combine metrics, logs and traces—a specialized form of logging—to make it easier for IT professionals to interrogate data being generated by a wide range of DevOps tools and platforms.

    Of course, the assumption is that DevOps teams actually know what queries to launch to determine what the root cause of an IT issue might be. In the longer term, machine learning algorithms should make it easier to identify anomalies within IT environments. In the meantime, however, achieving observability still requires a fair amount of DevOps expertise that is not always readily available.

    Eventually, observability will become much more automated than it generally is today. As that transition occurs, IT teams should find the ROI of observability is steadily improving.

  • New Relic: Observability Tops 2022 DevOps Agenda

    New Relic: Observability Tops 2022 DevOps Agenda

    If 2021 was the year when IT organizations became aware of the need for observability, then the coming year should see observability aspirations realized.

    A report published by observability platform provider New Relic postulates that there are no less than 11 factors converging in a way that will make observability an absolute requirement for organizations.

    At the top of that list is a simple fact: Observability is now required to drive digital business transformation initiatives that typically span multiple processes. In fact, a global survey of 1,300 IT leaders, software engineers and developers conducted by New Relic found 90% of respondents view observability as critical to the business.

    Second, as a result, observability is now starting to be applied in both pre- and post-production environments as organizations take a more holistic approach to managing the software development life cycle, the report noted.

    Third, the report suggested that IT teams are looking to make better-informed decisions based more on facts than intuition. To do this, teams are using data collected from across the enterprise application environment. In fact, the fourth factor advancing observability in the enterprise is that the cost of instrumenting application environments is dropping, which the report notes is making it easier to collect relevant data.

    The fifth and sixth factors reflect a desire to rationalize the number of monitoring tools that IT teams currently use and the fact that usage-based pricing has simultaneously made it less expensive to leverage observability platforms as needed.

    The seventh factor is the overall shift toward open source software that enables observability platform providers to collectively leverage innovations faster. The eighth factor, closely linked to the open source trend, is the rise of more complex open source platforms such as Kubernetes that require much higher visibility to successfully deploy and manage.

    The ninth trend identified in the report is increased adoption of DevOps best practices that encourage IT teams to view observability as a core tenet of any IT management strategy. The tenth factor cited by the report is the need to drive increased collaboration among IT professionals.

    Finally, the eleventh factor driving further adoption of observability is the need for increased application reliability as more organizations appreciate their dependence on software to deliver essential services.

    Buddy Brewer, a group vice president and general manager for New Relic, said now that observability platforms are becoming more accessible, the next big challenge will be teaching IT professionals what questions to ask as they troubleshoot both legacy monolithic applications and a wide range of emerging microservices-based applications. The results of those queries then need to be easily shared with both developers and internal IT operations teams that must work together to maximize application performance and availability, he added. The latter requirement is why New Relic decided to acquire CodeStream to make telemetry data available with integrated development environments (IDEs), noted Brewer.

    There is, of course, no shortage of observability platforms for IT teams to adopt. In fact, the biggest challenge now is getting every application stakeholder to agree to standardize on an observability platform—no small feat, as many DevOps teams may already have a preference for one approach over another.

  • Quali Adds Free Tier to DevOps Automation Platform

    Quali Adds Free Tier to DevOps Automation Platform

    Quali has added a free tier of service to its Torque platform for automating infrastructure provisioning and application workload deployments.

    In addition, the company has updated the software-as-a-service (SaaS) platform to provide blueprints through which it provides tighter integration with Terraform, an open source infrastructure-as-code (IaC) tool, along with support for custom tags to make it easier to generate reports and dashboards that provide greater visibility into infrastructure costs.

    Quali CEO Lior Koriat said the free tier is intended to make the Torque platform more accessible to both small teams of DevOps professionals and individual users. It includes the ability to build environments on Amazon Web Services (AWS) or the Microsoft Azure cloud in addition to providing integration with a variety of DevOps tools and platforms and access to a sample blueprint library. Support for the free tier is provided via an existing community edition of the platform.

    Koriat said Torque takes IaC a step further by also making it possible to automatically deploy complete application environments on top of infrastructure provisioned as code using blueprints rather than low-level Terraform scripts. The goal is to increase developer productivity by extending Terraform so that developers can spin up environments across multiple cloud computing platforms via self-service, he added.

    That approach also sharply reduces the chances a cloud platform will be misconfigured, which Koriat noted is the bane of cloud security professionals’ existence. Most developers lack the cybersecurity expertise required to ensure cloud computing environments are configured properly. Simplifying the provisioning of infrastructure is especially critical when developers employ complex platforms such as Kubernetes, added Koriat.

    At the same time, Quali’s Koriat said IT leaders want more visibility into how cloud resources are being consumed as the number of workloads deployed in these environments steadily increases. Developers tend not to remember to de-provision cloud resources when no longer needed, which Koriat noted conspires to increase cloud costs unnecessarily.

    It’s not clear just yet how quickly DevOps teams might be moving away from relying on lower-level tools toward automation frameworks accessed via a SaaS platform. However, as application environments become more complex, it becomes even more challenging to provision and manage IT environments—especially since many DevOps teams are still working from home to help limit the spread of the COVID-19 pandemic.

    One way or another, the amount of time and effort spent managing IT infrastructure needs to be reduced. After all, while application environments are increasing in both size and complexity the number of individuals that make up a DevOps team remains largely the same. The need to rely more on automation frameworks has reached a tipping point that is becoming increasingly obvious to all concerned.

    As more organizations start to operate as software companies in the age of digital business transformation, it’s clear the way IT has been managed in the past is about to fundamentally change. The issue now is determining which automation framework lends itself best to enabling DevOps teams to achieve that goal.

  • Red Hat Adds Service to Customize RHEL Images

    Red Hat Adds Service to Customize RHEL Images

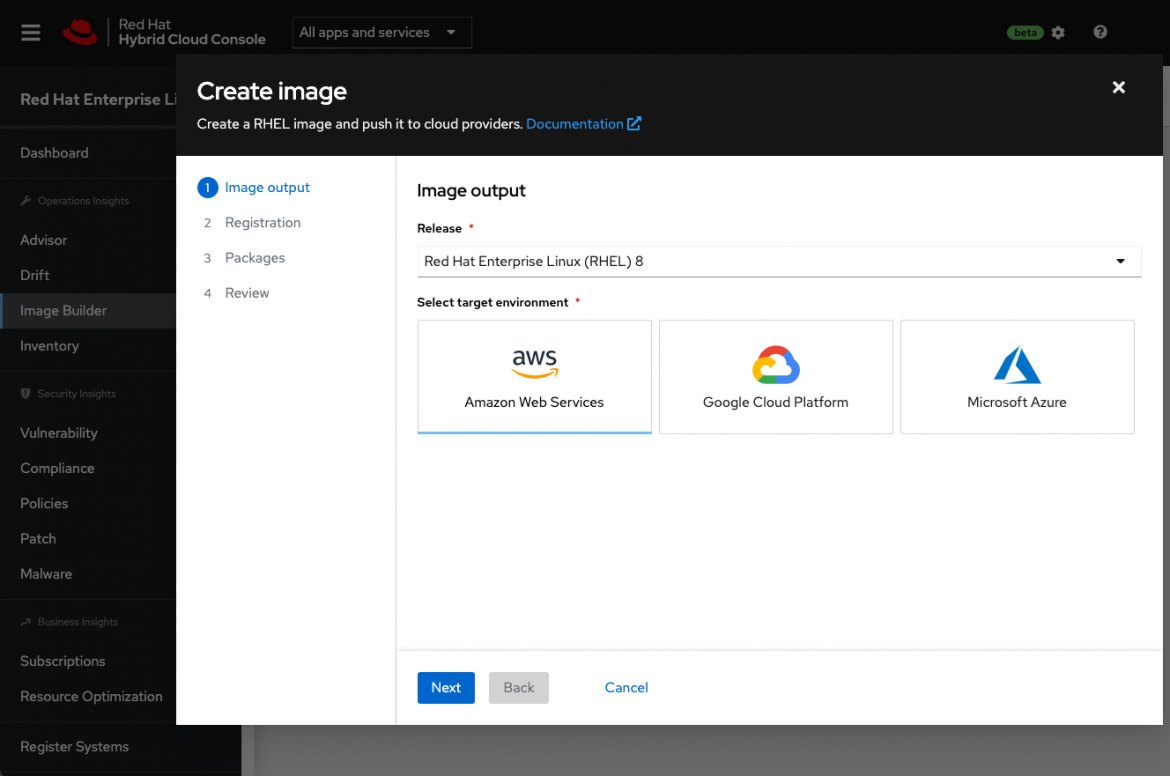
    Red Hat this week announced a public beta of an Image Builder service that streamlines the process of building customized instances of the Red Hat Enterprise Linux (RHEL) operating system.

    Scott Herold, director of product management for RHEL at Red Hat, said the Image Builder service enables an IT team to define a “gold” template for each target deployment environment that only contains the RHEL code required. Initially, Image Builder is configured to default to build a minimal, recommended RHEL server image for Amazon EC2, Microsoft Azure and Google Cloud Platform (GCP) cloud services.

    Future updates to the service will add support for VMware vSphere platforms as well as downloadable images and installation media for physical servers, customized filesystem layouts and versions 9.0, 8.5, 8.4 and 7.9 of RHEL. The service itself is accessed via the Red Hat Hybrid Cloud Console that is currently being made available in beta.

    Herold said building or installing operating systems is often a slow, tedious and error-prone process that needs to be manually performed in a slightly different way for each platform. Each physical server or edge computing platform requires different configurations and workflows. As a result, the chances mistakes will be made is high; Image Builder can greatly reduce the possibility of mistakes because there is no guesswork required, noted Herold.

    IT teams can also opt to include additional content from Red Hat in those builds to further streamline deployment processes, noted Herold. Those images can then be automatically registered with Red Hat to ensure future updates are received.

    The ability to customize those images also serves to reduce the overall size of the codebase that needs to be secured, added Herold. At a time when there is increased focus on software supply chains in the wake of a series of high-profile security breaches, many IT teams are revisiting their software deployment processes, he noted.

    Ultimately, Herold said Red Hat is moving toward providing IT teams with a more cloud-like experience regardless of where they deploy Red Hat’s curated open source software. The goal is to reduce as much friction as possible so that IT teams can more easily manage infrastructure at scale, he added.

    One way or another, the entiree software deployment process is becoming more automated. Much of the drudgery that has historically made it challenging to deploy and manage IT platforms at scale can be traced back to manual processes created when organizations ran a much smaller number of applications in on-premises IT environments. As IT teams increasingly deploy more applications in the cloud and at the network edge, it’s become more apparent that manual legacy processes won’t scale—especially when it’s already challenging to hire and retain IT personnel.

    It’s not clear how quickly IT teams will modernize software deployment processes using automated DevOps processes. Simple inertia is often a powerful force to overcome; however, most IT professionals can easily find something more compelling to do with their time that doesn’t involve using manually customizing operating system images.

  • Hasura Adds Engine to Transform REST APIs to GraphQL

    Hasura Adds Engine to Transform REST APIs to GraphQL

    Hasura today unveiled a Data Hub repository for integrating application programming interfaces (APIs). The repository includes a connector that makes it easier for IT organizations to convert REST APIs into ones based on the GraphQL specification.

    Tanmai Gopal, Hasura CEO, said the connector eliminates the need to write custom code to connect existing REST endpoints to a GraphQL API using an update to the transformation engine developed by Hasura. Instead, the model for the GraphQL API is automatically overlayed on top of the REST API endpoint, explained Gopal.

    Originally developed by Facebook, GraphQL has emerged as a popular alternative to REST APIs because it enables developers to retrieve data at a more granular level, which results in improved performance. Hasura provides an instance of a GraphQL engine the company has developed around a project that is now hosted by the GraphQL Foundation, an arm of the Linux Foundation. GraphQL provides a complete description of the data made available via an API and is organized in terms of types and fields rather than traditional endpoints. In addition to clarifying what data is available via that API, developers can employ types to avoid writing manual parsing code.

    Hasura claims its engine has been downloaded more than 400 million times since its introduction in 2018. It automates the repetitive work involved in mapping models to APIs by providing common access patterns for pagination, filtering, joining, setting up authorization rules and optimizing performance. Hasura also provides APIs that are able to connect to multiple services and data sources, embed domain-specific authorization logic and provide additional layers of security.

    Hasura is now also adding a way to create identity-specific authorization policies for any GraphQL service or data source, enforcing security by limiting the models and fields of the GraphQL APIs in a way that eliminates the need for IT teams to cobble together disparate libraries and frameworks, said Gopal.

    In addition, Hasura is adding support for Google Cloud to Hasura Cloud in beta, a managed API integration service the company already provides via the Amazon Web Services (AWS) cloud. Support for the Microsoft Azure cloud will be forthcoming in 2022, added Gopal.

    It’s not clear the degree to which organizations are looking to replace existing REST APIs with ones based on GraphQL. However, Gopal noted there are plenty of instances where organizations need to overlay a GraphQL API on top of a REST API that they may not own. For example, a software-as-a-service (SaaS) platform that currently exposes a REST API may not have any plans to support GraphQL, he said.

    There’s no doubt the number of GraphQL APIs being employed in the enterprise is about to dramatically increase. The challenge now is finding a way to manage them alongside the previous generations of APIs that remain. The trouble is that many of those APIs were created by developers that may not have documented the APIs they created or, in some cases, never informed DevOps teams that they existed in the first place.

  • Speedscale Makes Free API Observability Tool Available

    Speedscale Makes Free API Observability Tool Available

    Speedscale today announced it is making a free edition of its observability tool for application programming interfaces (APIs) available to developers.

    Ken Ahrens, Speedscale CEO, said the goal is to expose more developers to the company’s API testing tool that can be accessed on their local machine via a command line interface (CLI). Dubbed Speedscale CLI, it is designed to enable individual developers to inspect, detect and map API calls on local applications or containers rather than having to subscribe to the company’s current API testing platform via a software-as-a-service (SaaS) model.

    That approach should reduce the number of disruptions DevOps teams are likely to encounter after an application is deployed in a production environment, noted Ahrens.

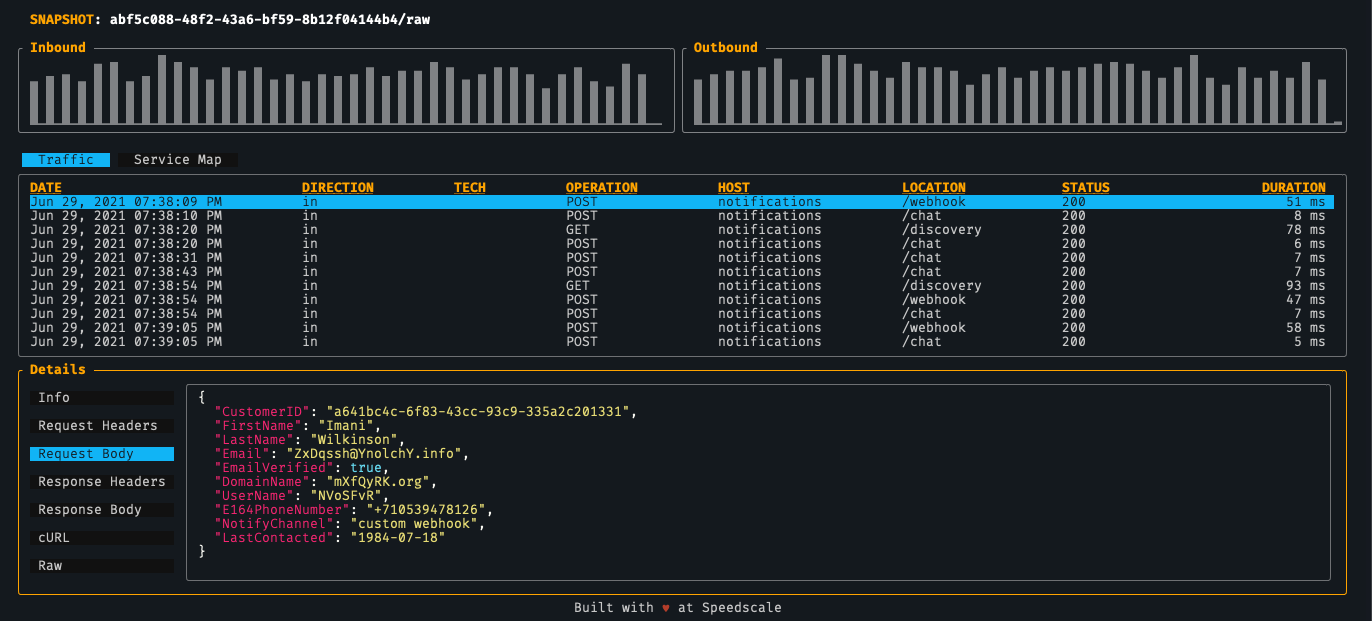
    Speedscale CLI features include service mapping, which enables developers to auto-detect and map external dependencies that could break, a traffic viewer for logging and tracing API calls and latency detection tools that show how code changes are impacting performance. In a forthcoming update, Speedscale also plans to include load generation capability to enable developers to run tests locally. The overall goal is to enable IT organizations to shift more responsibility for the management of APIs further left toward the developers that create them, said Ahrens.

    Naturally, Speedscale is also hoping that, as more developers are exposed to its observability platform for APIs, there will be increased demand for its SaaS platform among DevOps teams that need to manage and maintain APIs in production environments within their existing workflows. Speedscale exposes a set of APIs of its own to enable that integration, noted Ahrens.

    At its core, the Speedscale SaaS platform is designed to enable DevOps teams to replay how calls are made between APIs and external mock services to make it easier to diagnose issues.

    In general, there’s a lot more focus these days on APIs, thanks to digital business transformation initiatives that are dependent on APIs to integrate processes. The challenge organizations face is many of those APIs are built by separate development teams. In some instances, organizations can find themselves deploying redundant APIs. Other organizations will create APIs that, over time, are simply forgotten about or that go dormant when the developers that created them leave the organization. These “zombie APIs” often represent a security risk because cybercriminals now routinely scan IT environments for unattended APIs through which they can exfiltrate data without anyone noticing.

    One way or another, the management of APIs is becoming a distinct discipline within many organizations as they come to appreciate the level of IT flexibility they enable. Replacing backend services is a lot simpler when the APIs calls that invoke them both internally and externally remain relatively simple. The challenge is that building and maintaining microservices-based applications based on APIs is a more complex endeavor than building a monolithic application. The first step toward reducing that complexity is, of course, to provide more visibility into the application environment for all concerned.