Tag: secdevops

  • Security automation with DevOps: show me the code!

    Security automation with DevOps: show me the code!

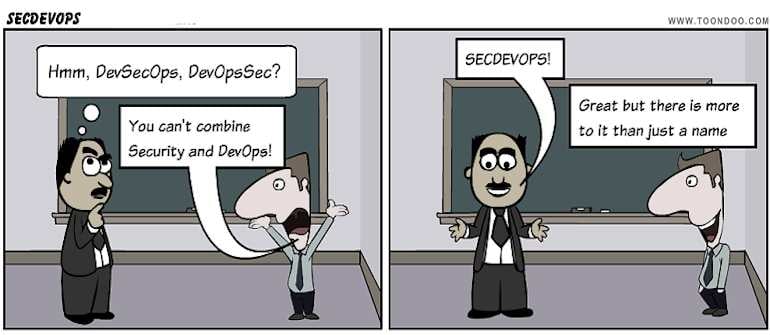
    Last week Andrew Storms put up a good post hinting at the promise of security automation in [SecDevOps: Security Automation By Example – The Firewall Change]. He included an example of automating a series of actions when a firewall rule is changed. It’s a good article, although I’m increasingly convinced there’s no such thing as SecDevOps. In my book, it’s all DevOps, but that’s fodder for another post (when I’m not battling a stomach bug). However, what Andrew describes is more of what I consider an automated assist. It isn’t necessarily full automation, since it triggers on a manual firewall rule change. Ideally we rarely manually change a firewall (or Security Group) rule, and rely more on self-configuring based on policies. Yeah, I know, the usual analyst BS, so here’s a bit of process, and a bit of code. Let’s approach this differently. Take Andrew’s process, but let’s have the security group or host firewall self configure based on the asset. My example is going to be Amazon Web Services specific, since I have some code snippets to show off how it works. (Sorry, I don’t have the time or intestinal fortitude to write out all the code today; seriously, where did this bug come from?!?) There are two techniques I generally see forming the core of dynamic Security Group policy enforcement:

    1. Tags
    2. Configuration Management integration

    Some cloud services, like AWS, support tags at the object (in this case, instance) level. These tags can tie internally to policies while also being consumable for external tools. Here is a policy I use that restricts access to an object if the “SecurityStatus” tag is “IR” (for “Incident Response”):

    {  
      "Version": "2012-10-17",  
      "Statement": [  
        {
          "Action": "*",
          "Condition": {  
            "StringEquals": {
              "ec2:ResourceTag/SecurityStatus": "IR"
              }
              },
              "Resource": [
              "*"
                          ],
              "Effect": "Deny"
          }
          ]  
        }         
    

    I could apply that tag manually or automatically, and in either case the instance can no longer be managed by any account this policy is applied to. Now this doesn’t help us change firewall/Security Group rules, since you can’t manage those directly in EC2 based on tags (but I had the policy handy to demo, so there you go). For that to work, you need to write your own code to scan for tags and then take actions. I don’t have exactly the right code examples on hand. but here are some snippets to get you close. Most of these are cribbed from my SecuritySquirrel proof of concept on GitHub. They are all in Ruby, using the AWS 2.0 developer preview SDK. First, to pull a list of all instances with a certain tag, you can use the following:

    def testing
     # testing some tag code
     instancelist = @@ec22.describe_tags(
     filters: [
     {
       name: "key",
       values: ["SecurityStatus"]
     }
     ]
     )
     puts instancelist.to_h
    end  
    

    That shows everything with the SecurityStatus tag (instances and values, shown as a hash), but you could also filter on value. From there, you could pull the instance IDs with a map (you might want to further filter only on instances, but if you made it this far you can figure that out):

     instances = instancelist.map(&:resource_id)  
    

    Then you can pump those into a method to change the Security Group. Here’s the one from SecuritySquirrel that places an instance into a “Quarantine” group:

    def quarantine
      #this method moves the provided instance into the Quarantine security group defined in the config file.
      puts ""
      puts "Quarantining #{@instance_id}..."
      quarantine = @@ec22.modify_instance_attribute(instance_id: "#{@instance_id}", groups: ["#{@QuarantineGroup}"])
      puts "#{@instance_id} moved to the Quarantine security group from your configuration settings."
    end  
    

    Want to trigger some scanning? Here’s a code snippet to trigger a Qualys scan on an instance from a virtual appliance in your AWS account (keep in mind, I’m skipping a bunch of important pieces, like configuring the service and authenticating):

      instance_IP = instance_details.reservations.first.instances.first.private_ip_address
     timestamp = Time.new
     scan =(HTTParty.post("https://qualysapi.qg2.apps.qualys.com/api/2.0/fo/scan/",
          :basic_auth => @qualysauth,
          :query => { 
            :action => "launch",
            :scan_title => "SecuritySquirrel Scan at #{timestamp}", 
            :ip => "#{instance_IP}",
            :option_title => "Initial Options",
            :iscanner_name =>  "us-west-2" 
          },
          :headers => { "X-Requested-With" => "ruby httparty"}))
          puts "Launching Qualys scan named: SecuritySquirrel Scan at #{timestamp}"  
    

    Or want to change the CloudPassage Halo host firewall rules? Well, that code uses a pre-release of their Ruby SDK, so I’ll save it for another day (I’m not employed by them, but they let me play with the pre-release gem). These examples are all based on tags, but remember that if you use a tool like Chef or Puppet you can do the exact same thing based on what software is configured and running within the instance. For example, you could create a policy to quarantine all SSL when the Heartbleed vulnerability hit by closing off port 443 on any server running the vulnerable OpenSSL package, then remove the rule when it is updated to the patched version. I’m a bit rusty since I don’t code every day, but I could probably pop that code off in an hour or two, it isn’t that hard. Also my tool is designed for demos, and doesn’t run in the background, but clearly you could have it running all the time, adjusting things based on tags or even attributes of software deployed in the instance. Security automation is insanely powerful. It can completely automate complex security tasks, or, as in Andrew’s example, supplement manual activities and policy changes. Hopefully my snippets give you some ideas, and pop me over any good examples if you are willing to share.
  • SecDevOps: Security Automation By Example – The Firewall Change

    SecDevOps: Security Automation By Example – The Firewall Change

    Security Automation By Example

    The Firewall Change

    Just when you thought DevOps was the new black, along comes SecDevOps.  Yes folks, like most things in life, the new cool is already here.  Before I move on to trying to explain SecDevOps, please accept my mea culpa because for many people DevOps is yet to be clearly defined.  I can imagine your frustration that I’m going to try and explain a new term based on a loosely defined term.

    I’m not going to try and provide a complete definition of SecDevOps, but instead I’d like to provide what I believe to be important attributes of the SecDevOps movement.  In this post, lets discuss security automation and use a firewall change process as an example.

    One important attribute of SecDevOps is heavy use of security automation.  In particular when I think security automation, I tell people to use IFTTT thinking.  Stolen from the service whose tagline is “put the Internet to work for you”, I explain security automation simply as “if this, then that”.  Its a highly simplistic, but poignant way to imagine ways in which one would automate workflow.

    A simple act of changing a firewall has huge potential for security automation.  The SecDevOps firewall change process goes beyond changing a few lines in a config, but also provides an independent and automated verification process that most organizations don’t perform today.

    Consider what happens when a firewall policy is changed.  First the policy change request is reviewed and approved.  Then the policy change request is assigned and acted upon.  Many times, but not always, the change is verified by another person through configuration review.

    Security automation takes this process one step further.  Imagine when a firewall is changed that a security audit event is automatically logged.  Next, an automation component notices the firewall change and automatically spins up a remote scanning instance in a cloud provider.  Next, that scanning instance is contacted using APIs to perform a remote network scan.  The scan completes, results are exported and compared with prior scan results automatically.  Finally, the automation component automatically updates the firewall change request in a ticketing system showing the scan results.  We have now completed an automatic, independent and autonomous firewall change verification.   That simplified yet powerful workflow is security automation and completes what many people refer to as a closed loop.

    The new SecDevOps method for a firewall change not only provides a closed loop process, but does so by automating the verification steps.  Joining traditional security processes with new API driven cloud services is a true force multiplier that many organizations will soon wish they had.

    In upcoming posts, I’ll also discuss some of the other important components of what I believe make up the new black of SecDevOps.

  • Using AWS CloudWatch for Anomaly Detection

    Using AWS CloudWatch for Anomaly Detection

    Based on my unscientific poll of friends, one of the least used and most overlooked features of AWS is CloudWatch.  Not only can CloudWatch be used to monitor the availability of your AWS services, but it can also be used as anomaly an detection tool. Did I mention that these feature are free?

    Since the holy grail of DevOps is to bring  the security and the operations teams together to meet the same goals in an automated fashion; Cloud Watch is a perfect DevOps tool. In fact, once it’s implemented for your environment  you are one step closer to the exalted state of SecDevOps.

    If you aren’t familiar with AWS CloudWatch then head on over to https://aws.amazon.com/cloudwatch/. As a quick introduction, here’s how AWS website describes the service:

    “Amazon CloudWatch provides monitoring for AWS cloud resources and the applications customers run on AWS. Developers and system administrators can use it to collect and track metrics, gain insight, and react immediately to keep their applications and businesses running smoothly. Amazon CloudWatch monitors AWS resources such as Amazon EC2 and Amazon RDS DB instances, and can also monitor custom metrics generated by a customer’s applications and services. With Amazon CloudWatch, you gain system-wide visibility into resource utilization, application performance, and operational health.”

    Let’s assume that both security and Ops teams need to be aware when weird things are happening with their servers and applications.  Events outside the norm (aka weird things) can be either be related to security or operational events; either way they may merit investigation. Here’s a simple CloudWatch  monitoring process you can use  to give you a heads up on events that could indicate someone is trying to exfiltrate data from your systems.

    Opening Scene

    Think about what kind of information attackers are after.  They want your intellectual property and your customer data because it can be converted to cold, hard cash.  Next, consider the architecture of your systems and where that data is stored. Most likely your treasures are stored in databases or Git repositories.

    Guess what? Attackers know that so that’s exactly what they are looking for.  Take a few minutes and think like an attacker bent on exfiltrating your data.  Obviously, the first thing you should do is carefully monitor your egress traffic for suspicious activity.  In addition, look for anomalies in traffic flows – they can also help determine if suspicious events are happening.  Amazon CloudWatch can help you do  both of these things.(Note: This process assumes you haven’t already been breached.)

     1. Enable CloudWatch

    2. Establish a baseline

    Review the historical data on a daily, weekly and monthly basis.  Soon you will start to see a trend in your egress bandwidth usage.  Start with eyeballing the min, max and average usage over time.  Put these in your favorite tracking tool (text file, spreadsheet, abacus, whatever).

    3. Configure alerts

    When you feel comfortable with your baseline, configure your first alert to send an email if traffic usage goes over the baseline.  Consider how “chatty” you want this event to be.  For example, alerting over the average baseline will often generate more alerts than alerts over maximum usage.  This is a tricky balance and you’ll need to make trade offs between missing problems and the time spent responding to potential false positives.

    4. Respond

    However you choose to respond is up to you.  I suggest you start with automatically opening a ticket in your tracking system so that someone will be sure to review the alert and make notes on their findings.

    5. Tune as needed

    Make a plan to review the alerts and the data on a regular basis.  Architecture and other changes to the system are going to change the baseline and the alerts may need to be reconfigured.

    Building and automating security into DevOps is a requirement that everyone should be working toward. It’s a theme I’m going to be returning to in future posts because it’s really important.

    AWS Cloudwatch is a free tool that you can help you get started automating security right now, so what are you waiting for?