Tag: Rookout

  • Rookout Tool now Debugs Third-Party Code

    Rookout Tool now Debugs Third-Party Code

    Rookout revealed today it has extended its eponymous debugging tools to include third-party applications.

    Shahar Fogel, Rookout’s CEO, says most organizations today are building applications that rely heavily on code or modules developed by a third party. Rookout now makes it possible to analyze and debug that code before it is incorporated within a larger application environment, Fogel said.

    That’s crucial, because many of the operational issues a DevOps team is likely to encounter can be traced to flawed code written by someone outside of the IT organization, Fogel said. This new capability will reduce the amount of time DevOps teams spend trying to deduce the root cause of an issue, he said.
    Many IT organizations erroneously assume that all the code running in their environments has passed through a continuous integration/continuous deployment (CI/CD) environment, Fogel said. In reality, it’s not uncommon for developers to deploy code directly into a production environment in the name of expediency. Not all of that code, however, may have been written by the developer. Many developers wrongly assume the code they download from a repository was properly vetted and debugged.

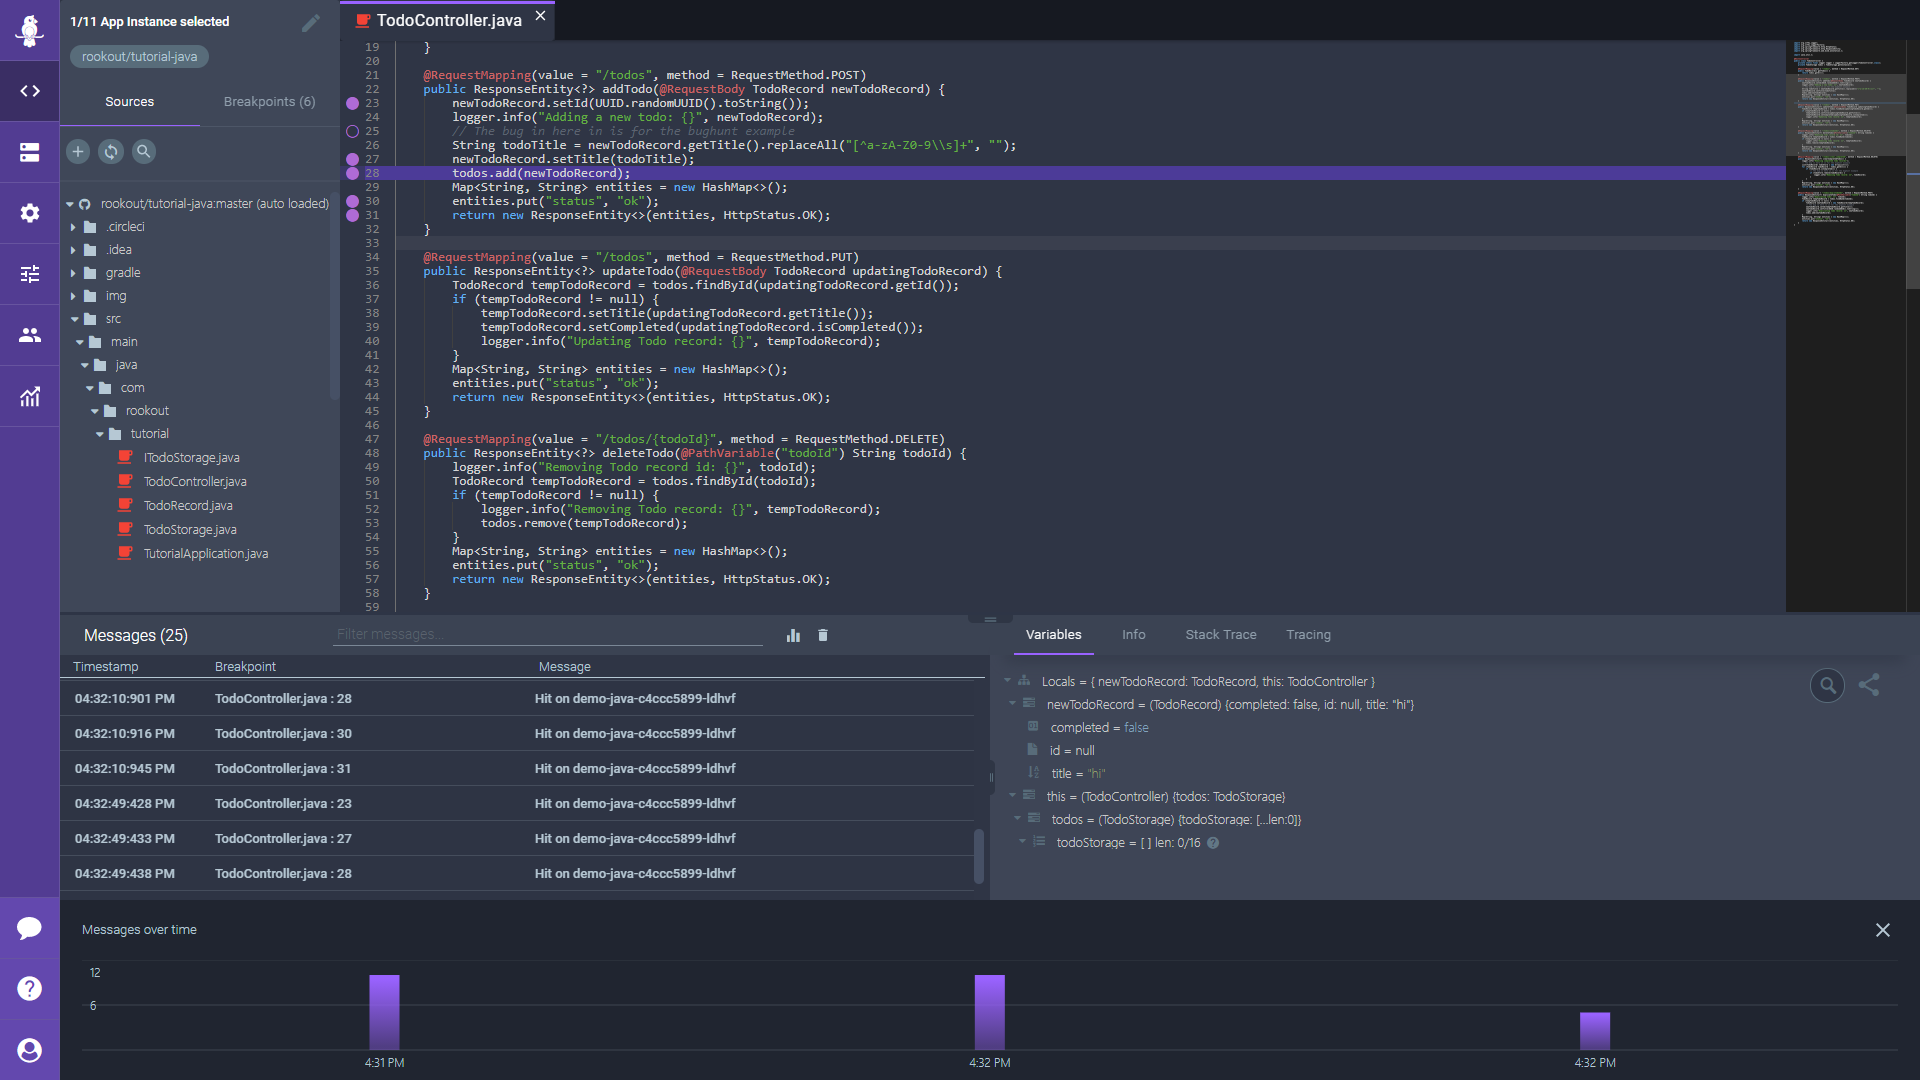
    Rookout now makes it possible to debug both open source code and proprietary code written by a third party or present on an application deployment platform, said Fogel. Rookout collects the local variables, function arguments, tracing data, call stack and other relevant data, and can identify issues down to specific lines of code. Support for third-party code has been extended to the call stack level to enable developers to see how code execution flows across their own and third-party code.

    As more responsibility for applications shifts left toward developers, organizations need to provide them with tools to analyze applications and the platforms they run on. Beside building applications faster, one of the primary theoretical benefits of DevOps is the notion that developers can build more resilient applications, because it’s ultimately their responsibility to remediate any issues that arise after an application is deployed in production. In practice, that’s difficult to achieve when developers have no visibility into code that they didn’t write themselves.

    Going forward, there’s going to be a lot more third-party code running in production, as developers reuse application code encapsulated in containers downloaded directly from registries, Fogel said.

    The degree of accountability developers have for their appliations’ code currently varies widely by organization. However, given the right tools, and enough time, most developers would prefer to debug both the code they write and any they have incorporated, even if it were written by someone else. That desire, however, requires more time to build and test applications. Of course, it’s worth the tradeoff if developers encounter fewer incidents that require developers to debug applications after they are deployed in a production environment.
  • Rookout’s Modern Debugging Platform Brings Server Performance Metrics to Developers

    SAN FRANCISCO, Dec. 07, 2020 (GLOBE NEWSWIRE) — Rookout, the modern debugging platform, today announced it will bring server performance metrics directly into the debugging workflow for the first time. Traditionally, telemetry related to CPU spikes, memory leaks, and disks filling up were prioritized solely by IT Operations teams using traditional monitoring and APM tools. However, with the shift-left DevOps movement, it’s critical that software developers understand how their code is impacting production and that they care about metrics such as uptime.

    “Over the past decade software developers have become more and more invested in the server metrics underneath their code,” said Liran Haimovitch, CTO and co-founder of Rookout. “Traditional debugging is painful enough — let alone having to context switch between your debugger and an APM tool. This is why we’ve decided to bring relevant server health metrics directly into the debugging workflow, so developers can see their application code alongside infrastructure health, in one place, to understand the full picture.”

    The idea for a more seamless debugging workflow came back in February, at the AppDynamics global event Transform 2020. It was there that Rookout announced a formal integration with AppDynamics called Deep Code Insights, which allowed IT Operations teams to notice a performance issue, such as a CPU spike or memory leak, and then leverage Rookout’s technology to click directly into the application code, in order to pinpoint and diagnose the root cause.

    Today, that workflow can be inverted for organizations interested in shifting left, due to Rookout’s native ability to surface performance metrics inside the tool where the developer already lives. “We want to make it easier for developers to understand their software,” said Shahar Fogel, CEO of Rookout. “This will drastically improve enterprise velocity and agility, as it becomes much simpler to correlate code innovation to its impact on performance.”

    According to the analyst firm Digital Enterprise Journal, 61% of organizations report the “time spent trying to identify the root cause” and the “lack of actionable context from monitoring data” as key challenges for ensuring optimal performance in production. “Rookout created a developer-centric software which short-circuits complexities in production debugging, increases developer efficiency, and reduces the friction which exists between IT Ops and developers,” said Rob Salvagno, VP of Cisco Global Corporate Development and Cisco Investments.

    About Rookout
    Rookout is a live debugging solution that provides an unparalleled ability to collect any piece of data, from the deepest levels of live code, on-demand. This empowers engineers to find the data they need instantly and deliver it anywhere, in order to understand and advance their software. With Rookout, software teams save hours of work and reduce debugging and logging time by 80% — with zero friction, overhead, or risk. Head to www.rookout.com for more.

  • Rookout Launches a ‘Live Debugging Heatmap’ To Find Applications On Fire

    | Source: Rookout

    • According to the 2020 State of Software Quality report, two out of three software developers estimate they spend at least a day per week troubleshooting issues in their code, and close to one-third spend even more time.
    • DEJ’s research shows that organizations are losing $2,129,000 per month, on average, due to delays in application releases.

    TEL AVIV, Israel, Oct. 15, 2020 (GLOBE NEWSWIRE) — Rookout, the modern debugging platform built for developers, today announced a Live Debugging Heatmap that visualizes which applications are causing the most problems within a business. In the age of cloud, where distributed teams can spend hours debugging the same problematic application without even knowing it, the ability to instantly identify where developers are wasting time and resources is incredibly powerful.

    “We want to give meaningful insights in a quick and visually appealing way,” said Shahar Fogel, CEO at Rookout. “We have unique insights into where software developers are spending the most time debugging frustrating applications, and can visualize this information so that management can quickly see where time, money, and resources are being exhausted.”

    Rookout is installed as an SDK and deployed across all of the organization’s environments. This allows for unique insight into which applications are on fire, making them bright red within the Rookout UI for quick identification. Rookout’s dashboard also visualizes how much time developers waste debugging, which developers have found the most bugs in production, and ultimately how much money has been saved using Rookout versus more traditional debugging methods (e.g. endless logging or trying to re-create production environments on local machines).

    Product Highlights:

    • Quick installation via a hosted SaaS solution that takes minutes to configure
    • Color-schemed heatmap quickly identifies the most buggy applications
    • Leaderboard shows how many bugs have been found in production
    • ROI calculator indicates how much time and money is being saved by using Rookout (versus traditional debugging methods)

    “We’re looking forward to leveraging Rookout’s new heatmap to give cross-team visibility into where our developers are wasting the most time,” said Yan Davidovsky, Engineering Director at Amdocs. “We spend many hours each week debugging code, it’s an inevitable part of the workflow. But anything that helps us locate exactly where that time is being spent, and also helps us measure the ROI of those efforts, is invaluable.”

    About Rookout
    Rookout is a modern debugging solution that provides an unparalleled ability to collect any piece of data, from the deepest levels of live code, on-demand. This empowers engineers to find the data they need instantly and deliver it anywhere, in order to understand and advance their software. With Rookout, software teams save hours of work and reduce debugging and logging time by 80% — with zero friction, overhead, or risk.

  • Rookout Workspaces brings teamwork to Production Debugging

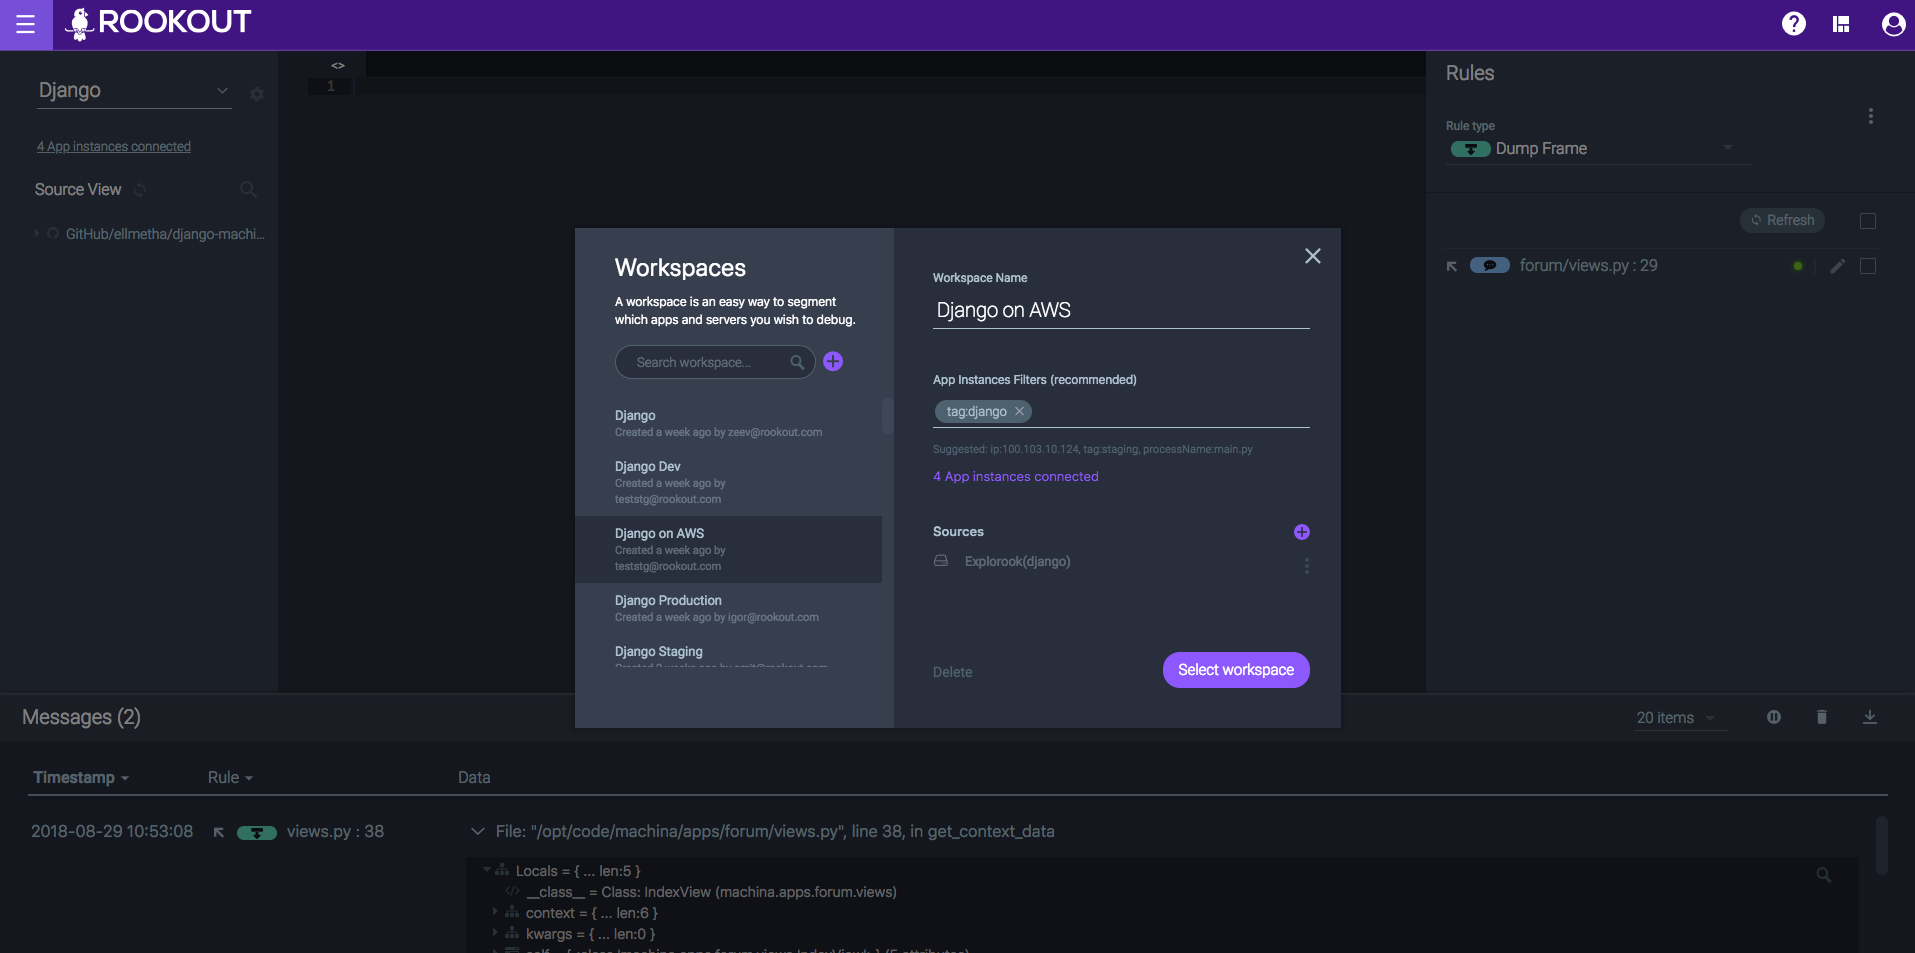
    Rookout has released the first tool to collaboratively debug code on demand, including in production. Rookout’s Workspaces feature works like “Google Docs” for debugging live code, letting developers safely share an IDE tracking down issues and collecting data together.

    Inside a Rookout Workspace, a developer can set ‘non-breaking breakpoints’ in the live code, without any restarts, redeploys or having to write any new code. The data collected from the ‘breakpoint’ is shared with any other team member who shares the Workspace. Team members can safely create their own ‘non-breaking breakpoints’ into the Workspace and debug together on the server without any screen-sharing or giving access to a local machine. developers can also define separate workspaces if they want to work independently on the same code without getting in each other’s way.

    Rookout Workspaces also let developers define a specific section of their environments for data collection. A Workspace can be set to target ‘production’ or ‘staging’, a specific client, a single process or a single IP address. Rookout only collects data from inside the defined Workspace, cutting down on wasteful collection and filtering.

    Academic research shows “Pair debugging”, where two or more people work together to find issues in code, is a strong tool for finding challenging bugs. However, traditional debuggers run on a solitary user’s local environment and have very limited, if any, collaboration capabilities.

    Rookout Workspaces makes deep cross-company collaboration possible. For example, customer support team members can work directly with developers in a Workspace to solve a live customer issue, or data analysts and product teams could use a Workspace to optimize the code together.

    “As a developer, every issue you’re trying to handle resides within a specific ‘space’,” said Rookout co-founder and CTO Liran Haimovitch. “The ability to tag, segment, include and exclude parts of your environment is crucial in a world of data overload, giving you just the data you need exactly when you need it, and letting you share it with anyone else who needs it too.”

    “Rookout’s Workspaces is built for a world where distributed software teams have to debug distributed systems,” said Or Weis, Rookout co-founder and CEO. “Distributed, collaborative debugging is quickly becoming a must with modern software. Workspaces let developers focus only on the environments they want based on their own business logic, and helps different parts of a company work together to safely and quickly resolve bugs.”


  • Rookout lets developers remotely debug live Electron apps while they run

    Tel Aviv – July 17, 2018 – Rookout, the rapid production debugging company, announced today its remote live debugging solution for Electron. The baked-in tool lets software engineers get full visibility into the data and code context from a live Electron app on the end-user’s machine, instead of relying on local testing.

    Electron is one of the most popular frameworks for building desktop apps for Windows, MacOS, and Linux. Originally created by GitHub, it’s also used by leading vendors such as Slack, Discord and WordPress to make more feature-rich desktop versions of their browser-based webapps. Electron apps are quick to build and typically go through many rapid deployments directly to end-users’ computers.

    Electron, despite being based on web technologies, has to face the challenges of desktop software; every user’s computer is its own unique ‘production environment’, making troubleshooting tricky, especially at a distance. Electron apps often interact with devices on the user’s system like webcams, microphones or more exotic inputs, increasing the possibility of unusual bugs.

    Traditionally, debugging Electron apps means relying on users’ bug reports and exception management tools to report problems, and then trying to recreate the production environment on the developers’ local computers. Often, though, an unusual issue won’t be reproduced, making it very challenging to identify the cause.

    Using Rookout, a software team can get debugger-level visibility from an Electron desktop app running live on an end-user’s computer. With Rookout’s IDE, a developer can remotely set non-breaking ‘breakpoints’ to see the full state of the live app or any variable state at any point in the code’s execution, while the app runs as normal.

    Rookout’s solution means software companies can debug their Electron apps live and remotely. They can be alerted to a problem by an exception manager like Sentry (Rookout can also send alerts to Sentry itself), trace the issue in the live software using Rookout in record time, and then develop and push a fix as usual, with no need to install any extra software to the end-user’s computer or send anyone on-site.

    “End-user software like Electron has to run in literally millions of distinct production environments,” said Or Weis, CEO and co-founder of Rookout. “Combined with a very rapid deployment cycle, it’s challenging to see exactly what’s going on inside a single install or reproduce an exotic bug. Rookout brings instant visibility to Electron, giving developers an unprecedented deep access to the full state of an app on an end-user’s computer, with just a few clicks of a mouse.”

    Aidoc, which makes a healthcare AI solution for analyzing medical images, uses an Electron-based app to deliver their solution to doctors.

    “Aidoc’s app runs on a hospitals’ local network and doesn’t constantly send data back to our servers, so it’s not always easy to trace a bug for a client on a different continent,” said Guy Reiner, VP R&D at Aidoc.

    “Rookout makes it possible to find bugs without spending hours on log-collection and trying to simulate the unique real-world environment of a particular hospital network”.

    “Desktop software was the classic example of something that couldn’t really be debugged in production because every install was different,” said Liran Haimovitch, Rookout CTO, and co-founder. “Being able to remotely debug live Electron apps means developers can find and fix bugs quickly, freeing up R&D resources to work on creating new features instead.”

    About Rookout

    Rookout is the Rapid production debugging solution which collects data on-demand from live code and pipelines it immediately to any destination, such as alerting and monitoring tools.

    With Rookout’s real-time instrumentation technology, a company can tackle bugs and issues without any need for coding, re-deploying or restarting the application. Rookout currently supports Python, JVM, and NodeJS on all cloud environments, including serverless applications.


  • Rookout Announces First Production Debugging Solution for AWS Lambda

    Rookout provides unprecedented access to the live states of serverless functions while they run

    Tel Aviv – June 4, 2018 –  Rookout, the rapid production debugging company, today announced the first production debugger for AWS Lambda, Amazon’s leading serverless computing platform. For the first time, software engineers will now be able to painlessly debug their live serverless functions.

    Serverless is the latest major innovation in computing infrastructure, growing at an estimated 700% annually as companies seek to take advantage of the flexibility and convenience it offers. In serverless, functions are executed in the cloud without any need for developers to create or maintain virtual machines or containers. Serverless infrastructures are scalable, cheap and easy to use, with Amazon Web Services Lambda leading the market.

    The same things that make serverless useful are also barriers when it comes to development and deployment; each function runs in its own instance in the cloud, making it hard to monitor exactly how it is operating. Lambda functions communicate with various sources, from third-party APIs that can change any time to Internet-of-Things devices with unpredictable real-world inputs. To debug serverless apps, a developer has to create a test environment and try to simulate these varied sources, using guesswork and hoping for the best.

    Rookout works like a debugger on the live serverless code on Lambda in production. Using its friendly IDE, a developer can simply click on the part of code they want to instrument and then get a full stack trace or any variable state, all from the live code without stopping or changing anything in the environment. Rookout gives an unprecedented level of visibility to serverless code and how it actually behaves in the real world, not just in a simulated environment.

    “Serverless is a natural evolution path for cloud computing,” said Rookout co-founder and CEO Or Weis  “But it presents new challenges when it comes to debugging. Rookout lifts the veil and lets developers get full debug data from their production Lambda functions while they run serverlessly.”

    “The sheer speed of serverless development means that complex bugs occur in production,” said Liran Haimovitch, Rookout co-founder and CTO. “Bugs happen, and they cost a lot of money. Now with Rookout, serverless doesn’t have to be a black box; developers can see inside Lambda and find out exactly what’s really happening in production, letting them take full advantage of the new serverless infrastructures.”

    About Rookout
    Rookout is the Rapid production debugging solution which collects data on-demand from live code and pipelines it immediately to any destination, such as alerting and monitoring tools.

    With Rookout’s real-time instrumentation technology, a company can tackle bugs and issues without any need for coding, re-deploying or restarting the application. Rookout currently supports Python, JVM and NodeJS.


  • Rookout Launches Rapid Production Debugging Solution With $4.2m Funding

    The solution collects data on-demand from live code with just a few clicks

    Tel Aviv, 26 April 2018 – Rookout, the rapid production debugging solution, today announced their launch and $4.2 million funding by TLV Partners and Emerge.

    Using Rookout, a company can tackle bugs and understand issues by collecting and pipelining data on-demand, without any need for coding, re-deploying or restarting their applications.

    Tackling a bug or an issue often means writing extra code, testing it, getting it approved, pushing it to production and then often discovering that it still didn’t produce the data needed to solve the problem. This makes bug-hunting and data-exploration a long and complicated process that consumes R&D resources.

    Rookout solves this problem by letting dev teams set up ad-hoc rules inside their production code. These rules work like non-breaking breakpoints, collecting the required data without prior instrumentation. The application keeps running as normal, while the data is collected and then sent immediately to any destination such as alerting systems, monitoring, logging and analytics applications or any generic webhook. The collected data can also be viewed on Rookout’s IDE, allowing the user to close the loop within a single view.

    Already, over a dozen software companies have joined Rookout’s early adopter program and are using it on their production environments. Rookout currently supports Python, JVM and NodeJS; on AWS, Azure, Google Cloud and local servers. Rookout can be used with serverless and containerized applications, providing a vital debugging option for cloud-native code.

    Rookout was founded by two Israeli low-level software engineers, Or Weis and Liran Haimovitch. They drew inspiration from their time in elite cyber-units in Israel’s security services where they discovered that visibility of code is key for both attackers and defenders.

    While being challenged by production debugging in other projects they ran, they realized that this practice of visibility could be applied to software development more generally.

    “Fixing bugs has become coupled with the process of deploying new software,” said Rookout CEO Or Weis. “It doesn’t have to be like that. We realized that by separating debugging from the broader development process, dev teams can gain real visibility into their live code, enabling the agility and speed modern software demands.”

    Rona Segev of TLV Partners and Dovi Ollech of Emerge, joined hands to invest $4.2 million in Rookout.

    When we met the founders of Rookout, we were blown away by their vision and product depth,” Said Segev, “The shift to microservices, coupled with the rise of containers and serverless has presented new challenges and opportunities. Rookout presents a completely new approach to data collection.”

    “Rookout’s ability to grab exactly the data you need when you need it answer the challenge of production debugging across platforms” added Ollech.

    About Rookout

    Rookout is the Rapid production debugging solution which collects data on-demand from live code and pipeline it immediately to any destination, such as alerting and monitoring tools.

    With Rookout’s real-time instrumentation technology, a company can tackle bugs and issues without any need for coding, re-deploying or restarting the application. Rookout currently supports Python, JVM and NodeJS on all cloud environments, including serverless applications.

    Media Contact

    Lazer Cohen

    WestRay Communications

    lazer@westraycommunications.com

    347-753-8256