Tag: risk

  • Gremlin Adds Detected Risk Tool to Chaos Engineering Service

    Gremlin Adds Detected Risk Tool to Chaos Engineering Service

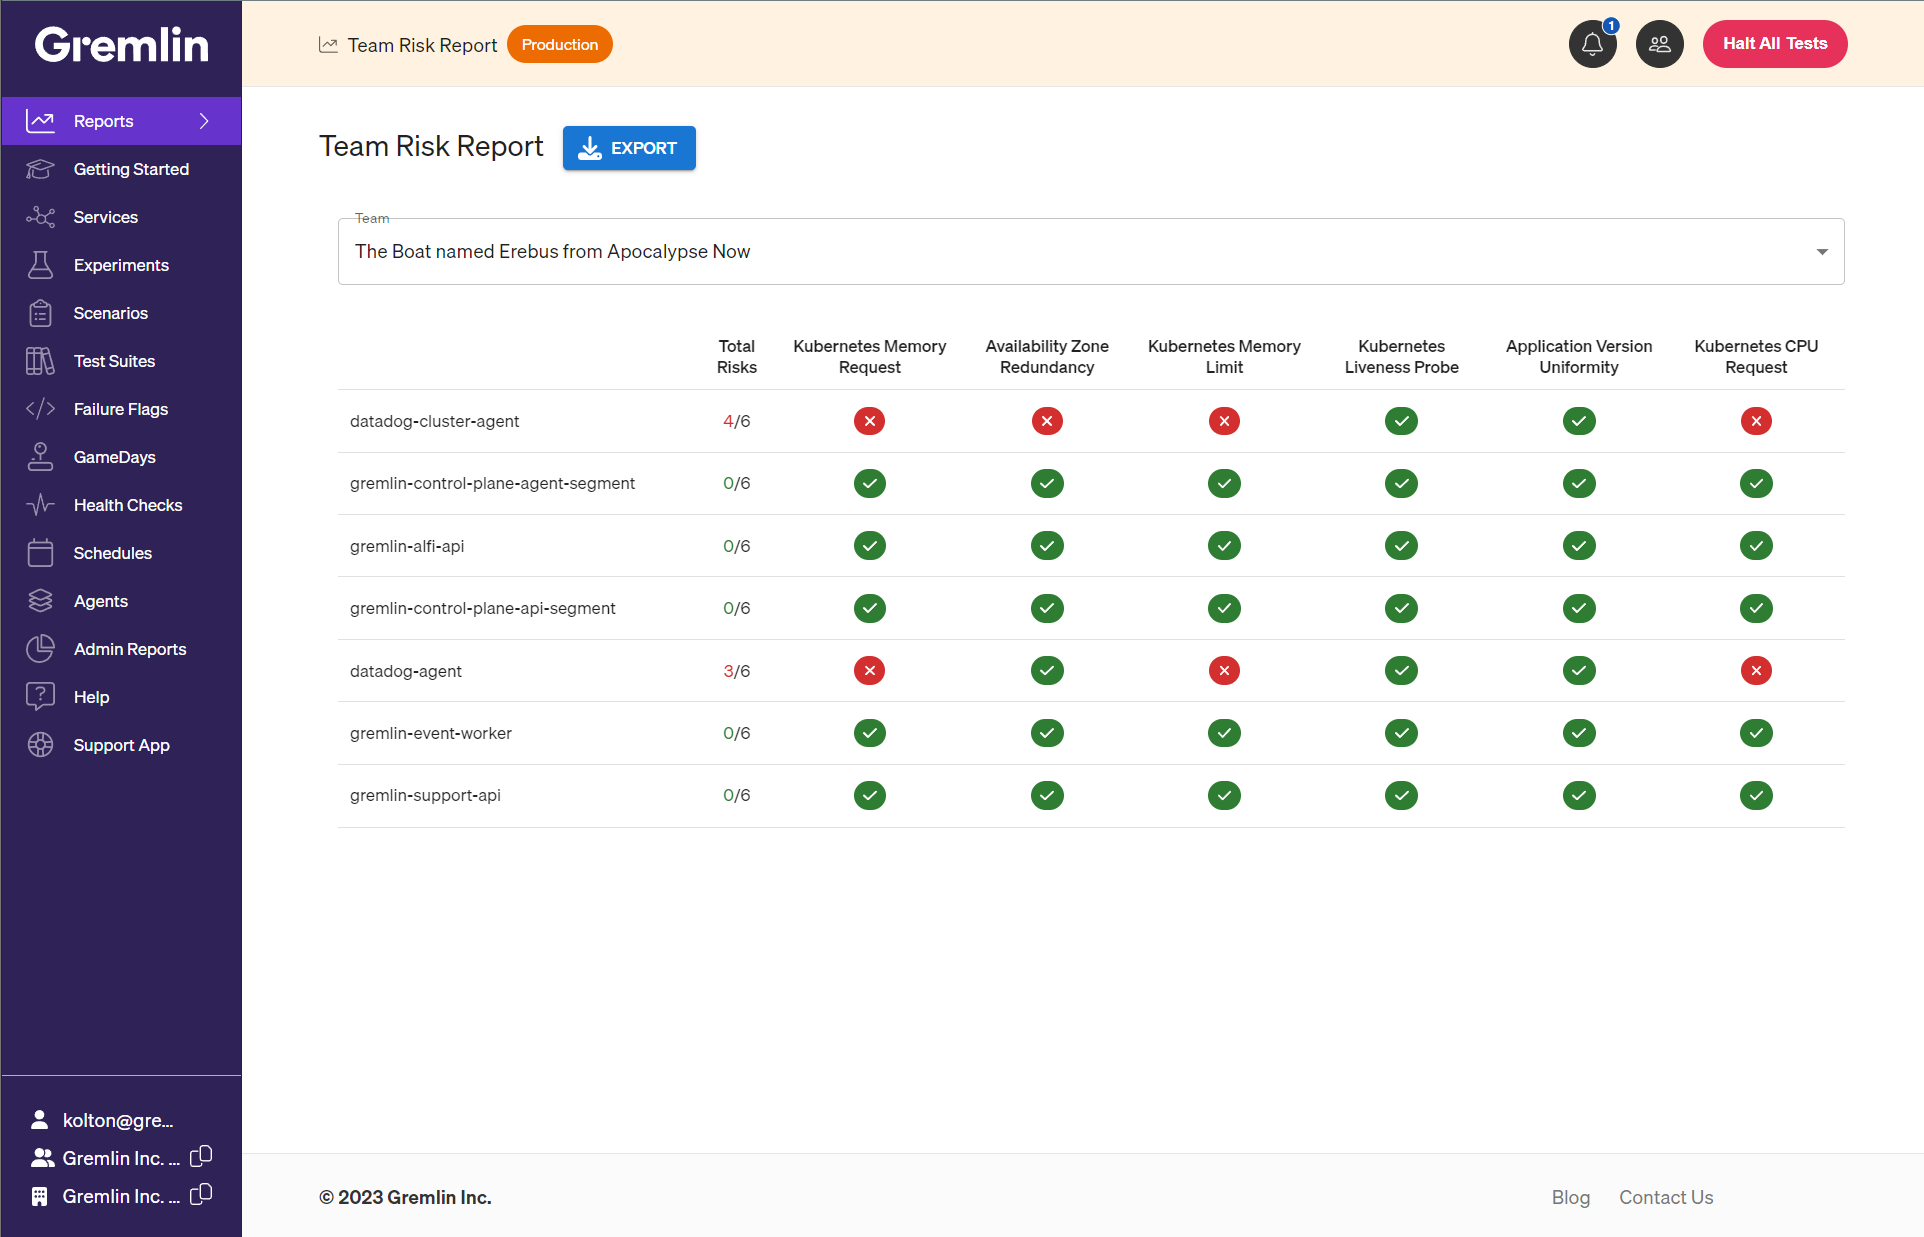
    Gremlin today added a risk detection capability to its chaos engineering service that automatically identifies issues that could cause outages along with recommendations to resolve them.

    Enabled by agent software deployed in an IT environment, the Detected Risk tool makes it possible to benefit from chaos engineering techniques without needing to construct experiments or run reliability tests.

    Gremlin CTO Kolton Andrus said that approach eliminates much of the friction that previously limited adoption of chaos engineering best practices to improve the resiliency of IT environments.

    Chaos engineering is rooted in a resiliency testing philosophy that posits applications should be able to keep functioning regardless of any service or infrastructure failure. Most IT organizations, however, don’t have the expertise required to build the tools required to test resiliency based on the “Chaos Monkey” principles—pioneered by a Netflix project by that name—that, for example, randomly turns services off to see if an application fails.

    Each DevOps team will need to evaluate Gremlin’s recommendations before implementing them, but the overall goal is to provide IT teams with a better understanding of the level of risk attached to, for example, a misconfiguration of a server. To do so, the tool uses a scoring mechanism provided by Gremlin, noted Andrus.

    The challenge is that as IT environments become more complex, the level of dependencies between applications and infrastructure continues to increase. It’s often impossible for DevOps teams to manually keep track of all the hidden dependencies that might exist when IT environments are continuously being updated.

    In theory, of course, adopting cloud-native applications based on microservices should make IT environments more resilient as calls to application programming interfaces (APIs) are rerouted in the event of an outage. Nevertheless, there are almost always dependencies that get overlooked as these applications evolve, which creates a potential single point of failure.

    Naturally, not every IT team is always comfortable with the concept of deliberately breaking things to better understand what issues might cause an outage. As organizations become more dependent on software to drive critical processes, however, a more proactive approach to ensure resiliency is required, added Andrus.

    In fact, business leaders are becoming less tolerant of outages that result in lost revenue, so DevOps teams are being held to a higher level of accountability. DevOps teams may appreciate the value of a blameless culture that encourages everyone to learn from their mistakes, but IT leaders still get fired when there are too many outages, noted Andrus.

    Less clear is the degree to which the rise of artificial intelligence might affect chaos engineering. At the very least, AI models should make it easier to assess levels of risk, but the cost of using those technologies to achieve that goal is substantial, especially when platforms that provide the same outcome already exist.

    Regardless of approach, however, when it comes to resiliency, everyone agrees that the value of application uptime is now beyond measure.

  • FAA Ground Stop due to Technical Debt? | Don’t Do DIY Crypto!

    FAA Ground Stop due to Technical Debt? | Don’t Do DIY Crypto!

    Welcome to The Long View—where we peruse the news of the week and strip it to the essentials. Let’s work out what really matters.

    This week: The FAA’s NOTAM database gets corrupted, and Threema shows why DIY cryptography is bad. (more…)

  • Best of 2022: Measuring Technical Debt

    Best of 2022: Measuring Technical Debt

    As we close out 2022, we at devopsy.kinsta.cloud wanted to highlight the most popular articles of the year. Following is the latest in our series of the Best of 2022.

    What is enterprise technical debt? Technical debt slows down organizations and hampers their ability to deliver. Studies show that technical debt can triple the cost of support for technical products and services. Beyond this, technical debt can cripple a company’s ability to make the rapid changes needed to compete in today’s marketplace. Those all describe the effects of technical debt, but doesn’t get to the heart of its definition. Therein lies the problem.

    Technical debt is a term that many in technology are familiar with but few seem to understand. Fewer still have a clear way to measure it. Are security vulnerabilities debt? What about teams or applications that have not been migrated to standard communications platforms or shared processes? And, if all of this is debt, how do you measure it?

    Technical debt is often too narrowly scoped, focusing primarily on software defects and other code-related ‘debt’. However, the technical debt that large enterprises acquire goes far beyond code and has much more serious consequences. To truly address issues related to technical debt, we need to understand it not just in terms of software defects and backlog, but also security debt, process debt and organizational debt. Once we understand the scope, we can leverage financial tools as the basis for our measurement. 

    History of Technical Debt

    The term technical debt was originally coined as a metaphor by Ward Cunningham, one of the original authors of the Agile Manifesto. He introduced the concept to justify the work his team was doing to refactor a financial application, saying, “If we failed to make our program align with what we then understood to be the proper way to think about our financial objects, then we were going to continue to stumble on that disagreement which is like paying interest on a loan.” In Introduction to the Technical Debt Concept, the Agile Alliance noted that, “ … [I]n 1992, at the OOPSLA conference, Ward provided additional details (slightly paraphrased here based on feedback from Ward): ‘Shipping first-time code is like going into debt. A little debt speeds development so long as it is paid back promptly with refactoring. The danger occurs when the debt is not repaid.’”

    So, the original definition provides a metaphor that compares the impact on companies’ ability to deliver code based on the need to refactor to the financial debt incurred on a loan. While this concept has gained wide acceptance, there remains no single agreed-upon definition nor a single way to quantify the concept.

    This concept of debt is, however, very useful as it recognizes there is a cost involved with code defects; defects impede the ability to deliver. However, in modern enterprise environments, this concept needs to be expanded to include other elements which impact the ability to deliver value to the customer, including security-related debt and even organizational debt. There are many items that can (and should) be understood as part of technical debt including:

    • Known bugs that go unfixed 
    • Problems associated with poor code quality or poor design
    • Lack of code test coverage including tests to ensure quality, security and performance
    • Code or artifacts that aren’t cleaned up when no longer in use
    • Obsolete technology that is expensive, difficult to manage and unable to meet the demands of digital transformation
    • Incomplete or outdated documentation or missing comments
    • Known security issues that need to be remediated
    • Diversified tool sets that are not aligned with organizational standards
    • Technology organizational constructs that are not aligned with organizational standards

    It is important to note that, just as with financial debt, not all technical debt should be repaid. There is a concept of “good debt” or, to further the financial metaphor, money borrowed because the opportunity for investment earnings is greater than the rate of cost incurred by the debt. If, for example, one can borrow at 3% and earn at 10%, then it makes good financial sense to accrue debt. Similarly, if the money a firm can make by introducing a new feature outweighs the cost of resolving some debt then the team should prioritize feature work. This cost calculation will often change based on the product life cycle stage, as well. During early product development, the opportunity offered by new feature development often far outweighs the potential cost associated with the risk of compliance issues. However, as a product matures and gains more customers, the risk increases and the benefit of new features may decline. This is important because we do not want to imply that all technical debt should necessarily be fixed. There are many times when the right business decision is to invest in other areas rather than in the remediation of technical debt. However, by applying economic calculations to decisions around technical debt, we can make a more informed and calculated decision based on data. 

    Risk as Technical Debt

    Of the different forms of technical debt, security and organizational debt are the ones most often overlooked and excluded in the definition. These are also the ones that often have the largest impact. It is important to recognize that security vulnerabilities that remain unmitigated are technical debt just as much as unfixed software defects. The question becomes more interesting when we look at emerging vulnerabilities or low-priority vulnerabilities.

    While most will agree that known, unaddressed vulnerabilities are a type of technical debt, it is questionable if a newly discovered vulnerability is also technical debt. The key here is whether the security risk needs to be addressed and, for that answer, we can look at an organization’s service level agreements (SLAs) for vulnerability management. If an organization sets an SLA that requires all high-level vulnerabilities be addressed within one day, then we can say that high vulnerabilities older than that day are debt. This is not to say that vulnerabilities that do not exceed the SLA do not need to be addressed; only that vulnerabilities within the SLA represent new work and only become debt when they have exceeded the SLA. 

    Organizational Debt

    Another type of technical debt often excluded from standard analyses is organizational debt and toolchain debt. These types of debt are often seen in mergers and acquisitions where the organizations are not fully integrated. If one portion of an organization does not adhere to the standard processes or organizational structure for the broader organization, this also can impact the ability of the company to deliver value to customers and represents another form of technical debt. This same paradigm can often be seen in toolchain disparity within companies. If one part of a company is using Slack to communicate while another uses Microsoft Teams, the lack of standardization can cause friction that impedes the organization’s ability to deliver. This is not to say that companies must all use the same toolset or that perfect organizational structure parity is the only way to operate—but understand that there is an ongoing cost for companies that do not standardize. Where standards have been set, they should improve efficiency. When these standards are not met, there is a loss of that efficiency; another form of technical debt.  

    If, for example, a company’s standard chat platform is Slack, that company has chosen to be standardized because they believe standard communication between all teams improves the flow of value to the customer and reduces cost through consolidated license purchasing. If that company purchases another company that uses Teams, that toolchain disparity should be considered technical debt until the platforms are unified. Alternatively, if a company is a portfolio company, there may be limited or no value in standardizing on a chat platform. It may be completely appropriate for that company to decide that the purchased company is free to use whatever chat tool they choose, as that difference will have no impact on the ability of either part of the company to deliver value.

    Mik Kersten discusses this type of debt in his book From Project to Product where he introduces the concept of “accidental complexity” which he says “includes all of the heterogeneity in the tool stack that does not improve the flow of business value. Tools inherited as a result of mergers and acquisitions, or independent selection of similarly functioned tools due to a lack of centralized governance, fall into this category.” He goes on to say that “[r]educing the accidental complexity of tools should be an ongoing effort, as this is a form of value stream debt.” 

    It is important to note that, while many mergers and acquisitions can bring with them significant technical debt, discontinuity in organizational structures or toolchains do not necessarily equate to technical debt. Whether this type of organizational misalignment is construed as technical debt depends, to some extent, on the company merger and acquisition strategy. For companies where there are standards around organizational structure and tooling where some of the benefits of the merger or acquisition are based on the assumption of integration, unintegrated processes and tools should be considered technical debt if they are not remediated within the timeframe projected by the integration business case. If, however, a company is a portfolio company and takes a federated approach, then it is completely acceptable to leave processes and tools unintegrated and these should not be considered technical debt. Organizational technical debt only occurs when tools and processes do not meet standards that align with organizational strategy. 

    By looking across the enterprise, we recognize that there are many forms of technical debt including software debt, organizational debt and risk-related debt. It is important to consider all of these forms of debt. Given this broader understanding of technical debt, we can re-define technical debt as: 

    Unmet demand for technical resources which reduces the ability to deliver value to customers or increases risk. 

    Calculating Enterprise Technical Debt

    With this expanded view of technical debt and the understanding that it can include software defects, organizational complexity and toolchain heterogeneity, we can begin to look at ways to measure technical debt. 

    Quantification of each type of technical debt presents unique challenges. However, the term technical debt itself provides a useful starting point for how to measure all of these. The term technical debt implies a cost and each of the types of debt we have discussed can be quantified in monetary terms—giving us an overall debt cost for a large organization. 

    Interest Rate of Technical Debt

    From a financial perspective, what we are looking at when we are calculating the cost of technical debt is the interest rate on that debt. That is, how much does the technical debt cost an organization over a given period of time? Ward Cunningham discussed this concept in his video on the debt metaphor when he says, “With borrowed money, you can do something sooner than you might otherwise, but until you pay back that money you will pay interest.” Organizational complexity may create delays in developing new products and these delays can be calculated as lost revenue. Unmitigated risks may cost the software due to security breaches and the associated impact on that brand. As time goes on, these costs continue to grow. 

    This is useful because it is also possible to calculate the cost to mitigate the debt. For example, the cost to mitigate a software defect is simply the cost to fix that defect. It is important to note that the cost of mitigation may change over time. The cost to fix a software defect goes up the farther away from creation we get, as familiarity with the worked segment decreases. So we must calculate this cost based on a specified point in time. If we understand the cost of mitigation, we can then look at the cost of debt and weigh that against the cost to mitigate that debt. That helps us to make informed business decisions about the return on investment for remediating technical debt. 

    Software Debt

    While this economic approach to measuring technical debt gives us a common framework for approaching debt, different types of debt still require different measurement approaches. The cost of software-related debt can include defects, unneeded complexity and lack of documentation as well as code that is no longer used but which remains in an application. All of these increase the cost of code maintenance and changes and that may also cause incidents and even outages. We can therefore calculate the cost for this type of debt relatively easily by looking at the cost of support activities related to the issue and adding that to the impact on productivity for the development of new code. The cost of the debt can also be easily calculated by looking at the time and resources required to fix the problem. 

    For example, at one large educational company, there was a bug in the code that caused load spikes. Once or twice a week, the entire team needed to jump on an incident bridge to remediate the load issues by restarting application servers in sequence. Because the application was old, the location of the defect was unknown and difficult to troubleshoot. However, it was easy enough to estimate that the cost to fix the issue would not exceed a couple of weeks worth of effort. As an estimate, let’s say this work would cost $10,000 to mitigate. Comparatively, due to the issue, the entire team, incident management and operations center took one to two hours per week remediating the impact. Let’s estimate this cost at $2,000/week. Based on this high-level analysis, it is clear that the ROI for fixing this defect would be realized five weeks after fixing the bug. 

    Risk Debt

    The cost of risk-related debt is somewhat more complicated to calculate but we can, again, use dollar values as a basis for our calculation. These sorts of debts include security risks as well as compliance-related risks. One of the reasons it is difficult to determine the cost of risk-related debt is because risks do not always become reality. That is, just because there is a risk of a security breach does not mean there will be a security breach. The very fact that it is a risk implies that there is a chance of something happening; it is not a certainty. However, risk analysis provides a very useful tool for calculating this sort of value in the form of annual loss expectancy (ALE). Annual loss expectancy is a means of measuring the expected financial loss during the period of a year. It is calculated by multiplying the expected loss by the probability that it will happen in a given year, or:

    ALE = SLE * ARO

    where SLE is the single loss expectancy, or the amount of loss if the risk occurs ,and ARO is the annualized rate of occurrence, or percent chance that the event will occur in a year. So, if the expected loss due to a given breach would be $100,000 and that type of breach is likely to occur once every five years—giving it a 20% chance of happening in any one year—the ALE for that risk would be $100,000 x 20% = $20,000. Because this number estimates the potential loss due to a risk, it serves as a valuable estimate of the interest for technical debt in the form of that risk.

    Similar to software defect-related debt, the value of the risk-related debt can be calculated as the cost to remediate the risk. This might include activities such as patching outdated systems, software changes to prevent hacking or even process changes to remediate compliance-related risks. For each of these cases, we can look at the cost of resources to remediate the issue and weigh this against the ongoing interest, expressed as ALE, to determine if the investment should be made to remediate the risk. 

    Organizational Technical Debt

    Organizational technical debt is the debt caused by organizational structure, processes and tools that do not align with the standards of the organization and which create delays in the delivery of value to customers. This is frequently seen in mergers and acquisitions where two separate organizations are brought together. Until and unless these organizational structures and tools are aligned, as in our Slack versus Teams example, there may be misalignment which makes it more difficult for the company to deliver as a whole. One way to think about this type of debt is the lack of alignment within tools and ways of working that impedes the flow of value. The “accidental complexity” described by Mik Kersten is a great example of organizational debt. 

    Organizational debt can be measured in terms of the cost of delays in delivering value to the customer. If, for example, handoffs between teams are taking a long time because they are using different development platforms, this delay can be measured and then quantified by the cost of delay. With this type of debt, it is also possible to look at the cost to overall productivity. If the productivity of the organization is negatively impacted because of a proliferation of communication systems that hampers the flow of information, then the cost of the impact to productivity should be calculated; this represents a lost opportunity and another form of technical debt. 

    As with development-related debt and risk-related debt, the cost of the debt itself can be estimated by the cost to remediate the organizational debt. This provides a useful mechanism for determining if the investment should be made to remediate the debt.

    Conclusion

    For large enterprises, the scope of technical debt is expansive. There are many types of technical debt and different methods to calculate the cost of the debt as well as the interest rate on that debt. Software-related debt must be calculated by the impact to the customer or impact to productivity of the people working on the software. Risk-related debt can be calculated by looking at the ALE of that debt. Organizational debt can be calculated by looking at delays in the delivery of value to the customer.

    All this information comes with a lot of uncertainty and a lot of calculations to consider. What is certain is that there are tremendous costs associated with technical debt. The interest on that debt is being repaid every day even if organizations are not aware of it. While it may not make sense or even be possible for enterprises to truly know the full extent of their debt or the amount of interest they are paying, by looking at the cost to remediate and the cost of the interest, we can at least quantify the impact and make calculated decisions based on return on investment for the work necessary to remediate technical debt in the enterprise.

  • What Donuts Teach Us About DevOps and Delivery Risk

    What Donuts Teach Us About DevOps and Delivery Risk

    Today, most DevOps teams do not think too much about their approach to risk. Usually, the typical attitude focuses on what to add to reduce risk further. In other words, “Can we add more tests? Can we deploy more carefully?” More tests, more processes and less risk are all obviously good things. Or are they?

    As a programmer, I’ve seen a lot of projects where there are so many tests and so many processes that they actually become counterproductive. Those ‘overheads’ presumably do reduce risk, but nobody knows by how much. I call this attitude ‘blind risk avoidance.’ This line of avoidant thinking usually builds up over time as we react to failures. It’s a very natural reaction.

    But when risk avoidance becomes your standard modus operandi, your delivery cycle gets slower and slower over time. Your team starts to feel they are trapped in molasses but, as time goes on, they not only gradually train themselves to tolerate this but to actively justify that it’s a good thing. In the meantime, nobody pays attention to the fact that your software is losing a competitive edge and that you’re being out-innovated and out-executed by others. Nobody pays enough attention to engineering team attrition; losing people as they drop off, one-by-one to move to more modern software development teams with less baggage. The ultimate conundrum lies here: If you move too fast, you break things. But if you move too slowly, your business and your team are doomed.

    So what is the optimal approach for DevOps teams to take when it comes to risk? The truth is, neither extreme is desirable. Blind risk avoidance leads to a failure of value delivery. On the other hand, blindly ignoring risk means crashing and burning.

    The ideal balance lies in not avoiding risk entirely or ignoring the reality of risk. Instead, a sensible middle ground can be found in taming risk.

    Moving forward, DevOps teams and developers must focus on taming risk to deliver software confidently with data-driven actions, speed and quality. 

    Automation Can Reduce Operational Overhead

    Taming risk should become a larger part of DevOps culture. One of the most famous ways this approach has been adopted is by Google’s site reliability engineering (SRE) team. 

    Google’s SRE team embraces two key principles when it comes to taming risk: Automation for reduced operational overhead and structured and rational decision-making for better, data-driven choices.

    To explore this mindset of risk-taming at Google, let’s dive into how the SREs use automation to slash waste, save time and reduce repetitious, low-value tasks and tests. 

    At Google, SREs are software engineers with an extremely low tolerance for repetitive, reactive work. (Aren’t we all?) But here’s the difference at Google: Thanks to a workplace culture of taming risk, operations that do not add value to a service are avoided or automated away.

    The vast majority of DevOps teams hold the same beliefs as Google: That automation cuts down on waste and saves everyone time.

    We all know automation allows for lower operational overhead, frees up software engineers to proactively assess and improve the services they support and boosts team morale. No one wants to spend their time or energy on repetitive, low-value tasks. Automation frees up DevOps teams to expend their energy on what matters most: Continuous quality.

    Bottom line? Automation is integral to the idea of taming risk. Automation of repetitive, low-value tasks is the perfect way to embrace a mindset of taming, not avoiding or ignoring risk entirely.

    Data-Driven Decisions

    Another way that Google’s SRE team tames risk is through structured and rational decision-making based on data. 

    Data-driven decisions are crucial to the success of any software engineering team, project or mission. Without proper data and feedback, there’s no way for software engineers to make the best, most calculated decisions and mitigate risks. 

    A data-driven decision methodology can—and should—be applied to DevOps testing cycles. 

    Another key aspect of data-driven decisions that speaks directly to the concept of taming risk? Service level objectives (SLOs).

    A service level objective is an element of a service level agreement that measures the performance of the service provider. SLOs are created (and agreed upon) between the service provider and the customer and help to mitigate disputes between providers and customers.

    Now, let’s take the concept of SLOs and apply them to engineering and QA teams.

    In traditional organizations, engineering and QA are forced to interact intentionally with a healthy amount of tension. One team produces software and the other team tears this software down. While this kind of necessary and healthy conflict between teams can lead to better results, the inherent push and pull between engineering and QA can create an excess of interorganizational infighting.

    Engineering teams will always advocate for more velocity or blind ignorance of risk, above all else. On the flip side, QA will always advocate for quality, or blind avoidance of risk, above all else.

    Of course, neither side is entirely correct (nor incorrect).

    Instead, the solution to this tension lies somewhere in the middle: The taming of risk, not ignorance or avoidance of risk. This is where an SLO, or the numeric target that represents ‘somewhere in the middle,’ comes into play. For engineering teams focused on velocity and QA teams focused on quality, creating an SLO—a happy medium to work toward with regard to risk—will create a more balanced workplace culture. In short, this approach can be considered a taming of risk.

    ‘Donut’ Slow Velocity

    Now, we’re finally going to get to the donuts. To demonstrate how embracing a mindset of taming, not avoiding, risk can create better, happier and faster DevOps teams, let’s take a look at Krispy Kreme Donuts.

    Krispy Kreme churns out millions of delicious, hot, glazed donuts every single day. However, during production, it’s inevitable that one or more of those donuts will be flawed. (I know, you’re asking, “Is there really such a thing as a flawed donut?!” For the purposes of this analogy, let’s say yes, there is.)

    One common donut defect occurs when the donuts bunch up on the production line and clog it.  Now, let’s assume this common error is caused by the speed of the line. If the Krispy Kreme team attempts to solve this problem by pushing the line even faster, tolerance gets smaller and the risk of even more smashed, defective donuts only rises. That’s certainly not a solution to this issue.

    On the other hand, if the Krispy Kreme team slows down the donut production line speed, there will be a smoother—albeit slower—operation.

    Is Krispy Kreme better served by slowing down its entire production line and sacrificing its velocity to eliminate the risk of a potential defective donut? Of course not! 

    If that’s not true, then is Krispy Kreme better served by cranking up their production line speed to go as fast as possible, regardless of the risk of defective donuts? Again, of course not!

    For sweet success, Krispy Kreme must embrace a mindset of taming risk. By baking careful measurement and an iterative feedback loop into their donut production process, Krispy Kreme is better able to create delicious, high-quality donuts at an optimal speed, producing some flawed donuts. This balance of speed with quality creates the best economic outcome and the mindset and measurement allow for a constant evolution to risk-taming in the future. As the production line changes, the optimal speed also needs to evolve.

    DevOps teams should take this same approach. Tame the risk without sacrificing speed and quality. ‘Donut’ slow velocity to fix a few minor issues!

    If you’re still not convinced, here’s another way to think about taming risk that is decidedly less delicious than warm, glazed donuts: Taxes. 

    The IRS balances velocity and accuracy during tax season as they process millions of tax reviews. While suspect returns are flagged for audits, the IRS simply cannot catch every single flawed tax return. It’s not economical or even possible to run detailed audits on every single problematic tax return, every single year.

    So, instead, the IRS tames its risk with automation and data-driven decisions. The IRS focuses on creating and using methods to detect patterns that correlate with flawed tax returns. Then, once these data-driven problem returns are detected by automation, experts can devote their precious time and mental energy to tackle the biggest of the problematic returns. 

    Again, this approach to taming risk creates an inherent balance between quality and speed and allows for an evolution of the process as economic activities and laws evolve.

    Whether you love eating donuts or doing your taxes, the bottom line is clear. Most organizations need to balance potential risks with maintaining speed, quality and team morale. DevOps teams are no different. 

    How to Tame Risk in DevOps Teams

    So how can we, as DevOps teams, tame the risk?

    The basic idea here is to do smarter testing, not just more testing. The good news is that if you have a reasonable level of automation, the data coming out of your existing automation can make your testing smarter. Approaches like predictive test selection can let you spend your computer hours more meaningfully, allowing you to improve speed and quality at the same time. Approaches like flaky test insights can let your precious engineering resources focus on the most impactful effort to improve the quality of tests.

    The Power of Taming Risk

    What is the right balance between speed and quality? This is the constant question DevOps teams face. But, here’s how I answer this riddle: Taking calculated risk is the most logical and rational approach in the workplace.

    It’s easy to avoid risk. Anyone can skirt around potential pitfalls by avoiding new solutions and sticking to the same old methodologies. But it’s so much more satisfying to take a calculated risk rather than ignore or avoid the risk outright. 

    If you want to improve the velocity and the happiness of your DevOps team, it’s time to embrace a new mindset: Tame the risk, gain control.

  • Secure Software Summit: Reachability and Risk for Security Leaders

    Secure Software Summit: Reachability and Risk for Security Leaders

    It is impossible to manage security posture without considering two key factors in any potential vulnerability or security flaw: Reachability and risk. The two factors are related. Reachability defines the degree to which a given security vulnerability that is detected, such as a CVE, can actually be attacked and exploited to gain privileged access and directly or indirectly access critical systems or data. Risk is a business measurement that assesses the potential for a vulnerability to actually damage an enterprise or organization. In general, without reachability, there is less risk. 

    How to Think About Reachability

    Reachability and risk have dramatically shifted in recent years as we have moved from a hard perimeter “fortress” approach to security to more distributed systems, APIs, cloud computing, SaaS and far more potential points for attack ingress and exfiltration egress. To mitigate this new risk landscape, we have actually moved to fortify all the newly exposed internal elements and the critical systems of security. We have built a new perimeter around identity, with authentication and zero-trust. We have built perimeters around connected devices, around our cloud infrastructure and our virtualized environments and our configuration of all these systems. At every point where there is a potential for risk, you need to think about fortifying the new mini-perimeters. 

    A key aspect of risk and reachability that we have spent less effort on is the human aspect. We do not yet consider people as a perimeter to be defended, even though people comprise the most reachable vulnerability. As people, we create flawed software. We misconfigure our infrastructure, our security tools and our authentication systems. A key part of the new mindset of reachability must be better accounting for and mitigating the risks of people. This means simplifying their decision trees, either through better systems or better design, and by helping them become a better gray-matter perimeter. 

    Due to the atomization of our IT and application environment, and the resulting miniaturization of our security fortresses, we have created a far more granular surface. In some cases, such as through segmentation, we have enhanced security and reduced risk; in other cases, we have added complexity. Without a doubt, we now have many more points of contact and a broader attack surface exposed to the world. A critical consideration when assessing reachability is how far each of those points can be exploited, and to what breadth and depth—looking at horizontal traversal and immediate compromise of critical systems or subverting supply chain and other pivotal subsystems for subsequent attacks. The miniature fortress mentality is a useful framework for thinking through the potential attack surface and putting in place the right controls, at the right places, to address reachability.

    Risk Scoring and Reachability

    So what is the interplay between risk scoring and reachability? We cannot say no to new technologies that introduce more complexity, and potentially more risk, if our end users are demanding them. We need to better manage how risk scores are created and applied to help people perform better in this environment of greater complexity. 

    Today, the responsibility for understanding the complete security picture and applying the proper context to decision-making and judgments has grown more widespread. Everyone who is deploying, using, building or designing applications and technology environments must be constantly thinking about the security implications of whatever project or code they are working on. The lens for those implications is not only at the application or system or infrastructure level but for the general well-being of the business. This means a broader understanding of risk scoring driven by reachability and criticality and taking into better account the implications of reachability and attackability. 

    In cybersecurity, there is no shortage of risk measurements. Injecting reachability into the scoring process is a way of framing vulnerabilities to prioritize which of these issues are likely to be an actual risk. It is possible to have something that comprises a major business risk but have a very low reachability context, which may lead a security team to treat that vulnerability differently. 

    Broadly speaking, however, it is insufficient to make decisions solely based on programmatically generated risk scores. Any risk score is a reflection of the system generating the score, and how that system was tuned, either by the vendor or by your team. It is important to always remember that any risk score involves some subjective judgments. This is necessary, but injects opportunities for drift and bias that may skew scores in ways that leave you less secure.

    To be clear, risk scores serve a crucial purpose in application security. Risk scores help you reduce the noise and find signals amidst the flood of CVEs and vulnerabilities and alerts. In fact, there is today so much noise around security that any effective team relies on multiple layers of noise reduction in their decision chain and prioritization and policy efforts. Where risk scores fail is with the inability to map accurately to business risk or by inaccurately reflecting the reachability of any CVE or other reported issue. This requires security teams to build their own internal and mental models of risk, modeling threats against the most critical systems and creating context that can be used to verify decisions by the risk scoring systems. Knowing how data flows through applications and infrastructure is crucial if a human agent can quickly judge the reachability and attackability of any given vulnerability presented or recognize when the automated risk scoring engines may not accurately reflect business risks. 

    In effect, there are two different processes at work: Calculating risk and contemplating risk. Calculating risk is programmatic and automated; human-guided, initially, but driven by models applied against the mass of vulnerabilities surfaced by security testing tools like software composition analysis, static application security testing, fuzzing and linting. Contemplating risk is a more holistic exercise that leverages the human capacity for intuition and innate knowledge of systems driven by experience and hard-won insights. 

    Contemplation is what will help security teams identify undetected biases, guide threat modeling to better consider drift and highlight areas where human breakdowns might have augmented risk in ways that a risk scoring system could never capture. Above all, contemplation is about context. The more context a human actor has, the better they can understand the big picture. The greater the understanding of the big picture, the better decisions people make. This must also flow through and inform the models and the risk scoring engines so that the value of contemplation is captured in the calculation. 

    Using Risk Scoring Tools to Minimize Reachability and Attackability

    A security team must constantly measure the efficiency and efficacy of all security tooling. The general rule is that security controls lose efficacy over time as vendors lose focus or fail to account properly for emerging classes of threats. When you have a security tool that generates risk scores in tune with your reachability guidelines and proves accurate, you should elevate that system to a higher level of trust and give more weight to its findings. That said, even tools that generate risks you think are accurate and perform well must be constantly evaluated and cross-checked. 

    Unfortunately, it only takes a small amount of drift to open up an organization to potentially catastrophic attacks. A critical part of this calculation is ensuring that humans stay on top of how the risk scores are created and continue to influence the scores to fight drift. Drift is natural but it is not inevitable. Your code and environment are constantly changing, This may result in changes in reachability which can materially impact your overall risk posture and should alter the way you approach different systems and risks. An automated risk scoring system may not understand that a new type of supply chain attack might result in subsequent related attacks on similar components in other operating systems, to name one example. Human intelligence and contemplation, really, is the secret ingredient that makes risk scoring tools far more valuable and reliable.

    Takeaways: Atomized Systems, Reachability and Risk and Humans

    The environment and application landscape will continue to atomize further as we move into new infrastructure paradigms like edge computing and all systems on the network gain capacity. For this landscape, security teams and the developers they work with on shifting left should:

    • Recognize that we have shifted from a global perimeter to an atomized constellation of mini-perimeters and shift their mindset to consider security and building fortresses at the micro level as a key way to reduce reachability and risk
    • Developers and security teams need to assess the systems they build and protect on the basis of reachability and risk to properly prioritize. Risk scoring tools are useful elements for reducing noise but cannot supplant human intelligence to gut-check risk decisions
    • All along the way, humans have to continue to guide and inform these risk scoring systems and ensure that risk scores do not become blind proxies for criticality and importance. Allowing automated risk scoring to dominate the decision process can make security drift more dangerous and allow human error to go unrecognized, leaving applications and infrastructure both reachable and at risk.

    This article was co-authored by Bryan Smith, CTO, RiskLens and Rob Lundy, director of product marketing, ShiftLeft.

    About Secure Software Summit
    The Secure Software Summit brought together the world’s leading innovators, practitioners and academics of secure software development to share and teach the latest methods and breakthroughs on secure coding and deployment practices. If you are about developing, releasing and securing software, delivering new features fast and building things right from the start, click on the link below to get access to all of the sessions from this summit.

    https://go.shiftleft.io/secure-software-summit-2022-replay

  • Fixing Risk Sharing With Observability

    Fixing Risk Sharing With Observability

    Incentives are mismatched among SREs, SecOps, and application developers. These mismatches create challenges around how and what information is shared across siloed teams. This asymmetrical information creates a moral hazard where one team can shift deployment risk to another team, with no accountability back to the originating team. Risk shifting results in unstable applications, inefficient infrastructure, security issues and poor customer experience. All of that impacts your company’s bottom line.

    Closing the Information Gap

    Observability is positioned as a way to fix the information gap between these disparate groups. Observable systems allow users to ask questions about their behavior in an open-ended way, unlike more rigid monitoring systems. SREs and SecOps teams are already reaping benefits from observability, but mismatched incentives limit its effectiveness. Meeting the observability expectations of IT leaders requires pervasive instrumentation across applications, infrastructure and third-party software. Delivering that level of instrumentation has remained out of reach due to incentive mismatches, as well as human and infrastructure costs.

    The main incentive for developers is shipping code quickly at a reasonable level of quality, meaning a low bug count. This contrasts with SREs, who are incentivized around uptime, performance and efficiency, while the incentives for SecOps teams are around risk reduction and breach mitigation.

    risk sharing observability

    Since SREs and SecOps teams don’t have insight into what developers have changed, it’s easy for performance or security problems to get thrown over the fence to operations. A fresh code push might only include minor changes and be harmless to existing operations. Or, it could replace large chunks of logic across the entire codebase, including adding calls to external and third-party applications. To the intrepid SRE and SecOps teams, one change looks like any other. They don’t get a peek behind the curtain because of the mismatched incentives. DevOps wants to deploy quickly. Waiting on approval from other teams slows down deployments, so comprehensive reviews don’t happen. This doesn’t mean DevOps teams are intentionally trying to sabotage partner teams. They’re simply acting in their own interests based on their incentives.

    The challenge is that one party, the developers, has more information than other parties. That information asymmetry is what creates unbalanced risk sharing. Coping with information asymmetry has led to all kinds of new collaborative models, starting with DevOps and evolving into DevSecOps and other permutations like BizDevSecOps.

    True collaboration has been hard to come by. Early DevOps efforts are often successful, but scaling beyond five to seven teams is difficult because teams lack the breadth of experience in IT operations or the SRE capacity to staff multiple product teams. The change velocity DevOps teams can achieve is often far greater than SREs and SecOps can absorb, making information asymmetry worse.

    If teams can’t maintain high levels of collaboration and communication, another option must be developed. Observability practices, like collecting all events, metrics, traces and logs, allow SREs and SecOps teams to interrogate applications about their behavior without knowing which questions they want to ask ahead of time. However, observability only works if applications, and the infrastructure they rely on, are instrumented. This creates another problem: who does the instrumentation?

    The expectation is DevOps teams embed instrumentation into their code as part of the development process. While that’s a nice idea, there are four reasons this falls short. First, the quality of instrumentation varies. Many log statements are terse and only understandable by the developer that wrote them. The message “In function xyx123!” isn’t helpful to an SRE digging into a performance problem that cropped up in the latest release.

    Second, instrumentation libraries vary by implementation, giving inconsistent results across language bindings. OpenTelemetry is trying to improve this, but its progress is slow and still requires developers to do more work that, if we’re honest, doesn’t benefit them; it benefits SREs and SecOps. Now we’re back to those pesky mismatched incentives and information asymmetry problems again.

    The third problem with instrumentation is the volume of data. Each instrumented application can produce terabytes of data each day. When you have robust instrumentation, the amount of data can be overwhelming, and extremely costly to analyze and store.

    Lastly, instrumentation is isolated to the code your team wrote. That represents a fraction of the code you rely on. Vendor-provided services and APIs remain a black box, limiting your observability into those components.

    Resolving information asymmetry across teams requires two things:

    1. Pervasive, pluggable instrumentation capabilities for all code that doesn’t require developer involvement, and
    2. An observability pipeline to filter, redact and enrich data, then route it to your analytics platform of choice.

    Pervasive Instrumentation

    Operations teams need instrumentation without having to go back to developers and beg them to add it to existing code. They need to turn it on and off as needed, and they need readily consumable data. They also need every piece of data they can get, including packet payloads, insight into encrypted data and so on. This goes well beyond what’s possible with today’s instrumentation options.

    AppScope, a newly released open source project, is a new take on instrumentation. AppScope interposes itself between application threads and system libraries, tracking things like file system access, network and HTTP activity, as well as CPU and process activity. It also provides payload data, and because it sits between the application and encryption libraries, it also gives access to users’ cleartext data. Because it works with any Linux binary, SREs and operations teams can instrument anything, even code they didn’t write.

    Observability Pipeline

    The challenge with pervasive instrumentation is dealing with all the data generated by applications. Network, file system, and other system data can easily swamp destination APM and log analytics platforms, driving up licensing and infrastructure costs. While instrumentation data is vital to rebalancing risk sharing in organizations, you need a way to manage that data intelligently to get value out of it. This is where the observability pipeline comes in.

    An observability pipeline sits between the sources of observability data and its target destinations. By acting as a strategic control point, the pipeline gives users control over how data is formatted, filtered, enriched, and redacted before it is routed to one or more destinations.

    Observability pipelines help SREs and operations teams deal with the flood of instrumentation data by routing low value data to low-cost storage, like S3, while higher value information lands in APM and log analytics tools. Later, if you decide you need the data stored in S3 to add more context to your analysis, you can replay it back through the pipeline and enrich your data set.

    Shifting business priorities are accelerating the pace of technology deployment across organizations, and teams are pressured to deliver faster. This faster pace of delivery pushes deployment risk to operations and security teams that lack visibility into changes developers have made across complex distributed systems. This information asymmetry also increases risk to the business as applications become less predictable and reliable over time.

    Traditional methods of resolving the information mismatch haven’t worked because incentives across teams aren’t aligned. Adopting pervasive instrumentation and observability practices will give SREs and operations teams critical visibility into rapidly changing application and infrastructure environments, without disrupting the developer experience and process.

  • Low-Risk Monolith-to-Microservice Evolution, Part 1

    Low-Risk Monolith-to-Microservice Evolution, Part 1

    In designing and organizing a two-day workshop on microservices, I’ve been thinking a lot about how to explain monolith application decomposition and what a transition to microservices might look like. This is a small subset of that material, but I wanted to share it to get feedback (in the workshop we go into more detail about whether you should even break up your monolith). This is based on my own tried-and-true real-life experience, as well as my work with the many Red Hat customers I’ve met in North America over the last few years. Part I explores the architecture, while the second part (to be released shortly) will cover some technology that can greatly help in this area.

    Before we dig in, let’s set up some assumptions:

    • Microservices architecture is not appropriate all the time (to be discussed in length)
    • If we find we should go to a microservices architecture, we have to decide what happens with the monolith
    • In rare cases, we’ll want to break out parts of the monolith as is; in most other cases we’ll want to either build new features or re-implement existing business processes around the monolith (in a strangler fashion)
    • In the cases where we need to break out functionality or re-implement, we cannot ignore the fact that the monolith is currently in production taking load and probably bringing lots of business value
    • We need a way to attack this problem with very little disruption to the overall business value of the system
    • Since the monolith is the monolith, it will be very difficult/nearly impossible to make changes to the data model/database underneath it
    • The approach we take should reduce the risk of the evolution and may take multiple deployments and releases to make it all happen

    Extracting Microservices

    If you dig into the conference/blog posts this topic, often times you’ll find it offers these words of advice:

    • Organize around nouns
    • Do one thing and one thing well
    • Single responsibility principle
    • It’s hard

    I’m afraid this advice is quite useless.

    The more useful material discusses an approach that at times look something like this:

    • Identify modules (either existing or new ones to write)
    • Break out tables that correspond to those modules and wrap with a service
    • Update the code that once relied on the DB tables directly to call this new service
    • Rinse and repeat

    Let’s take a closer look:

    Step 1: Identify modules

    You start off with some nasty monolith. In the image above I’ve simplified this to denote the different modules and database tables that may be involved here. We identify which modules we wish to break out of the monolith and figure out which tables are involved and then go from there. Of course, the reality is monoliths are far more entangled with modules conflated with each other (if any modules). More on that in a bit.


    Step 2: Break out database tables, wrap with service, update dependencies

    The next step is to identify which tables are used by the Foo module and break those out into its own service. This service is now the only thing that can access those Foo tables. No more sharing tables! This is a good thing. And anything that once did refer to Foo must now go through the API of the newly created service. In the above image, we update the Bar and Cheese service to now refer to Foo service whenever it needs Foo things.


    Step 3: Rinse and repeat

    The last step is to repeat this effort until you’re left with no more monolith. In the above image, we’ve done the same thing for the Bar service and you can see that we’re moving to an architecture in which services own their data and expose APIs—which sounds similar to what we hear about microservices.

    While this approach is generally a decent set of guidelines, it misses a lot of the fidelity that we really need when going down this path. For example, this approach glosses over the fact that we cannot just stop the world to remove tables from databases. Also:

    • Rarely do monoliths lend themselves to nice and neat modularization
    • The relationships between tables can be highly normalized and exhibit tight coupling/integrity constraints among entities
    • We may not fully understand what code in the monolith uses which tables
    • Just because we’ve extracted tables to a new service doesn’t mean the existing business processes stop so we can migrate everyone to use the service
    • There will be some ugly migration steps that cannot be wished away
    • There is probably a point of diminishing returns where it doesn’t make sense to break things out of the monolith

    – Etc., etc.

    Let’s take a look at a concrete example and what the approach/pattern would look like and the options we may have as we go.

    Concrete example

    This example comes from the aforementioned workshop. I’ll be adding some color around the splitting of the services, but there are more detailed guidelines around Domain Driven Design, coupling models and physical/logical architecture that we go into for the workshop that we’ll leave out for now. On the surface, this approach appears to deal with decomposition of existing monolith functionality but applies equally well to adding new functionality around the monolith; this may be the more likely case, since making changes to the monolith can be quite risky.

    Meet the monolith

    This is the Monolith that we’ll be exploring. It’s based on the TicketMonster tutorial from developers.redhat.com. That tutorial explores building a typical Java EE application and ends up being a good example—it’s not overly complicated but has enough meat to it we can use it to illustrate key points. In part two of this blog post we’ll actually go deeper into the technology frameworks/platforms.

    From this image, we’re illustrating that the Monolith has all modules/components/UI co-deployed talking to a single monolithic database. Whenever we need to make a change, we need to deploy all of it. Imagine the application is 10+ years old and very difficult to change (for all the technical reasons, but also for team/organization structure reasons). We would like to break out the UI and key services that will allow the business to make changes faster and independently from each other to experiment with delivering new customer and/or business value.

    Considerations

    • Monolith (code and database schema) is hard to change.
    • Changes require complete re-deployment and high coordination between teams.
    • We need to have lots of tests in place to catch regressions.
    • We need a fully automated way to deploy.

    Extract the UI

    In this step, we’re going to decouple the UI from the Monolith. Actually in this architecture, we don’t actually remove anything from the Monolith. We start to reduce risk just by adding a new deployment that contains the UI. The new UI component in this architecture should be very close (exactly?) to the same UI that’s in the Monolith and just calls back to the Monolith’s REST API. Of course, this implies the monolith has a reasonable API that an external UI could use. We may find this is not the case; typically, this type of API may resemble more of an “internal” API, at which point we’d need to think about some integration between the separate UI component and the backend monolith and what a more consumable public-facing API might look like.

    We can deploy this new UI component into our architecture and use our platform to slowly route traffic to it while still routing to the old monolith—this way we can introduce it without taking downtime. Again, in the second part of the blog post we’ll look at this in more detail; however, the concept of dark launch/canary release/rolling release are all very important here (and for subsequent steps).

    Considerations

    • Don’t modify the monolith for this first step; just copy/past UI into separate component.
    • We need to have a reasonable remoting API between the UI and monolith—this may not always be the case.
    • Security surface increases.
    • We need a way to route/split traffic in a controlled manner to the new UI and/or the monolith directly to support dark launch/canary/rolling release.

    Drop the UI from the monolith

    In the previous step, we introduced a UI and slowly rolled over traffic to the new UI (which communicated directly with the Monolith). In this step we do a similar deployment strategy, except now we slowly release a new deployment of the monolith with the UI removed. We can bleed traffic over and stop/rollback if we see issues. Once we have all traffic going to our Monolith without the UI (termed Backend from here on) we can remove the Monolith deployment completely. By separating out the UI, we’ve now made a small decomposition to our monolith and reduced our risk by relying on dark launches/canaries/rolling releases.

    Considerations

    • We are removing the UI component from the monolith.
    • This requires (hopefully) minimal changes to the monolith (deprecating/removing/disabling the UI).
    • Again, we use a controlled routing/shaping approach to introduce this change without downtime.

    Introduce a new service


    In the next step, and skipping the detail of coupling, Domain Driven Design, etc., we’re introducing a new service: the Orders service. This is a critical service that the business wants to change more frequently than the rest of the application and has a fairly complicated write model. We may also explore architectural patterns such as CQRS with this model, but I digress.

    We want to focus on the boundary and API of the Orders service in terms of the existing implementation in the Backend. In reality, this implementation is more likely to be a rewrite than a port of existing code, but the idea/approach here is the same either way. Notice in this architecture, the Orders service has its own database. This is good; we’re shooting for a complete decoupling. However, we’re not there yet. There are a few more steps we need to consider/undertake.

    This step would also be a good time to consider how this service plays in the overall service architecture by focusing on the Events it may emit or consume. Now is a great time to perform an activity such as Event Storming and think through the events we should publish as we start to take transactional workloads. These events will come in handy when we try to integrate with other systems and even as we evolve the monolith.

    • We want to focus on the API design/boundary of our extracted service.
    • This may be a rewrite from what exists in the monolith.
    • Once we have the API decided, we will implement a simple scaffolding/place holder for the service.
    • The new Orders service will have its own database.
    • The new Orders service will not be taking any kind of traffic at this point.

    Connect the API with an implementation

    At this point, we should be continuing to evolve the service’s API and domain model and how it’s implemented in code. This service will store any new transactional workloads into its own database and keep it separate from any other services. Any services needing access to this data would have to go through an API.

    One thing we will not be able to ignore: Our new service and its data is intimately related (if not exactly the same in some areas) to the data in the monolith. This is highly inconvenient, actually: As we start to build the new service, we’ll need existing data from the Backend service’s database. This could get really tricky because of the normalization/FK constraints/relationships in the data model. Reusing an existing API on the monolith/backend may be too coarse-grained and we’d have to reinvent a lot of gymnastics to get the data in the shape we want.

    What we want to do is get access to the data from the Backend in read-only mode through a lower-level API and have a way to shape the data/data model into the model that fits better with the domain model in our new service. In this architecture, we’re going to temporarily connect to the Backend database directly and query the data directly as we need. For this step, we need a consistency model that reflects a direct database access.

    Some of you may cringe initially at this approach. And you should. However, the plain fact is this approach is totally valid and has been used successfully in highly critical systems—and more importantly, is not the end-state architecture (if you think this may end up being end-state architecture, stop and do not do this). You also may point out that connecting up to the Backend database, querying data and massaging it into the right shape we need for our new service’s domain model involves a lot of nasty integration/boilerplate. I’d argue that since this is temporary in our evolution of the monolith, it’s probably OK: ie, use technical debt to your advantage and then quickly pay it down. However, there is a better way. I’ll discuss this in part 2 of this blog post.

    Alternatively, some of you might be saying, “Well, just stand up a REST API in front of the Backend database that gives lower-level data access and have the new service call that.” This is also a viable approach, but not without its own drawbacks. Again, will discuss this in more detail in part 2.

    Considerations

    • The extracted/new service has a data model that has tight coupling with the monolith’s data model by definition.
    • The monolith most likely does not provide an API at the right level to get this data.
    • Shaping the data even if we do get it requires lots of boilerplate code.
    • We can connect directly to the backend database temporarily for read-only queries.
    • The monolith rarely (if ever) changes its database.

    Start sending shadow traffic to the new service (dark launch)

    In our next step of this approach/pattern, we need a way to actually direct traffic to our new service. However, we don’t want to do a big-bang release. We don’t want to just throw this into our production traffic (especially considering that this example uses an “order” service that takes orders! We don’t want to introduce any issues with taking orders!). Although we cannot easily change the underlying monolith database, if there’s hope, you may be able to make changes to the monolith application carefully to call our new orders service. I highly recommend Michael Feather’s “Working Effectively with Legacy Code” if you’re unsure of how best to do this. There are patterns such as the Sprout Method/Class and/or Wrap Method/Class that could help.
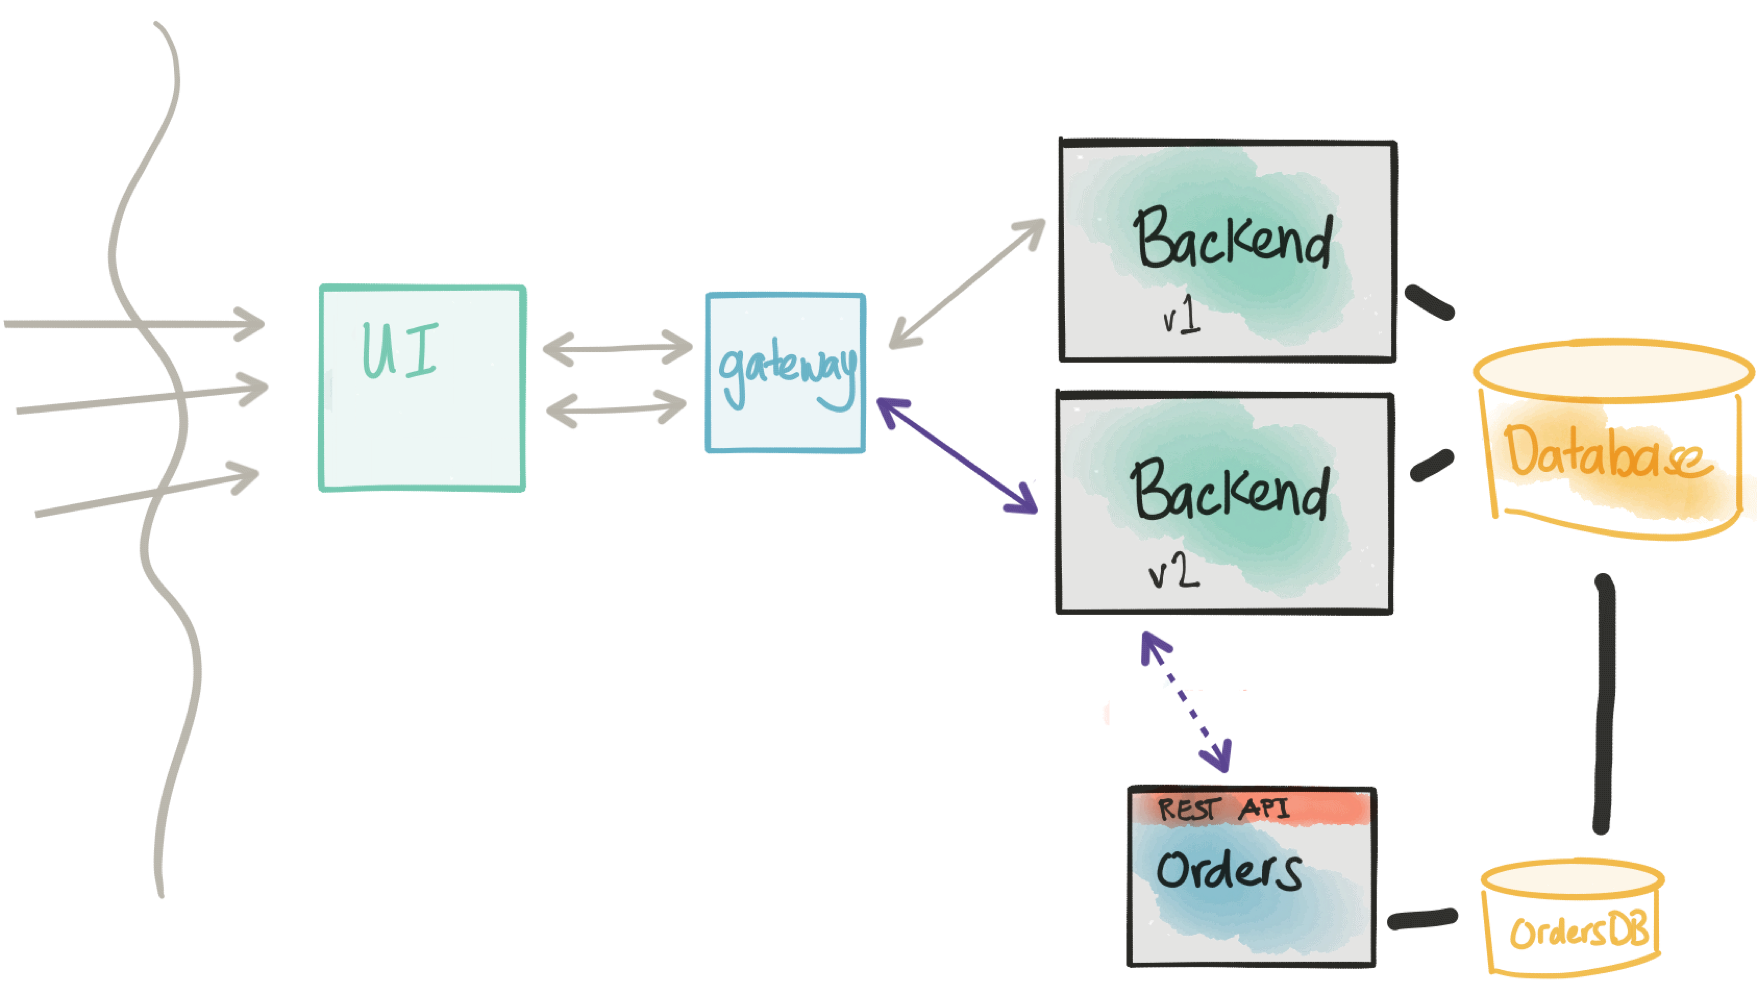
    When we make a change to our monolith/backend, we don’t want to replace the old code path. We want to put in just enough code to allow both the old or the new code path to run—potentially even in parallel—as deemed fit. Ideally, the new version of the monolith with this change will allow us to, at run time, control whether we’re sending to the new Orders service, the old monolith code path or both. In any combination of call paths, we want to instrument heavily to understand any potential deviations between the old and new execution path.

    Another thing to note: If we enable the monolith to send the execution to the old code path as well as calling our new service, we need a way to flag this transaction/call to the new service as a “synthetic” call. If your new service is less critical than in this example, an order service, and you can deal with duplicates, then maybe this synthetic-request identification is less important. If your new service tends to serve more read-only traffic, again, you may not worry as much about identifying synthetic transactions. In the case of a synthentic transaction, however, you want to be able to run the entire service end to end including storing into the database. You may take options here to either store the data with a “synthetic” flag or just roll back the transaction if your data store supports that.

    The last thing to note here is when we make our change to the monolith/backend, we again want to use a dark launch/canary/rolling release approach. We will need our infrastructure to support this. We will look closer at this in the second part.

    At this point, we’re forcing the traffic back through the monolith. We’re trying not to perturb the main call flow as much as possible so we can quickly roll back in the event a canary doesn’t go well. On the other hand, it may be useful to deploy a gateway/control component that can more finely control the call to the new service instead of forcing to the monolith. In this case, the gateway would have the control logic whether to send the transaction to the monolith, to the new service or both.

    Considerations

    • Introducing the new Orders service into the code path introduces risk.
    • We need to send traffic to the new service in a controlled manner.
    • We want to be able to direct traffic to the new service as well as the old code path.
    • We need to instrument and monitor the impact of the new service.
    • We need ways to flag transactions as “synthetic” so we don’t end up in nasty business consistency problems.
    • We wish to deploy this new functionality to certain cohorts/groups/users.

    Canary/Rolling Release to new service

    If we find the previous step does not introduce negative impacts to our transaction path and we have high confidence through our testing and initial experimentation in production with shadowing the traffic, we can configure the monolith to actually send traffic over to the new service. In this case, we need to be able to specify certain cohorts/groups/users to always go to the new service and we’re slowly draining the real production traffic that goes through the old code path. We can increase the rolling release of our Backend service until all of our users are on the new Orders microservice.

    One point of risk we need to make concrete: Once we start rolling live traffic (non-shadow/synthetic traffic) over to the new service, we’re expecting users that match the cohort group to go to this new service always. We’re not able to switch back and forth between old and new code paths. In this case, if we do need to rollback, this will involve more coordination to move any new transactions from the new service back to a state that the old monolith could use. Hopefully this doesn’t happen, but is something to note and plan for (and test!).

    Considerations

    • We can identify cohort groups and send live transaction traffic to our new microservice.
    • We still need the direct database connection to the monolith because there will be a period of time where transactions will still be going to both code paths.
    • Once we’ve moved all traffic over to our microservice, we should be in position to retire the old functionality.
    • Note that once we’re sending live traffic over to the new service, we have to consider the fact a rollback to the old code path will involve some difficulty and coordination.

    Offline data ETL/migration

    At this point, we should have our Orders microservice taking live production traffic. The Monolith or Backend is still around handling other concerns, but we have successfully migrated service functionality out of the monolith. Our immediate pressing concern now is to pay off the technical debt we’ve borrowed when we created a direct database connection between our new microservice and the Backend service. Most likely this would involve some kind of one-time ETL from the monolith database to the new service. The monolith may be required to still keep that data around in a read-only mode (think: regulatory compliance, etc.). If this is shared reference data (ie, read only) this should be okay. We must make sure that the data in the monolith and the data in the new microservice is not some shared/mutable data. If the data is shared/mutable, then we can end up in divergent data/data ownership problems.

    Considerations

    • Our new Orders microservice is now in the last throes of becoming fully autonomous.
    • We need to pay down the technical debt we borrowed when we connected the Orders service database to the Backend
    • We will have a one-time ETL for the data that should reside in the Orders
    • We need to be mindful of divergent data problems.

    Disconnect/decouple the datastores

    Once we’ve completed the previous step, we should have our new Orders microservice-independent and ready to participate in a services architecture. The steps presented here all have their own considerations, pros and cons. We should aim to satisfy all of the steps and not leave technical debt to accrue interest. Of course, there will be variations on this pattern, but the approach is sound.

    In the next blog post, I’ll show how to do these steps with the example service I’ve referred to previously and dig deeper into some of the tools, frameworks and infrastructure that helps assist. We’ll look at things such as Kubernetes, Istio, feature-flag frameworks, data-view tools, and test frameworks.

    Part 2 will follow in December

    Follow along (@christianposta) on twitter or http://blog.christianposta.com for the latest updates and discussion.

    — Christian Posta