Tag: PostgreSQL

  • Database Virtualization: Breaking Vendor Lock-In

    Database Virtualization: Breaking Vendor Lock-In

    Every enterprise is battling vendor lock-in—constantly. Ask any IT leader about what keeps them up at night and vendor lock-in is certainly near, if not at, the top of the list. And while network, storage and compute have long been democratized by virtualization, one discipline has held out as the last bastion of vendor lock-in: Databases.

    How bad can it be? Take Amazon, for example. They celebrated their retirement of the last internal Oracle database exuberantly. People familiar with the matter suggested that replacing Oracle was at least a decade in the making, probably longer. It is anybody’s guess how much effort it took to accomplish this feat. A big celebration was in order, indeed.

    Now, let’s take a look at database virtualization. As a relatively new discipline, the idea of virtualizing critical systems like data warehouses made a big splash recently. But does it apply to your systems? And the ubiquitous question: Does it come with performance penalties?

    What Is Database Virtualization?

    Database virtualization is the concept of abstracting applications and databases from each other. Using virtualization, an application written for, say, an Oracle database can run on an open source database like PostgreSQL without making changes to SQL or to associated APIs. As an aside, this is not to be confused with data virtualization—which is really a data integration play.

    A database virtualization platform translates queries and data in real-time. Through emulation, it bridges functional gaps between the source and destination system so applications remain unchanged while moving to a different database. Database virtualization doesn’t make migrations easier; it makes them effectively obsolete.

    The idea is rather compelling. So much so that Amazon developed and released their own version of a database virtualization product recently that targeted small standalone database systems.

    Why You Need Database Virtualization

    Here’s a simple rule of thumb. The cost of migrating a typical data warehouse—without virtualization—is about the total cost of the database over the next five years. So, if your current data warehouse runs you, say, $5 million a year, (which is typical for a mid-range system) your cost to migrate it will probably be close to $25 million. Moreover, the project could take up to five years.

    But wait; there’s more. The true downside of conventional database migrations is actually their abysmal failure rate. Analysts put it typically above 80%. For large data warehouse systems, it seems to be higher still. That’s what makes databases the ultimate bastion of vendor lock-in.

    As an IT leader, you naturally don’t have the time, the budget or the appetite for such a risky undertaking; you’d probably rather deploy that kind of money toward creating new revenue. Database virtualization lets you do just that: Sidestep these risks and, instead, focus on what’s really relevant.

    When to Use Database Virtualization

    Database virtualization is particularly suitable for replatforming data warehouse workloads. These workloads are notorious for their complexity and for the effort a rewrite would entail. Often, these workloads have been grown and curated for years—sometimes decades. Maintaining the workload while replatforming makes economic sense: It means preserving and protecting long-standing investments.

    However, for database virtualization to be successful, both the source and destination systems need to be of comparable performance and scale. This should be obvious: Moving a workload from, say, a Teradata system to a Postgres instance is unlikely to satisfy your business users.

    But there is good news. Over the past few years, cloud data warehouses have increasingly reached competitive performance targets. They have become viable alternatives to legacy on-premises appliances. From an IT leader’s perspective, that is great timing. Most IT leaders today are currently tasked with sunsetting these appliances over the course of the next few years. Database virtualization couldn’t be any timelier.

    Goodbye, Vendor Lock-In

    Virtualization, as a general concept, has revolutionized the IT stack over the past 20 years. Server virtualization, which started as a niche for QA and developers, became the foundation of cloud computing; virtualization then spread to network and storage. Databases are one of the few remaining disciplines that have bucked the virtualization trend—until now.

    Not surprisingly, the premise of database virtualization resonates greatly with practitioners. And even though the initial success in the data warehousing arena is yet to be replicated in other areas, it seems like it’s just a matter of time before the concept becomes ubiquitous.

  • Introduction to Materialized Views

    Introduction to Materialized Views

    More often than not, the types of queries that use materialized views are both faster, and use fewer resources than those that are still processing queries directly to base tables. But the key to understanding the potential that materialized views bring with them involves first understanding as much about them as possible.

    What is a Materialized View?

    In the world of computing, a materialized view is a database object made up of any results that were obtained from a query. Note that this could be a local copy of data that is also stored in a separate remote location, or it could have been derived from a join result. Sometimes, a materialized view could even be created after a user performed an aggregate function, thus allowing it to act as a summary of that database information.

    Oracle Database first made materialized views available in version 8i of their software, and it has been a part of every release since. Just a few of the environments that support materialized views include, but are not limited to, others like SQL Server, BigQuery, PostgreSQL and Sybase SQL Anywhere.

    View vs. Materialized View

    What’s the difference between a regular view versus a materialized view? There are a number of important things you’ll need to keep in mind.

    Chief among them, the fact that a view itself is a precise type of virtual table created via the “Create View” command. As the name suggests, it collects all data obtained from any relevant query that you’ve executed. A view will always be compiled every time it is either used or accessed in any way. This is how a view is able to make sure that you’re always getting the most updated data, no matter what – it’s literally designed to do that.

    If you make any changes to the data contained inside that view, it will get pushed out to the table in which it originated. Along the same lines, any changes made to that base table are automatically pushed to the view so that the same information is in both places at once.

    Because of this extra step, a view will always be a bit slower than a materialized view when it comes to performance. The upside is that this really doesn’t require much in the way of storage space. But it does mean that you’ll be sacrificing a bit in terms of performance.

    With a materialized view, you’re talking about a physical copy of the information contained in that original table. This means that it isn’t updated every time you interact with it – you have to go out of your way to update it manually. Or, if you’d prefer, you can have it update using pre-defined triggers.

    Because of this, a materialized view is always going to respond much faster than its traditional counterpart. However, if you don’t make an effort to confirm that it has been updated, you also run the risk of retrieving stale data.

    Why Use a Materialized View?

    So at this point, you’re likely asking yourself, “Why use a materialized view in the first place? What can this do for me that a simple view cannot?” The key thing to understand has to do with the costs that you accrue whenever a database is queried.

    Even a simple query still needs to be parsed, validated, planned, optimized and executed. In an operational sense, this equates to CPU time. This means memory usage. This even directly impacts your opportunity costs as time goes on. All of this adds up – especially as the application you’re working with continues to evolve and become more resource-intensive.

    Savvy developers are always looking for a way to cut costs, and materialized views are a big part of how they’re able to do it. Remember that the results obtained are always kept in memory – meaning that they are only updated when absolutely needed. This is the opposite of what happens when you query tables or use logical views; those results are updated constantly. Therefore, using materialized views is a great way to significantly reduce your costs without impacting performance in a way that will also affect your end users.

    Materialized Views Best Practices

    For best results, you should always make sure that your materialized view reflects query patterns against the original table you’re working with. Don’t just create a materialized view for every iteration of a query. Instead, create one to help focus on a broader set of queries.

    Likewise, if the base table you’re working with is partitioned, your materialized view may grow to a size larger than you’re comfortable with. Therefore, it should be partitioned, as well, to preserve the performance benefits it is supposed to bring with it.

  • New Monitoring Features in PostgreSQL 13

    New Monitoring Features in PostgreSQL 13

    Every monitoring solution is limited by the information the system allows to be collected. PostgreSQL DBMS provides many metrics reflecting its internal state, running queries and background processes, and each release brings the community more monitoring-related features. PostgreSQL 13, which was released in September of 2020, added key improvements, including query sampling, improved WAL usage statistics and new system views. Let’s look at the benefits of each of these new features.

    Query Sampling

    Those who regularly monitor database queries are familiar with the following parameters:

    log_statement controls what SQL statements are logged
    log_min_duration_statement enables logging of statements that ran for at least the specified amount of time.

    These parameters help users track down unoptimized queries in applications. However, it is important to recognize that excessive log traffic may impact performance, especially when analyzing workloads with a lot of short queries. To help address this, PostgreSQL 13 introduced two new GUC parameters to allow logging of sampling statements.

    log_statement_sample_rate controls the sample rate (0.0 – 1.0). That is, it allows users to control the percent of queries that are logged.
    log_min_duration_sample defines the minimum required statement duration of queries to sample

    Only statements with a duration exceeding log_min_duration_sample are considered for sampling. Because of this, to enable sampling, both GUCs need to be set correctly. Further, the existing log_min_duration_statement GUC has a higher priority than log_min_duration_sample, so statements with a duration exceeding log_min_duration_statement will always be logged, no matter how the sampling is configured. This means that only configurations with log_min_duration_sample < log_min_duration_statement actually sample the statements, instead of logging everything. Note that only superusers can change these settings.

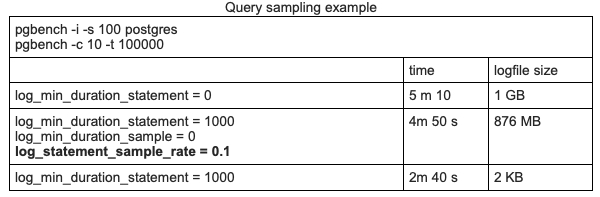
    Consider the following synthetic query sampling test using pgbench on a laptop.

    PostgreSQL 13

    • 1st Row: No sampling. All queries are logged
    • 2nd Row: Log all queries longer than 1 second, plus 10 percent of all other queries
    • 3rd Row: Log all queries longer than 1 second

    In this example, sampling improves timing slightly, but since the test was run on a personal laptop, this measurement does not signify much.

    However, the size difference is very interesting. Sampling helps make the logfile size approximately 10 times smaller. We can figure out that most of the queries in this test lasted less than 1 second. And if we log only long queries, the logfile remains almost empty (third row). The difference here is significant. Even if disk space consumption isn’t a concern, sampling can help speed up tools that analyze PostgreSQL logs.

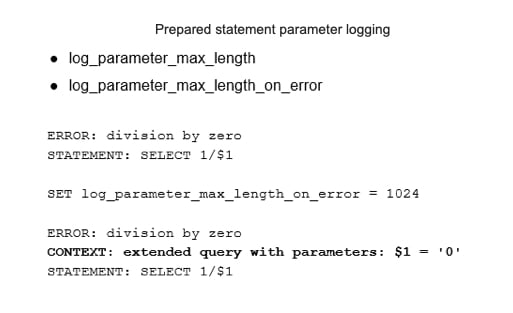
    PostgreSQL 13 also introduced settings to improve control over prepared statement parameter logging.

    If log_parameter_max_length is set, bind parameter values will be trimmed to this many bytes.
    log_parameter_max_length_on_error adds context for the failure of parameterized queries.

    Previously, prepared statement parameters were never logged during errors. Note, since these logging features can impact performance, they should be used with care.

    PostgreSQL 13

    Write-Ahead Log Usage Statistics

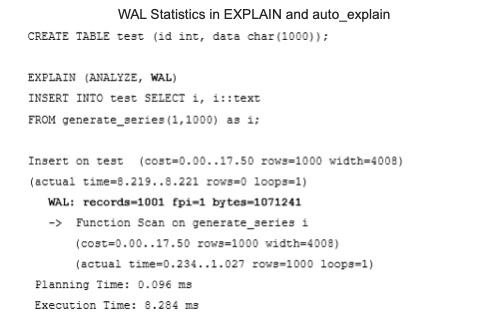
    A write-ahead log (WAL) is crucial to database system durability, and is also used for physical replication. This makes monitoring the WAL important. PostgreSQL 13 allows users to explore WAL usage per query using the EXPLAIN command. The following example shows that the insertion of a thousand rows generates 1001 records and takes about 1 Mb of space. Note that auto_explain also shows this statistic.

    PostgreSQL 13

    It is also possible to find WAL usage statistics in autovacuum log messages. However, this works only when autovacuum logging is enabled with the log_autovacuum_min_duration parameter.

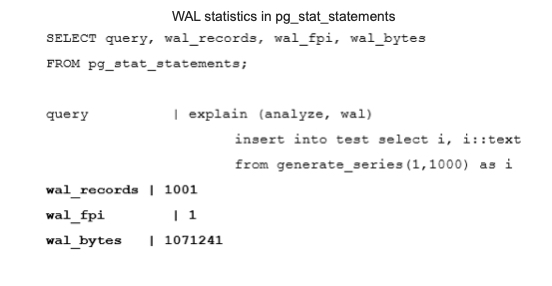
    Probably the most useful place to see WAL statistics for a monitoring plugin is in pg_stat_statements. PostgreSQL 13 has new columns that show WAL usage statistics per query.

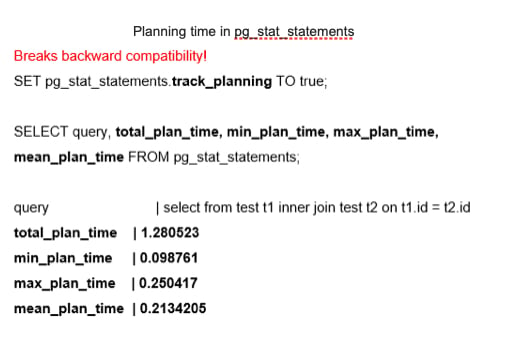
    Another addition to pg_stat_statements is a group of fields to track planning time. This feature is disabled by default because it can cause a noticeable decrease in performance. When enabled, it shows total, minimal, maximal and mean planning time. The pg_stat_statements.track_planning parameter enables this feature. It is important to note that this feature breaks backward compatibility. Previously, existing “time” fields — min_time, max_time, total_time and mean_time — had their suffixes changed from “time” to “exec_time.” As a result, all monitoring tools that rely on pg_stat_statements should be adjusted accordingly.

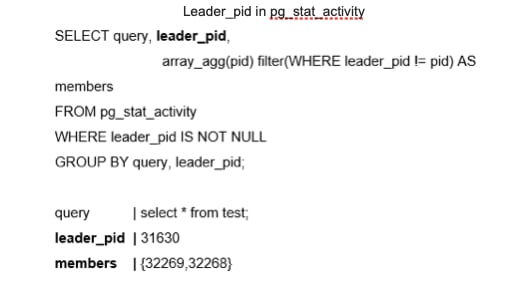
    The next feature provides more information about parallel queries. In the past, parallel queries did not reveal which back end was related to the parallel query or provide easy insight into all the processes involved in a query. It is now possible to show the parallel group leader information, at the SQL level, using the leader_pid in the pg_stat_activity system view.

    New System Views

    PostgreSQL 13 offers new system views that can be used for PostgreSQL monitoring. The first group improves progress reporting.

    pg_stat_progress_basebackup helps to estimate the progress of a base backup of a PostgreSQL cluster.
    pg_stat_progress_analyze shows information about backends running the ANALYZE operation, including autovacuum workers. It can help administrators understand how long it will take to collect statistics.

    Another group of new system views helps answer the following question: “How does Postgres spend its allocated memory?” These views will be mostly useful for DBMS admins and low-level support engineers who inspect bottlenecks and optimize memory usage.

    pg_shmem_allocation can be enabled for a deeper inspection of how shared memory is used for internal DBMS structures, including a lock table, process array, data about various background processes and so on.
    pg_stat_slru is related to the inspection of SLRU caches. SLRU is a special buffer cache where non-user data is stored, such as the state of each transaction, as well as information about subtransactions. Asynchronous notifications also use SLRU.

    Wait Events Changes

    PostgreSQL 13 introduced the renaming of various wait events to improve consistency. The brief reference to this in the release notes does not do justice to the importance of this change. Wait events were added in Postgres 9.6, and are usually needed to diagnose bottlenecks that occur because of interprocess locks. Previously, wait events were named in all possible styles. Now, the naming is more consistent, and the wait events are better documented and, hopefully, more understandable. However, admins need to update any monitoring scripts that use wait events, including the following:

    Hash/Batch/Allocating → HashBatchAllocate
    ControlFileLock → ControlFile
    clog → XactBuffer
    AsyncCtlLock → NotifySLRU

    Several new wait events were also introduced in PostgreSQL 13, including:

    VacuumDelay
    BackupWaitWalArchive, RecoveryPause
    RecoveryConflictSnapshot, RecoveryConflictTablespace

    Upper Limit for the track_activity_query_size Parameter

    One final small improvement in PostgreSQL 13 is worth noting: an updated upper limit for the track_activity_query_size parameter. This parameter specifies the amount of memory reserved to store the text of the command. The previous maximum was 100 KB, which could be too small when monitoring applications that generate large SQL queries.

    The new upper limit is 1 MB. However, keep in mind that the database allocates the amount of memory specified in track_activity_query_size in advance for all potential sessions. Thus, higher values can increase memory consumption.

    The Importance of These Features

    These significant updates in PostgreSQL 13 are vital for admins that run the database and want to tune the system, optimize applications, forecast system growth and do resource planning. However, the new features are also extremely important for DBMS developers who need to gather more information and collect real production statistics about various parts of PostgreSQL in order to find bottlenecks and opportunities to make improvements. As always, we look forward to even more great new features in future releases of PostgreSQL.

  • RDX Eases Oracle Database Migration to PostgreSQL on AWS

    RDX Eases Oracle Database Migration to PostgreSQL on AWS

    RDX this week launched a set of tools designed to make it easier to convert applications running on an Oracle database to Amazon Aurora, an instance of an open source PostgreSQL database running on the Amazon Web Service (AWS) cloud that is compatible with Oracle databases.

    Announced at the AWS Summit event in Washington D.C., the clckwrk Refactoring Service for Oracle promises to reduce the amount of manual effort associated with refactoring applications for the Amazon Aurora platform by automating as much as 60% of the database schema conversion process.

    James Ball, chief strategy officer for RDX, said in addition to reducing costs, many organizations want to shift applications to open source databases in the cloud to further their DevOps ambitions. Each time an application needs to scale, an organization will incur additional Oracle licensing fees. In contrast, an open source database enables DevOps teams to scale database instances as required automatically, he said.

    AWS has been making a concerted effort to convince customers to give up proprietary databases in favor of open source databases running on its cloud platform. That competitive pressure is a driving force behind new alliances that previously would have been considered unimaginable. Oracle, for example, recently partnered with Microsoft to promote the integration of the Oracle Cloud platform with the Microsoft Azure cloud. Oracle would prefer its database run on its cloud, but through the alliance is signaling its willingness to work with Microsoft to deploy Oracle database on Azure, a cloud platform that is the leading industry alternative to AWS. Microsoft, of course, has its proprietary database to adopt in the form of Microsoft SQL Server.

    Ball said RDX not only provides tools to accelerate the conversion to Amazon Aurora, but it also provides managed services for customers that want to outsource the management of Amazon Aurora to RDX.

    It takes most organizations several months to migrate a legacy application on to a public cloud. AWS has a vested interested in helping accelerate that process whenever possible. But many organizations that have embraced best DevOps practices find their efforts are hampered by reliance on proprietary databases. In fact, one of the reasons so many developers tend to favor open source databases is to avoid all the headaches associated with getting approvals for new database licenses.

    It’s unclear to what degree the rise of DevOps in the enterprise will ultimately shift database allegiances. Oracle is trying to maintain as much control as possible by making its databases available as a managed service that eliminates some of the purchasing overhead associated with spinning up new instances. However, the cost of an Oracle database license is still buried in the cost of the managed service.

    Not every organization is looking to transition away from a proprietary database, but there is now enough momentum around the “open source first” movement to make it worthwhile to build tools that automate the refactoring of legacy databases not just to reduce costs, but also to make IT a lot more agile.

    — Mike Vizard

  • DBmaestro DevOps Platform 7.5 released with PostgreSQL Support – DB2, SQL, Oracle, and PostgreSQL

    Manages multi-database environments for DB2, SQL, Oracle, and PostgreSQL

    BOSTON, MA, October 11th, 2018 – DBmaestro, the pioneer and leading DevOps for database solution provider announced today the launch of DBmaestro DevOps Platform 7.5 which enables CI/CD and release automation for PostgreSQL. PostgreSQL is becoming the preferred database for more and more enterprises and smaller organizations. It is currently ranked #4 in popularity amongst hundreds of databases worldwide (See more info at DB-Engines Ranking).

    DBmaestro’s DevOps Platform 7.5 includes database release automation solutions to streamline database changes with confidence and control while enabling companies to reduce the time to market for their applications. The fast adoption of continuous delivery and deployment methodologies to accelerate application development has created a strong demand for database release automation tools to prevent errors and downtime.  According to the 2018 DevOps for Database Report, 83% of companies have already embraced DevOps, while continuous delivery for databases lags behind, with only a 37% adoption rate.

    DBmaestro’s DevOps Platform 7.5 zero-friction solution provides the ability for DevOps teams and database professionals to manage multiple databases more easily, without having to change existing processes.  Providing an overarching solution for CI/CD adoption across platforms and operating systems including Oracle, DB2, Microsoft SQL Server and now PostgreSQL, DBmaestro meets the evolving database release automation needs of enterprises across industries and borders.

    “Our DevOps platform unleashes the power of PostgreSQL databases by enabling DevOps and database teams to implement DevOps best practices and accelerate time to market with a high level of confidence, minimal risk and maximum efficiency,” said Yaniv Yehuda, CTO at DBmaestro.

    DBmaestro will be demonstrating DBmaestro DevOps Platform 7.5 solution at DOES18  from October 22– 24th in Las Vegas, Booth #811.

    About DBmaestro

    DBmaestro brings DevOps best practices to the database, delivering a new level of efficiency, speed, security and process integration for databases. DBmaestro’s platform enables organizations to run database deployments securely and methodically, increase development team productivity and significantly decrease time-to-market. The solution enables organizations to implement CI/CD practices for database activities, with repeatable pipeline release automation and automatic drift prevention mechanisms. For more information, visit www.dbmaestro.com.

  • Complementary Technologies: Amazon RDS and PostgreSQL

    Complementary Technologies: Amazon RDS and PostgreSQL

    For enterprises in search of a relational database service that will effectively and consistently meet their requirements, Amazon RDS is probably worth a hard look. By making cloud-based relational databases straightforward to set up, operate and scale, Amazon RDS liberates businesses from the time-sink of internal database administration duties—in turn allowing for a clearer focus on product and business development. When it comes to selecting a database engine, organizations on Amazon RDS have a variety of choices, from Amazon’s own Aurora to MySQL, MariaDB, Oracle, Microsoft SQL Server and PostgreSQL.

    While each of these Amazon RDS database options have their pros and cons, I’m a fan of PostgreSQL for a number of reasons. PostgreSQL offers a feature-rich open source object-relational database engine that’s backed by 15 years of dedicated community development, a proven architecture and a well-earned reputation for reliability and data integrity. PostgreSQL more than matches MySQL’s speed and feature set, bringing to the database table than a standard SELECT, INSERT, UPDATE functionality. Driven by particularly strong community and third-party support, PostgreSQL regularly releases stable updates that enhance its performance and expand its features—which now include native JSON storage, native arrays and the ability to create custom data types, functions, and deeply customizable extensions to fulfill specific application needs.

    Utilizing Amazon RDS and PostgreSQL in tandem provides synergistic benefits, due in no small part to a number of design features intended to provide simplicity. Amazon Web Services includes a one-click interface for creating a PostgreSQL instance in the cloud. Amazon also offers its AWS Database Migration Service (DMS) integrated within the Amazon RDS service, which makes it easy to migrate an existing database over to PostgreSQL and import it as an Amazon RDS instance with zero downtime (and schedule the migration for whatever time a business finds most convenient). Amazon RDS also allows you to scale PostgreSQL databases up and down in the cloud within minutes; provides automatic replication for high availability and redundancy using Amazon Availability Zones; integrates easily with other AWS services such as Amazon Virtual Private Clouds; and makes it simple to set up and restore database backups using automatic snapshots.

    Scaling, In a Snap

    The pairing of Amazon RDS and PostgreSQL is well-suited to smooth growth as the demands placed on an organizations’ application increase, as the Amazon RDS platform allows you to scale instances both vertically and horizontally as necessary.

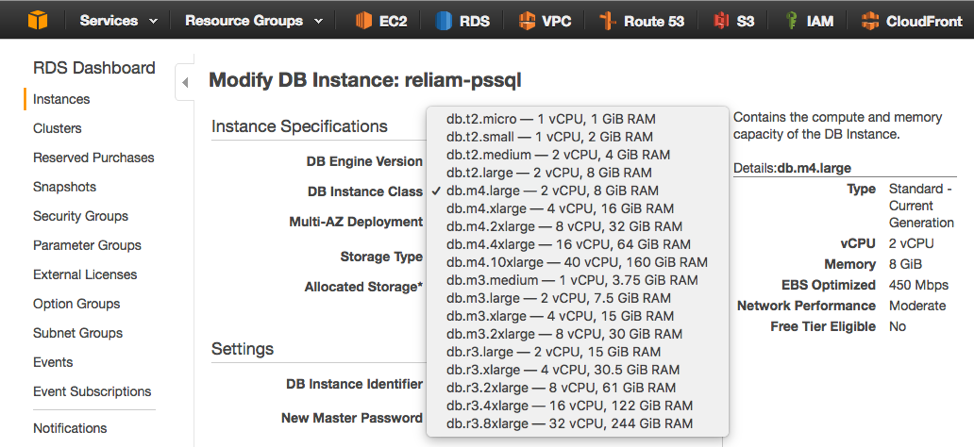
    Vertical scaling in Amazon RDS can be accomplished as follows:

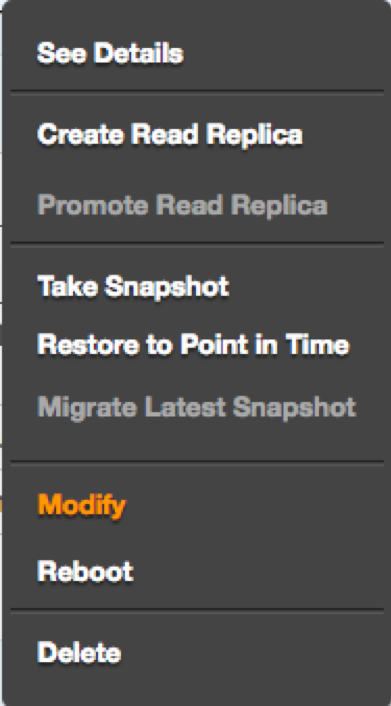
    From the RDS dashboard, select “Modify” from the list of options for your database instance:

    Then, choose a new DB instance class:

    The process is now complete. Vertical scaling in Amazon RDS is that simple. Vertical scaling also occurs with little or no downtime when running a database using multiple availability zones, since the standby database will be upgraded first and followed by a failover to this upscaled database.

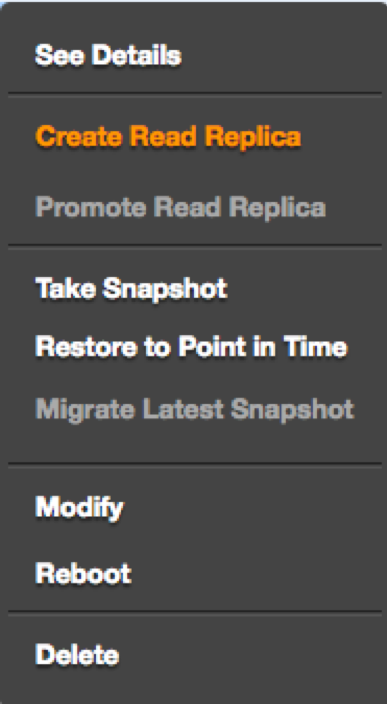
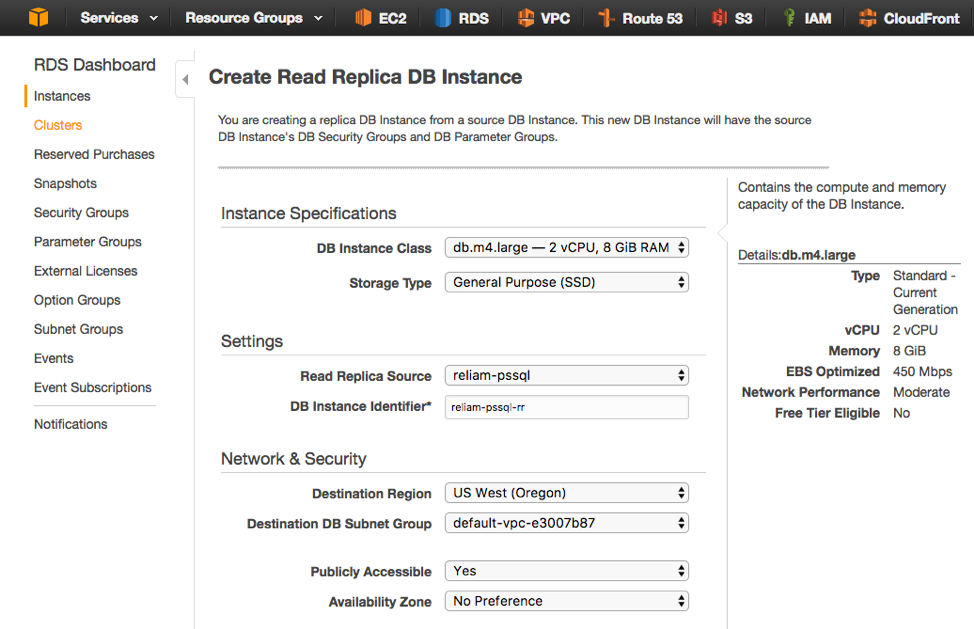
    Additionally, Amazon RDS provides an easy method for improving read performance by increasing scale horizontally, using read replicas as read-only copies synchronized to the master database.

    From the dashboard, select “Create Read Replica” for the instance:

    On the next screen, select the instance size and the database instance name. It’s also possible to deploy read replicas to any region and availability zone:

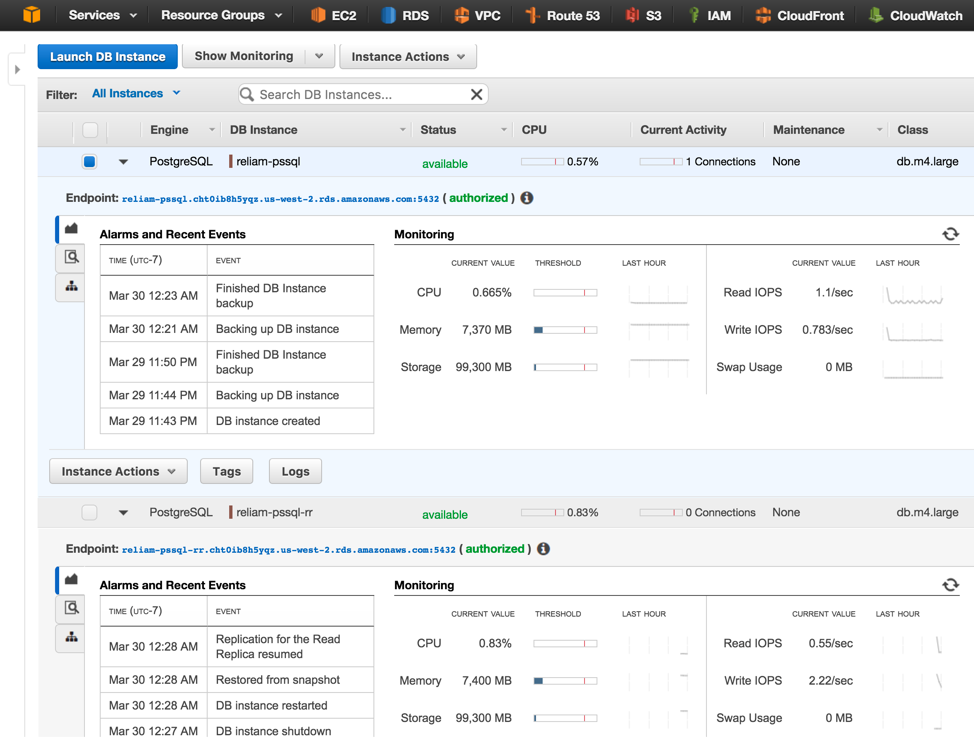
    In just minutes, increasing horizontal scale will be achieved:

    In my view, businesses can realize all the benefits of a simple, affordable, and versatile fully-managed database-as-a-service solution by teaming up Amazon RDS and PostgreSQL—one that can be set up in just minutes and scaled to any size a growing organization may come to require.

    — Fabricio Mariani