Tag: performance

  • Cracking Production Performance Issues With Open Source Observability

    Cracking Production Performance Issues With Open Source Observability

    I would like to share a recent case study on our organization, Logz.io, which battled a very serious performance issue, the solution for which turned out to be a small change in code but with a huge impact on all of our HTTP endpoints in our platform.

    Among other topics, I’ll cover:

    • How we investigated and found the root cause.
    • Logs, metrics and tracing all together to have better observability.
    • How Jaeger, as a tracing tool, ease to visualize our potential bottlenecks.
    • How to correlate logs and traces.

    Performance: Our Wake-Up Call

    Some may say we are experts in observability and mainly in logging; after all, that’s what we do for a living. Once we encounter any performance issue, it should be no-brainer for us to fix it in no time.

    That might be true in certain use cases, such as whenever there are few slow endpoints and identifying the root cause via logs is easy. But in practice, logs are not enough when the situation is more complicated. We’ll see this later on.

    In our case, performance issues were reported especially during peak usage times—2-7 p.m. local time, overlapping between EU and U.S. customers.

    We use our own product, just like any other customer, so we saw on our internal Slack channels that employees were experiencing increased latency over the same period of time.

    Better Observability When Using Logs, Metrics and Tracing

    To correlate users’ complaints and actual monitoring data, we usually check all three main pillars of observability: logs, metrics and trace data. Let’s have a closer look at how we used each one of them in this case:

    Logs

    Our log analytics product is built on top of open source ELK stack.

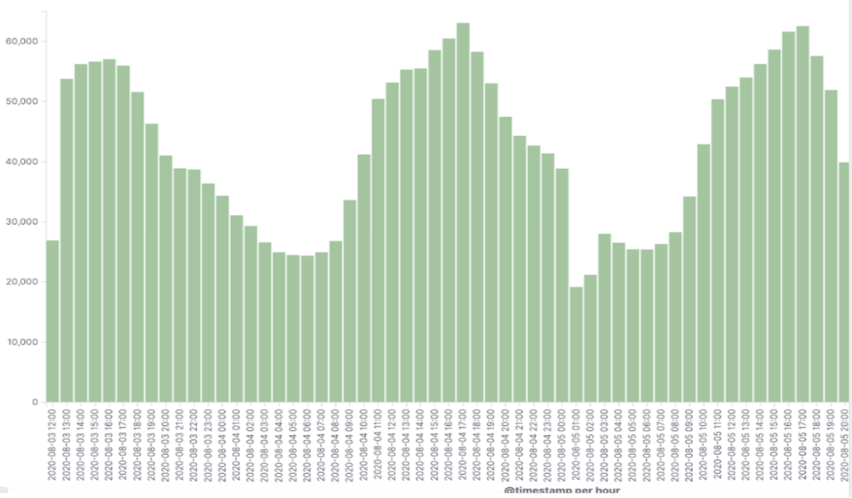
    We use a custom field processingTime (the amount of time it takes for a backend endpoint to be processed) in our access logs and then visualize it over time in Kibana. That better picture can identify suspicious endpoints that take more time than anticipated in peak times. We can see below an example of an endpoint that consistently takes more time (ms) during the 2-7 p.m. window.

    In addition to the processing time each suspicious request took, we saw growth in the number of requests to the microservice handling our user session tokens. Likewise, we noticed a very high load of requests during those same peak hours.
    Metrics

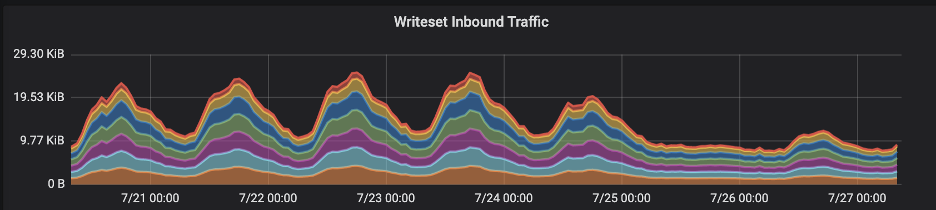
    Our metrics product is built on top of open source grafana. In our backend infrastructure dashboards, we found consistent spikes in transaction commit size written into our distributed database (Galera). Those spikes correlated with the same peak times above between Monday and Thursday. Apparently, this might look pretty valid because these are our customers’ rush hours, but we’ll see later why it made us suspicious.
    Additionally, we faced significant replication latency in our database cluster during the same period:


    Distributed Tracing

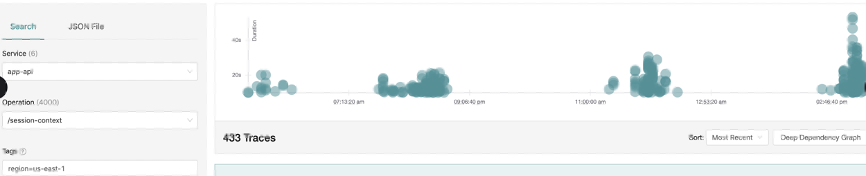
    Last but not least, our tracing product is built on top of open source Jaeger. We checked for patterns of high latency by filtering out requests that took less than 5 seconds. Again, slow requests popped up more during peak hours.
    Each type of representation of data has its own benefits, so with using Logz.io it was very easy to correlate all data and navigate between them to find the performance bottlenecks.

    One of the must-have features to correlate logs, metrics, and traces is using the trace-id common tag. Alternatively, in lieu of it, another common tag such as request-id matches these requests throughout all of our microservices together.

    Performance Investigation Deep Dive With Jaeger

    As we already discussed, our goal was to find what made our application slower than usual during peak hours. We needed to trace our application flow to find out where the performance bottlenecks were. More importantly, we can track how we got there, i.e., find the request flows that led us to the suspiciously slow span. As modern microservice-based applications boom, it gets more difficult to trace things manually, by adding dedicated logs of before and after any needed code block. Moreover, it makes the code cluttered and unclear with unwanted log lines.

    In our case, Jaeger made our life much easier. Especially for a new developer in the company who was not fully familiar with all of the involved components, it was easier to understand the business flow by identifying long-running spans before changing any code (which takes much more time).

    So, if we could point to the exact places in our code where performance bottlenecks, it would be super easy to fix it in no time. However, our case was a bit different. Virtually every endpoint in the back end was suffering at peak times while firing a search request:
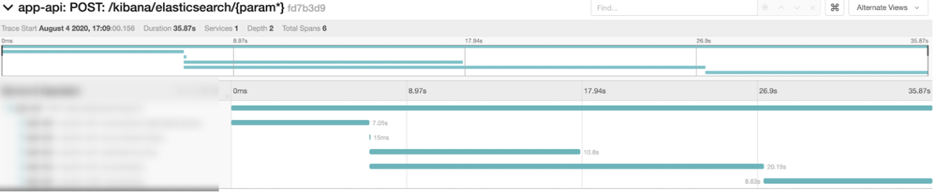
    Peak hours trace

    Normally with slow search queries the suspicion falls on the database, in this case Elasticsearch. So, we correlated the above span from the POST /services/query request with our logs and realized that the actual Elasticsearch query only took 15ms! So, we were able to rule that out.

    It’s important to emphasize that in non-peak hours, these microservices take 10 milliseconds at most:
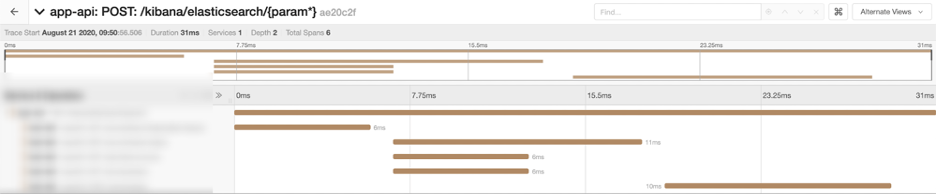
    Off-hours trace

    As we can see, that looks way different from the example we showed before! So, why does it behave so dramatically worse in rush hours?

    The Root of Performance Issues: We Found It!

    We encountered pretty much the same slow pattern in all related endpoints when performing search requests. As a result, we were pretty confident that the root cause for all of it had to be in one of our core cache components. In other words, too many requests were delivered to our internal microservice (which serves the user session token object from the database) instead of getting it directly from the cache.

    This hypothesis also fits the scenario above since more active users implies more SELECT and UPDATE queries for each user session token at precisely the same time we saw latency peaks in our graphs.

    From there, finding the best solution was pretty straightforward and the fix took us just two lines of code! It was a matter of changing the configuration of our session token cache eviction policy.

    Boommmm

    The most exciting part of these kinds of fixes is to see how all the graphs change immediately. The writes and reads traffic to and from the database, plus the high latency in many requests, dropped as soon as we pushed the fix live to production. The impact was absolutely clear in our application dashboards:
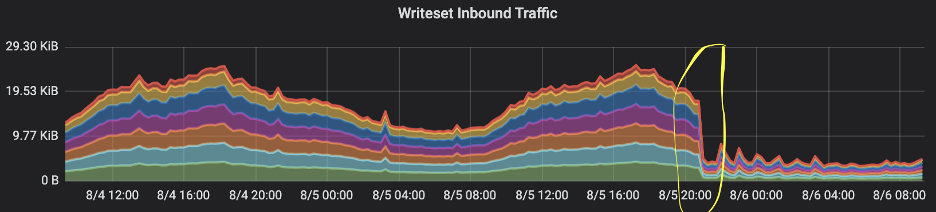
    We could see the total size of transaction commits dropped right after the deployment.

    Also, we saw the total number of requests to the problematic service cut off by more than 80%!

    And most importantly, as soon as we deployed the fix, the latency dropped across all the impacted endpoints:
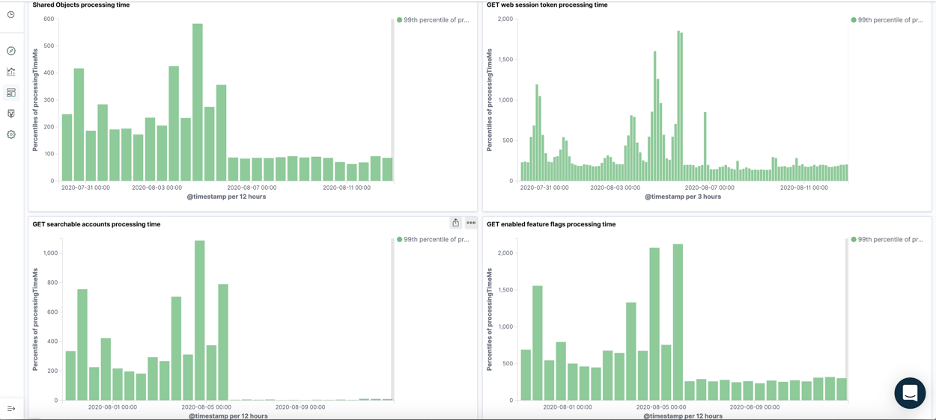
     

    For the coup de grace, we were waiting to hear from our customers any positive feedback. And we didn’t have to wait long—we immediately received high marks.

    Summary

    We still have a long way to fully instrument our system, but even with what we did so far we see that the efforts have paid off. We got a really cool and meaningful view of our system, which makes us better understand our business flows and, more importantly in our case, to quickly identify any bottlenecks.

    We already learned from our ongoing tracing adoption journey a few tips worth sharing:

    • Correlation between spans and logs is a must-have. The best practice for doing it is with a unique identifier such as trace-id or in case it’s missing with request-id. It brings a lot of value when you better want to examine a full request end to end by one click, which moves you to the respected logs page and vice versa. With Logz.io, you will get the log-trace correlation out of the box, which simplified things for us.
    • If your application is multi-tenant and you want a better view of traces of a specific customer, I’d recommend adding custom tags like customerId or userId.
    • If you want more finely tuned traces, consider adding custom spans for important pieces of application logic. Don’t just wrap every endpoint, which is the easy thing to do. If we suspect, for example, a slow query in the database, we can easily add in code for a custom span that will measure just this section and then it’ll be visualized under the parent transaction span, so we can see how much time it takes comparing the other spans.

    Having Logz.io made our journey much smoother—having logs, metrics and traces in one consolidated platform without the need to install and maintain it ourselves and with built-in correlations.

  • Performance Issues: Looking Beyond the Infrastructure

    Performance Issues: Looking Beyond the Infrastructure

    In most cases today, resolving performance issues will require architecture changes or code refactoring

    Imagine you’re a software reliability engineer with your service-level objectives clearly laid out on your Grafana dashboard. Suddenly, an alert appears: Your 99th percentile latency is going through the roof!

    A quick glance at the relevant metrics reveals the culprit: A spike in traffic has exceeded the current system throughput. It’s clearly an issue caused by a lack of capacity, which adding a few extra instances to the cluster should solve, right? After all, more machines mean more capacity. You remain calm as the charts stabilize and the alert fades away. There’s no cause for concern; you automated the scaling process a long time ago.

    But this story could have resulted in a very different, far worse scenario. Capacity is easily accessible these days, especially in cloud environments that offer simplified scaling processes. But the ease of provisioning and scaling also incurs rising infrastructure costs.

    In many cases, handling performance issues or improving performance can’t necessarily be achieved simply by adding more machines due to application bottlenecks or resource management inefficiencies. To paraphrase a wise uncle: With greater compute power (adding more machines) doesn’t come greater performance. Unfortunately, in most cases today, resolving performance issues will require architecture changes or code refactoring.

    Optimizing the Software

    Since increasing the node count rarely helps with improving the performance, let’s explore what can be accelerated. The stack is composed of hardware, an operating system (OS), libraries and the application, among other components. Making improvements at the hardware level is not always feasible, especially when running in the cloud.

    Rather than spending more on your cloud bill, consider checking how fast the userspace code is. Application developers have a lot on their plates already, so there is only so much they can optimize. While it is possible to invest R&D efforts and time in replacing a poorly performing library with a more performant one or doing the occasional performance-focused rewrite in the hopes of resolving the issue, it’s possible neither will work.

    When fidgeting with the hardware isn’t an option and the developers are unavailable to help, another option is to attempt to address the problem at the OS level.

    A Trip Down Memory Lane

    The history of computing has not only been about smaller transistors and faster clocks. Back in the mainframe days, machines ran a single program at a time that was encoded on a punch card and inserted by a computer operator.

    Then businesspeople came along looking for a way to make computers more efficient since, during a program switch, the machines remained idle. This led to the creation of the operating system, a program that executed other programs and managed resource allocation between them. Operating systems were designed for users behind the keyboard running simultaneous tasks; therefore, they were designed to provide this illusion of parallelism by optimizing internal resource management to achieve high interactivity and fairness.

    Today, it’s not uncommon to command a fleet of generic virtual Linux boxes that are focused mainly on running a specific application, a microservice. But the OS underneath hasn’t changed much. It still behaves as if it is supposed to execute multiple programs and share resources between them, which isn’t necessarily the most efficient in such a case and doesn’t provide optimal performance for the application.

    Optimizing the OS

    There are a number of potential performance improvements that can be tested and applied directly at the OS level. Tuning sys controls can have a significant impact on the performance of many subcomponents, such as networking.

    The I/O scheduler may be worth looking into as well. For example, with databases, the default CFQ (Completely Fair Queuing) can yield results that are inferior to those of the deadline scheduler. On the other hand, a no-op scheduler allows you to avoid having to schedule I/O operations twice in cloud environments. After all, the VM’s hypervisor often manages the hardware already.

    No matter what your approach, though, constant meticulous measurement in a production-like environment (or even the production itself, if you’re into chaos engineering) is recommended. Performance tuning is a highly advanced field that requires specialistic system knowledge.

    Advanced OS Tweaks

    Some OS features are not so easily accessible for performance tuning. For example, the Linux process scheduler utilizes the Completely Fair Scheduler (CFS), which is perfectly sensible in most cases. However, it can sometimes create a significant performance gap that cannot be easily found with standard profiling tools. And even if you do discover it, you can’t simply change a parameter in one of the configuration files; rather a kernel patch and a rebuild are required.

    Let’s say you’re perfectly fine with the algorithm, but you’d simply like to state that some threads are more important than others. By default, you can’t do this, as the niceness setting only works at the process level.

    I/O-bound applications are also complicated. Even when using raw sockets and epoll, there is no runtime mechanism to provide selection logic or even a priority to the sockets in the queue. And there is no way for a kernel to know the performance budget for a request.

    Additional Means for Performance Optimization

    In an ideal world, your application will consist of purpose-built operating systems tailored for each microservice and exploiting every opportunity to boost performance and synergize with the application. In such an ideal world, the internal resource management mechanisms within the operating system will be tailored to the application-specific utility function to drive optimized performance and, in turn, also deliver reduced infrastructure costs.

    Unfortunately, we’re not there yet, and such solutions are currently only available to corporate giants who can afford to hire a few dozen people to do just that full time. In the words of William Gibson, “The future is already here – it’s just not evenly distributed.”

    So what is left to those with finite budgets? A new approach for real-time continuous optimization that enables organizations to leverage AI-driven infrastructure optimizations that are suited specifically to the running workload. Using application-driven scheduling and prioritization algorithms, it is possible to identify contended resources, bottlenecks and prioritization opportunities and solve them in real-time.

  • Closing the Gap on Continuous Delivery Metrics that Matter

    Closing the Gap on Continuous Delivery Metrics that Matter

    Management guru Peter Drucker once said, “If you can’t measure it, you can’t improve it.” I would take a step back and say, If you can’t measure it, you can’t get it off the ground. Many companies that I work with are amid digital transformation initiatives, such as the adoption of DevOps and continuous delivery. For these initiatives to gain momentum and acceptance within their organizations, they must be able to demonstrate quick time to value or risk being sidelined. And then, these organizations must be able to actualize their transformations and improve their processes—both enabled by the right metrics.

    Indeed, one of the core pillars of DevOps culture—going all the way back to the first DevOpsDays event in 2010—is measurement. It is the M in the CAMS (Culture, Automation, Measurement, Sharing) acronym coined by Damon Edwards and John Willis.

    Glaring Gap in Continuous Delivery Metric Definitions

    Despite the prominent placement of measurement in the DevOps world, there is not really a lot of guidance about metrics in the common literature. For example, the original “Continuous Delivery” book by Jez Humble and David Farley devotes maybe a dozen pages out of 500 to it. And the recent “DevOps Handbook” by Gene Kim, et al is thin on the topic as well.

    The coverage gap around measurement and metrics is driven primarily by the fact that the DevOps space is new and there are few standards around which to build an easily documented metrics structure. That leaves practitioners with the challenge of creating something they can use pragmatically within their own organizations. Anyone building a system of measurement for their organization must have a reasonable understanding of metrics as a discipline and a good understanding of the processes they intend to measure.

    Back to Basics on Measurement

    There are two types of metrics that I discussed in a recent session at CA World ’16 that are important when measuring a complex enterprise process.

    • Result metrics are concerned with the cumulative outcome of a set of activities. For example, a company’s revenue or net income would be common, classic result metrics.
    • Performance metrics measure how well individual activities are working. These often are more difficult to define, as they can vary by businesses and teams and be obscured by silos.

    Performance and result metrics are very closely linked: Performance metrics measure the effectiveness of the activities that drive the result metrics. For example, measuring the average number of deals closed per salesperson per period would be one measure of the effectiveness of a sales organization (a performance metric) which, in turn, would be a factor in driving revenue (a result metric).

    While DevOps literature generally does not provide a lot of detail about metrics, it does provide advice on key result metrics. The primary one is lead time. Lead time is a powerful measurement that originated in Lean manufacturing. It originally dealt with how long it took a company to deliver a product to a customer after receiving an order. In DevOps terms, lead time summarizes the amount of time it takes to deliver one single change or feature from business idea through to running software in Production.

    Lead time is calculated by aggregating the work time (referred to as cycle time) on a change plus the time when the change is in progress, but not being worked on (referred to as wait time). The formula that LEAD TIME = CYCLE TIME + WAIT TIME is a powerful tool for understanding the result metric level; however, the challenge in most enterprises is figuring out a workable system of supporting performance metrics.

    Value Stream Mapping to Uncover Performance Metrics

    You’ll find that the result metrics part of the effort—calculating the lead time for an application change—is relatively straightforward even when corporate structures can obscure exactly when work (cycle time) is happening versus when things are waiting (wait time). The Lean manufacturing world provides techniques for analyzing a flow.

    A common technique is called value stream mapping (VSM). VSM provides guidance for breaking down a complex process into identifiable “steps” to provide measurement points throughout the process for cycle time and wait time. The measurement points then provide milestones for tracking the progress of the single change or feature from business idea through to production use.

    For example, in an enterprise application development situation, typical application delivery pipelines provide several logical points that can be used as steps for VSM. Using those points, it is simple to measure linear time through the process. The common logical measurement points are:

    • Assembly (aka Development): the time required to assemble a configuration package (code, database, infrastructure, and network) that the team declares as an instance of the application including the change
    • Time Spent at Each Pipeline Phase: the time spent in various QA environments, such as Integration, Functional, Performance, UAT, etc., and to finally put the configuration package into the Production environment.
    • Time Spent on Promotion Decisions: the time spent waiting for a decision to promote a given version of the configuration package to a higher environment or to reject it at the end of that validation phase.

    The performance metrics that determine how efficiently cycle time and wait time are utilized, however, are significantly less obvious. Software development is iterative by nature. That means that individual steps in the value stream will be repeated many times and the cycle and wait time metrics ultimately will obscure the quality of what is happening at the measurement points due to natural tendencies to aggregate and average the values.

    Performance Metrics for Continuous Delivery

    Establishing the performance metrics for a continuous delivery pipeline requires a bit of analysis. The performance metrics must be geared to understanding how to reduce the cycle time per repetition and the overall number of repetitions at each measurement point in the delivery pipeline. Here is a pragmatic, two-part pattern you can follow:

    The first part is to break down the iterative pieces of the pipeline into logical ‘mini’ value streams. For example, each QA environment must be provisioned, configured, have changes deployed, and then validation activities occur. Those steps can provide measurement points and, more interestingly, can be used symmetrically in all environments in the pipeline enabling questions such as, “Does one take a disproportionate amount of time relative to the others?”

    The second part is to look at the qualitative items that drive either long repetitions or increase the number of repetitions. For example, how many environments does a configuration package go through before rejection? More can actually be more expensive, slower and likely to be indicative of requirements problems, while fewer may indicate code quality problems. Another example might be smoke test failure rate in each environment. Variance in one environment could indicate problems in either the configuration management or deployment automation, but would require repetition of the deployment or manual correction. Finding that problem and fixing it ensures better cycle time at that step and stage, and serves to keep lead time down.

    End Game: Demonstrate Business Value

    It may be a very long time before the DevOps movement reaches consensus on a system of metrics. The variability in software environments and industry needs means that it is unlikely for one size to fit all. However, with a pragmatic approach and some lessons from the Lean manufacturing world, it is possible to produce a workable and effective system of metrics for continuous delivery pipelines in the enterprise.

    Vendors, such as my employer, CA Technologies, are helping by building more integrated systems of pipeline management tools to help shift from merely reporting metrics to applying them with modern analytics-driven techniques. The dividend of these approaches and tool improvements is that it is getting easier to gain a clear understanding of your process and to demonstrate to the business that the DevOps initiative is, in fact, worth the effort and investment.

    — Dan Zentgraf

  • Top 5 Traits of High-Performing Teams

    Top 5 Traits of High-Performing Teams

    DevOps is here and it seems to be what everyone in IT service management (ITSM) is buzzing about. So what are the goals and how do we know it’s not just the next hot kitchen color for this year? DevOps is a cultural and professional movement that stresses communication, collaboration and integration between software developers and IT operations professionals while leveraging agile, lean and traditional ITSM practices.

    Stakeholders on the development side will include, but not be limited to, all of the people involved in developing software products and services. On the operations side it will include, but not be limited to, all of the people involved in delivering and managing those software products and services and the underlying IT infrastructure on which it is being delivered.

    The goals are to better align IT responsiveness to business needs, smaller more frequent releases, reduce risk, increase flow, improve quality and reduce time to market. These can only be accomplished by understanding the entire value stream, including the lead times and cycle times of the different areas that make up your value stream.

    Let’s take a look at the top five predictors of IT performance and see how engaging DevOps practices enhances our ability to become high-performing teams.

    1. The peer review change approval process provides enhanced and effective communication. When technical teams hold themselves accountable for the quality of their code through peer review their performance increases, resulting in 200 more times frequent code deployments, according to Puppet Labs’ “2016 State of DevOps Report.” Allows for an on demand deployment (multiple, daily releases) structure.
    2. Version control for all production artifacts. This provides a single source of truth for all changes. An integrated and automated tool chain along with practices such as continuous integration result in a three times lower failure rate, according to the report.
    3. Proactive monitoring enables teams to diagnose and solve problems faster and have a higher degree of accountability. Tie that in with a single source of truth and that results in 24 times faster mean time to recovery (MTTR), the report noted.
    4. High-trust organizational cultures allow for experimentation and learning, allowing people to take intelligent risks. Having this culture promotes the idea that repetition and practice is the prerequisite to mastery.  According to the Puppet Labs report, organizations with high NPS (Net Promoter Score) have shown much higher levels of employee retention and are 2.2 times more likely to recommend their company as a good place to work.
    5. A win-win relationship between Dev and Ops. It’s not Dev versus Ops, it’s Dev and Ops. Shifting left is about building quality into the software development process. When you shift left, fewer things break in production because issues are detected and resolved earlier. By building quality into the software development cycle, high-performing teams spend less time on unplanned work. We also found they spend less time remediating issues and spend more time on new, value-add work.


    — Drew Lapatin

  • Why Your Organization Needs DevOps

    Why Your Organization Needs DevOps

    The recently released fifth annual “State of DevOps Report” by Puppet has once again brought with it fresh insights into what drives high-performance teams. The report, which comes at a time when DevOps has ceased to be a buzzword, provides proof of why more and more businesses across the world are adopting DevOps to improve their organization’s performance, revenues and profitability. DevOps has truly come of age and this year’s “State of DevOps Report” clears any doubts fence-sitters may have about the effectiveness of the DevOps approach.

    The 2016 report reasserts that unparalleled IT and organizational performance is a result of a team effort spanning development and operations. The report also highlights the importance of improving the entire product life cycle—from initial product planning, to quality and security assurance, to customer feedback—to speed up delivery while improving quality, security and business outcomes. You can read the full report here.

    In today’s competitive business environment, DevOps has emerged as a vital solution that helps organizations meet ever-growing industry demands. The “2016 State of DevOps Report” helps us understand how the practices associated with DevOps affect IT performance and organizational performance. Let us examine the findings of the report to ascertain how DevOps can benefit your organization.

    Why Does Your Organization Need DevOps?

    The “2016 State of DevOps Report” makes it plain and simple that companies that incorporate DevOps practices get more done. According to the report, high-performing IT organizations deploy 200 times more frequently than low performers, with 2,555 times faster lead times. They have 24 times faster recovery times and three times lower change failure rates. High-performing IT teams spend 50 percent less time remediating security issues and they spend 22 percent less time on unplanned work and rework, the report states.

    Performance

    If we boil down the report findings into actual benefits of adopting DevOps, we could say that DevOps enables continuous software delivery with less complex problems to fix and faster resolution of problems. This essentially means that you can deploy faster and more effectively in more stable operating environments and add value rather than just fixing or maintaining.

    DevOps can revolutionize the performance levels of organizations and allow them to deploy at a rate never seen before. It has certainly enabled organizations such as Etsy, Netflix, Facebook, Amazon, Twitter and Google deploy hundreds and thousands of code per day while delivering world-class stability, reliability and security. You can find out how different organizations have implemented DevOps to their benefit in this YouTube video.

    Security

    Higher performance is not the only payoff in the DevOps culture. Organizations that adopt DevOps practices are known to have better information security. The “2016 State of DevOps Report” clearly states that organizations that integrate information security objectives into daily work spend 50 percent less time remediating security issues than low performers. This has a positive impact on IT performance and security outcomes.

    Any organization, irrespective of size, can employ DevOps to achieve high performance levels and meet business goals while cutting down on costs related to fixes and remediation security issues.

    How DevOps Transforms Teams

    Consider this scenario: In an organization that does not apply the DevOps methodology, the development team writes code and develops a product, which is then sent to the testing team that verifies if the code meets the requirements. The operations team steps in to run the product only after this process is complete. The DevOps philosophy was created to break the silos that teams operate in and effect better collaboration and performance.

    The culture shift DevOps brings about in organizations is substantial, and since culture is a key factor responsible for a company’s performance, application of the DevOps philosophy provides measurable and non-measurable results. A few of them are:

    Employee Engagement

    DevOps is neither a method nor a tool, it’s a culture! In organizations that observe the DevOps culture, the development and operations teams work outside silos, releasing products faster, thereby increasing operational efficiency. This is made possible by the operations team giving the developers constant feedback about the code and troubleshooting problems with the user experience in mind. This continuous learning and delivery practice allows cross-functional teams collaborate as one team with one goal, thus facilitating higher performance levels. The improved organizational culture and enhanced employee engagement can help organizations not only in retaining great talent but also in recruitment.

    Organizational Success

    The “2016 State of DevOps Report” effectively explores the relationship between employee engagement and organizational success and goes on to show that there is a strong correlation between these two factors. The report states that employees in high-performing organizations are more than twice as likely to recommend their organization to a friend as a great place to work.

    Organizations can greatly benefit from adopting the DevOps culture. The “2016 State of DevOps Report” shows that high-performing organizations are widening their lead against lower-performing organizations. This can be attributed to the increased productivity and creativity of highly engaged employees that helps them provide better experiences to customers.

    Organizations can achieve great business results by reinvesting the human time, creativity and energy saved by reducing rework and downtime through DevOps. Herein lies the ROI of DevOps—the competitive advantage that organizations get by investing in a philosophy that positively affects bottom-line results!

    About the Author/ Pallavi Poojary

    Pallavi Poojary1Pallavi Poojaryis a writer with Edureka, an online learning company with more than 250,000 learners spread across the globe. She writes on hot technologies and skills that are in demand today, including DevOps, Big Data and Project Management, to name a few. She is a believer in transformation of careers through learning

  • The Big DevOps Question: How Do We Get Started?

    The Big DevOps Question: How Do We Get Started?

    Every conversation I have with clients regarding DevOps eventually reaches a point where the client wants to know my recommendations for getting started with a DevOps program. Some have already embarked on a DevOps program, but want me to critique their approach against what I see others doing. Others simply don’t have a clue how to make the necessary changes in their organization.

    Ultimately, I sense in all these conversations a lack of confidence that their intended outcome is achievable and that they’re on the right path.

    The first questions I ask clients are, “What are you looking to accomplish, and what are your business drivers?” Interestingly, 90 percent of the time clients are unclear why they want to embark on this journey. Sure, DevOps makes sense academically, but if you don’t have a clear understanding of your expectations for improvement most likely you’ll end up with more questions.

    Sometimes it helps if I give prompts:

    • Are you looking to improve quality in your production releases?
    • Do you need to release updates and patches into production more quickly?
    • What metrics are you currently looking at, and what makes you believe these are not optimal for your business?

    This last question is really important. Quite often data represents invalid perspectives. Other industries’ and services’ metric of how often they deploy to production or how long it takes execute a release cycle might not be right for your business or industry. I hope medical device and airplane equipment manufacturers take a lot longer to bring something to production and test it more robustly than Netflix does its website.

    In an earlier post I wrote that the need for DevOps is effectively the admittance of a problem; to wit, the cure is continuous delivery. Hence, I often tell clients that a very realistic place to start is not with the actual work, but with the communications methods and pathways that will affect implementing continuous delivery within the organization.

    So many clients want to start their DevOps journey in application development and talk about what they’ve done with continuous build. That’s fantastic, but it has more to do with Agile software development than it does DevOps. If all that work creates bottlenecks in testing, you’ve accomplished very little. Now you must fix the flow to balance out development and testing. Trying to achieve continuous development through serial analysis and correction will take a long time and show little progress along the way—and often leads to abandonment.

    However, if all the leaders of all the various areas involved in the continuous delivery cycle discuss how their efforts are impacted by what the other leaders’ groups do, everyone can see the bottlenecks and constraints and they can prioritize changes. Management often fosters much of the cultural impairment, as these changes can impact everything from workload to bonuses. Getting everyone involved in working together to eliminate the bottlenecks often buys credibility for the program and minimizes some of the individual adoption issues.

    Don’t jump into the deep end of the DevOps pool just because everyone else is. Before embarking on your DevOps journey, do a deep analysis of your organization’s goals and baseline your current levels of performance. Discuss what needs to change based on real business goals and drivers (e.g., it takes us too long to issue regulatory changes to the system). Identify bottlenecks and constraints that exist in the current environment today and put together a plan to eliminate as many as possible.

  • A DevOps Approach to Delivering Frequent, High-Performing Releases

    A DevOps Approach to Delivering Frequent, High-Performing Releases

    We live in an application-driven world. Applications power businesses, provide connectivity, and help fulfill goals and customer needs. In a competitive world, needs evolve quickly as our users demand more features — all the while expecting around-the-clock availability and reliability, whether they use smartphones, tablets, or computers.

    Keeping Up With User Demands

    As IT folk — irrespective of whether we are in development or operations — we need to deliver new apps and features frequently to satisfy our users’ needs or else we risk losing them to competitors or alternatives. What do we do to stay ahead? We release updates faster by:

    • Organizing around small teams and delivering more agile releases
    • Automating where possible (test and release processes)
    • Deploying updates into production when available

    However, the unfortunate truth is that frequent changes often cause errors and instability in production. We need to mitigate risk by taking a close look at our processes and practices before we hit the gas.

    Preparing for fast and frequent application releases

    Here are two issues (amongst many others!) that hold us back from delivering frequent updates, while ensuring reliability:

    • Tedious release processes: Developers have a multitude of collaboration tools, Kanban boards, build tools, and agile practices, and can build features quickly. But once it comes to releasing these changes through QA, staging, and production, the process is more manual, ad hoc, and slow.
    • Unreliability in production: Code that runs as expected in development sometimes falls short in production. Production environments are subject to limitations imposed by third-party services, regional ISPs, firewalls, and so on. They are often quite different from development and QA environments.

    Collaborate on a singular goal

    Development and operations teams come from different schools of thought. Devs push for change and ops drive for stability. While they both aspire to offer superior software that adds value to users, their goals are diametrically opposed! What we need is a culture where development and operations teams draw from each other’s experiences, perspectives, concerns, and continuously improve processes to build and deliver resilient applications rapidly, into the hands of their customers. This requires discipline, a sense of mutual respect, focus on the big picture, and a strong commitment toward delivering on business goals.

    Streamline and automate releases

    Developers enjoy streamlined processes with their collaboration and build tools to produce releases effectively. However, the operations folk do not share the same good fortune. Quite often, they get artifacts, scripts, and resources from different members of the team, and run them in sequence in order to deploy and test the application. This lack of coordination and automation greatly slows down the release process. Here’s how you can begin to address this issue:

    • Critique your processes: Where do the dependencies lie? Are there any redundancies that can be consolidated? Where are the bottlenecks, what’s causing them, and how expensive are they? Start with small opportunities that can bring big improvements.
    • Automate: Once you have optimized release processes, look to automating them. Time and effort saved from repetitive tasks can be put toward innovating and adding value.

    Once released, monitor for quality

    By automating steps within the release pipeline, you set yourself up for increasing release velocity while ensuring optimal quality. However, no amount of preparation can guarantee expected results in production. Elements out of your control — like network traffic, third-party services, local ISPs, or browsers — can potentially impact user experience or disrupt service. Many of these outages have been very public. What we need is a strong feedback loop with every release that measures metrics around performance, exceptions, and, most importantly, end-user experience. Rapid-Releases-With-Feedback Watch out for subtle changes in performance Subtle changes can alter your application’s end-user experience, costing you customer acquisition and brand loyalty. It is death by a million pinpricks. Slow applications, JavaScript errors, and 404s are very effective in turning users away. Here is where application performance monitoring tools — like Riverbed SteelCentral™ AppInternals — help diagnose problems that degrade application performance and behavior. They monitor end-user experience from your users’ devices, trace transactions through the application tiers and infrastructure, and diagnose performance problems down to application code. These insights gives developers the visibility they need to quickly fix problems that occur in production without going through the painful process of recreating and analyzing them.

    Monitor end-to-end application performance continuously

    Monitor your application for performance and behavior in production. Make this an ongoing activity during peak and off-peak hours alike. A keen insight into your application and infrastructure health can reveal snags that would otherwise go unnoticed. You really want to look for symptoms that compromise end-user experience, such as:

    • How are my servers and infrastructure performing at current capacity?
    • How are users in one location faring compared to others?
    • What parts of my application — internal or third party — impact performance?

    Diagnose problems with performance monitoring tools

    Diagnose where and why these symptoms occur. Are they because of poor code, network conditions, server capacity, or third-party services? What is the context in which these issues occur? Which code segment, SQL query, or app component is at fault? You will be able to package up everything the development team needs to fix the problem and prevent it from recurring. Many of these tools, like AppInternals, allow developers can view this information from within IDEs like Eclipse and Visual Studio.

    In conclusion, aim for continuous improvement

    Particularly in the case of rapid release cycles, constant monitoring is a necessity. Identify symptoms in runtime — in QA and production — and quickly fix them using diagnostic data captured by your tools. This will keep the backlog low, your IT team productive and focused delivering new features, and your customers happy.

  • Are the Milliseconds Worth It?

    Are the Milliseconds Worth It?

    The pressure to prove one’s coding prowess can make a developer do some very clever and creative things with their source code. Sometimes it’s just a unique approach, but every once in a while this cleverness may shave a few milliseconds off of some performance metrics as well. In the end it’s not worth it. While this may seem like the type of innovation we want from our peers I’ve come to the conclusion it often does more harm than good. A quote that ran across my twitter feed a few weeks ago sums it up nicely: “So if you’re as clever as you can be when you write it, how will you ever debug it?”  This pearl of wisdom comes from a book called “The Elements of Programming Style”. It’s a programming book from 1978 that is still entirely relevant. There’s a Wikipedia article you can check out if you’re not ready to take my word for it.

    I know I’ve coded something in a unique fashion, and was quite sure I was  being brilliant at the time, only to go back later and have absolutely no clue why I wrote the code the way I did. If I added comments I may be able to find my place again but sometimes it takes a while. What about when another developer runs into one of these bright ideas? Will any amount of meditation or contemplation allow them to make sense of what I was doing when I wrote it? Should a new or junior developer be expected to have some out of body experience before being able to work with me? Of course not. I hate it when I do this to myself, never mind when I run across someone else’s flash of genius. I certainly try to keep other devs from going through this type of mind freak as often as I can.

    While this exercise can make for a fun parlor game and help extend our knowledge of the language we’re coding in it causes more problems than it solves in a team environment. A wiser developer sticks with a tried and true approach. They’ve been around long enough to know that the code needs to make sense to any garden variety developer that may be working with it in the future (which may in fact be the developer that wrote it in the first place).

    I first learned this lesson years ago while tutoring mathematics. I had a developed an algorithm to generate the unit circle. Computer Science majors I was tutoring in math had an easier time using this to quickly generate the circle on scratch paper than arbitrarily memorizing it or understanding the standard proof that shows a bunch of triangles somehow morphing into a circle.

    Unit Circle
    Radian Values of the Unit Circle

    The algorithm requires a certain amount of seed data. One must know that a full circle is 2π radians in circumference. This puts the other quarter circle measures at π/2, π, 3π/4 respectively. Only a simple understanding of fractions is required to see this. Next we need to fill the first quadrant, which is only three more values, π/6, π/4, and π/3. From here the algorithm helps us extrapolate the remaining radian values for the circle.

    First Quadrant:  π/6, π/4, and π/3 (initial seed values, you have to remember these)

    Second Quadrant: π – First Quadrant Corollary Value ( e.g., 3π/3 – π/3 = 2π/3, our 2nd quadrant value)

    Third Quadrant: π + First Quadrant Corollary Value ( e.g., 3π/3 + π/3 = 4π/3, our 3rd quadrant value)

    Fourth Quadrant: 2π – First Quadrant Corollary Value (e.g., 6π/3 – π/3 = 5π/3, our 4th quadrant value)

    So, the formula for quadrants two through four can take the form of (n – s), (n + s), and (2n -s), where n = π and ‘s’ is one of the three seed values from the first quadrant. Three simple equations that any CS major should be entirely comfortable with using. There are a few other notes on this proof to get the coordinates, signs, and degree measurements correct. This is not a post about mathematics however, so I’ll leave that as a exercise for the more mathematically inclined to complete on their own time.

    Other mathematicians where not as impressed as the CS majors and the student athletes were with this. Watching students that actively despised math struggle with memorizing the unit circle in an effort to complete their core was part of the fun of being good with numbers. It was suggested (by some troll of a jerk) that I might be a math noob myself, some poser that wasn’t any smarter than the fools he was tutoring. Impostor syndrome set in and I I felt I had no choice but to prove my mathematical prowess.

    First I went big and reproved what I was doing with a Klien Four-Group. The trolls were quick to point out that this, like my first model, wasn’t a circle at all but just a bunch of points on a plane. Next I came back with a version using a rotational matrix. This did in fact generate a full circle with any value you like on it. The trolls had no more jabs for me but they also fell short of any compliment or encouragement for the work I had done.

    As for the students I was helping, none of them quite understood the issue I had encountered. They viewed those trolls as nothing but trolls. Peers that only laughed at their struggle and refused to even try to help them. I ultimately found out my students were concerned that I had gotten sucked into this quagmire. The research I was doing was beyond their understanding and they were still using the first model I developed. It did exactly what they needed it to do. I was informed I should take the rising grades as evidence that my work was of merit and move on to a more productive use of my time and energy.

    It was only then I noticed the trolls did have a point. The Klien Four-Group model and my original algorithm weren’t circles at all, just dots with values attached to them. A mathematician would have issue with this where a developer would not, since an object oriented developer should have a deeply rooted appreciation for abstraction. A class called Tree rarely resembles what we know to be a tree. It’s the use case that ends up being important. To a paper company a tree only needs to be represented by the amount of pulp they can expect it to produce. To an apple farmer it probably boils down to the number of apples the tree puts out and maybe its location in an orchard. What we take to be a tree, its size, the shape of its leaves, how it smells, the sound it makes when the wind catches it, are all details beyond the scope of most software we’ll ever write.

    This happens to be a huge blocker for most new OOP developers, especially the ones that are good at math. The object model I was using to teach CS students how to do trigonometry ended up being the perfect tool to teach mathematicians how object oriented programming works. The rotational matrix version is important because sometimes non-standard values are needed. It’s useful to show how a method call may use standard values or extend onto another model, like the rotational matrix, when standard values don’t apply.

    Mathematicians appreciate the Klien Four-Group model and I’m happy to show it off when I have the chance. More importantly, it’s a reminder to not get too fancy with math they’re putting into software. The math is beautiful more than it’s clever, and I’ve written code I feel the same way about. Like most works of art it stems from a hobby and should be left out of any applied scenario if it’s not practical. If we can get the same result with something that’s simple, something that’s easy to understand, easy to use, and even common, then that’s what we should use every single time because it will be easy to maintain. Wisdom is nothing more than knowledge applied over time. Time and time again I’ve come to the conclusion that maintainability trumps performance. We should be quick to sacrifice any minimal performance gain that makes our code difficult to understand. If a major performance gain is within reach then we’d be wise to abstract any strange code that was used to obtain it. I’d also advise you to comment the living day lights out of it as well, since you may need to remember how it worked yourself someday.