Tag: performance monitoring

  • Sentry Extends Application Performance Monitoring Tool

    Sentry Extends Application Performance Monitoring Tool

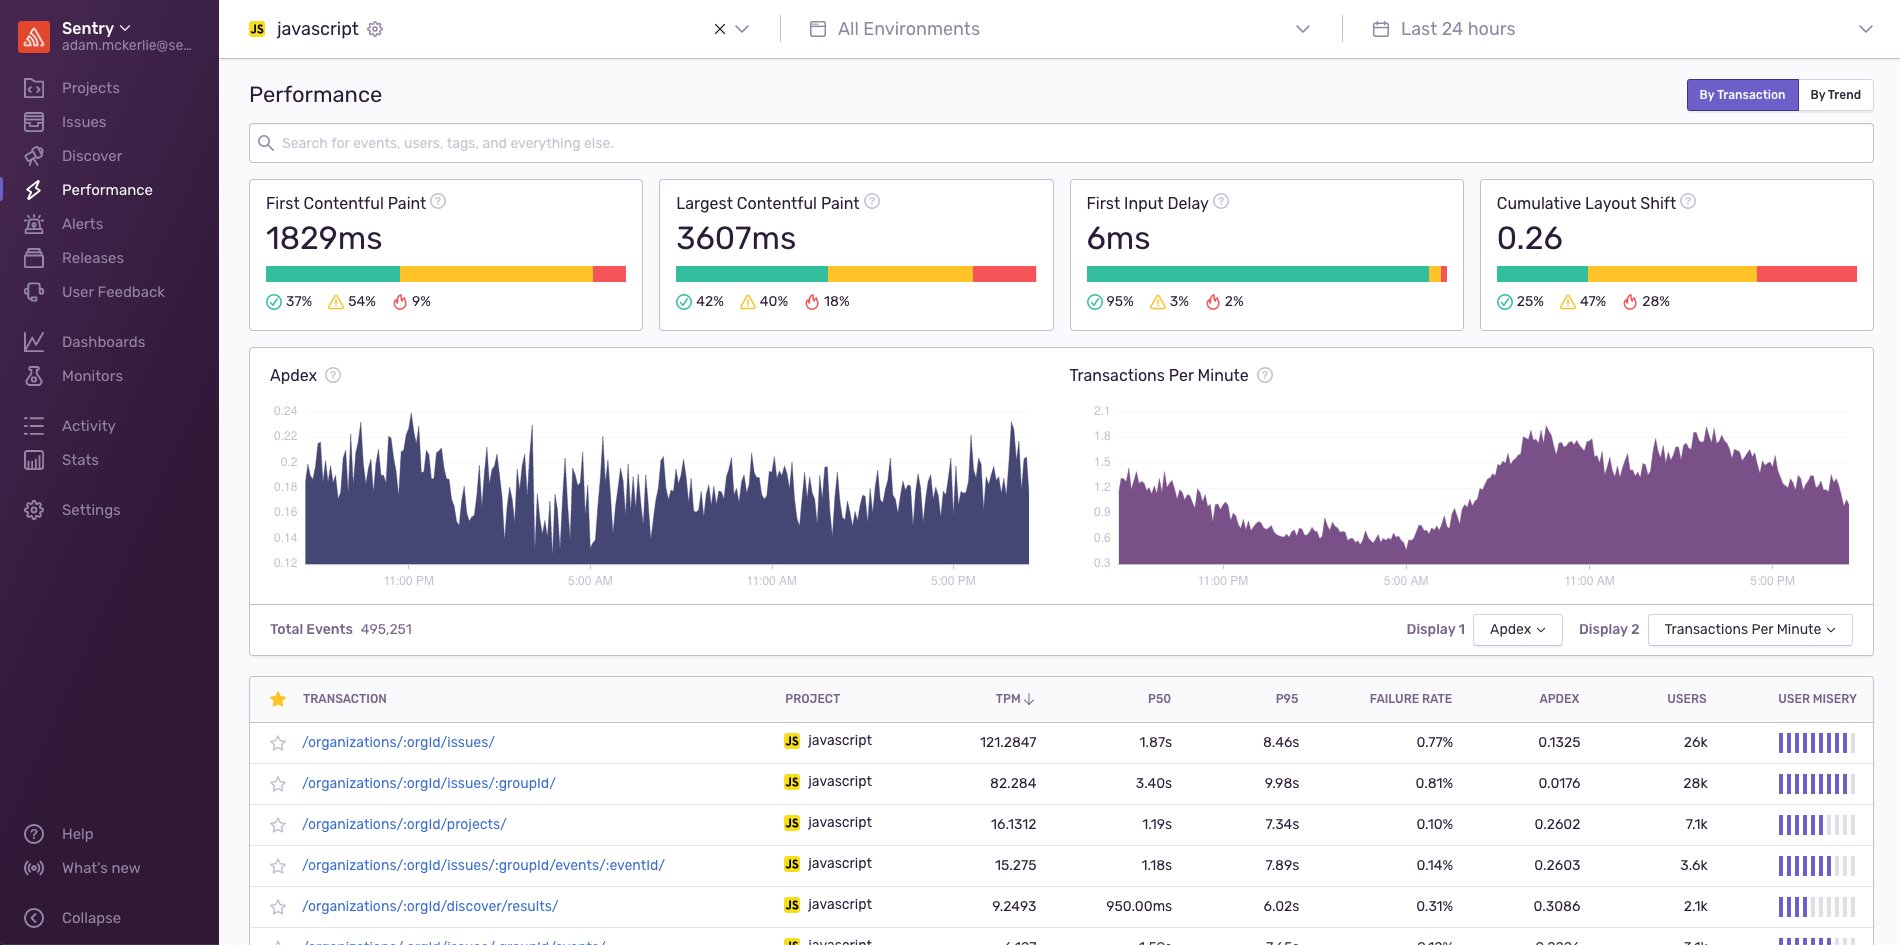
    Sentry this week announced it has added support for applications that employ serverless computing frameworks as well as the Google Web Vitals service to its application monitoring tool.

    Company CEO Milin Desai said incorporating Google Web Vitals metrics into Sentry Performance Monitoring will become crucial as Google makes good on a pledge to rank websites and applications on its search engine based on the metrics it collects via this service.

    Google Web Vitals determines how fast an application is by monitoring how fast a site presents user interface objects. By coupling Web Vitals with transaction data gathered by Sentry, it becomes possible for developers to correlate how a transaction may be adversely impacting the user experience. That data then can be employed to adjust what application programming interfaces (APIs) should be called within an application, Desai said.

    At the same time, he noted a larger percentage of developers are starting to employ serverless computing frameworks within the front end of their applications. The Sentry platform now monitors serverless computing frameworks that are employed within a PHP, Node and Ruby-based application. Most of those frameworks are being used to trigger a specific action when some type of event occurs within an application, said Desai.

    Finally, Sentry has also added a Trends view that enables developers to see the most improved and most regressed transactions that have occurred over time. That capability enables developers to more easily determine when changes to the overall IT environment are adversely impacting their applications. Armed with that data, it then becomes easier to identify what changes were made at that time.

    In general, Desai said there is not enough focus on enabling observability for application developers versus IT operations teams. Sentry Performance Monitoring is designed to enable developers to correlate specific events occurring within their code to actual end user experiences by adding five lines of code to their applications.

    Observability tools for developers will not obviate the need for observability tools for IT operations teams, but Desai noted as far as visibility into applications is concerned, most developers today are flying blind. Observability is supposed to be a core tenet of any DevOps practice. However, the level of observability actually being achieved tends to vary widely among IT organizations.

    Of course, the best place to solve any issue is going to be within the application code, whenever possible. Many developers could eliminate performance issues long before many IT operations teams realize they exist if they had more visibility into how code was executing. That issue will become all the more pressing as IT organizations deploy applications based on microservices that have many dependencies.

    The challenge IT organizations face now is determining not only which observability platforms to employ, but also what level of visibility is required for all the different roles and personas that make up that team.

  • Cloud-Native Security and Performance: Two Sides of the Same Coin

    Cloud-Native Security and Performance: Two Sides of the Same Coin

    You’re running Kubernetes in a production environment, and you need to apply a patch — perhaps to a commercial application, an open source component or even a container image. How long should it take to implement that patch in production? Thirty days? One day? One hour?

    Remember, cloud-native environments are supposed to respond to change in real-time. Such a response isn’t simply scaling up or down as needed. It’s also essential to respond to security threats, and performance issues, as close to real-time as possible.

    Containers, and the microservices they support, are also ephemeral. They can live for five minutes or even less, and yet unpatched microservices are just as dangerous as more permanent code.

    Patching must also fit within your application lifecycle. Teams with a mature DevOps process typically release code weekly, daily or even hourly. Their ability to apply the patch and roll to production quickly, significantly reduces their security risk. Are your operators up to the task?

    Poor Security Management Becomes a Performance Problem

    The connections between security and performance go well beyond cloud-native environments. Denial-of-service (DoS) attacks obviously target a site’s performance, as do cryptojacking and to a lesser extent, ransomware attacks.

    In many cases, performance monitoring gives an organization its first indication that such an attack is underway. However, monitoring isn’t just for recognizing attacks in progress. It also plays an important role in the prevention of attacks as well — especially in cloud-native environments.

    To understand this point, think about how organizations have traditionally handled patch management, especially to software infrastructure: A vendor (or open source project) releases a patch. The enterprise applies the patch in a test environment that resembles production somewhat. After running a range of integration tests over the course of days or even weeks, the ops team may be ready to deploy the patch into production. 

    Another likely scenario: The ops team may collect several patches to different pieces of software, hoping to test and deploy them all at once. In the meantime, more time goes by, giving attackers even more opportunity for mischief.

    The reason that applying patches in an enterprise production environment takes so long is because IT leadership perceives that patch management is a high-risk activity. Patches may make a piece of software behave poorly or not at all — and the complex interdependencies among both applications and infrastructure components compound the risk of failure unpredictably.

    Cloud-Native Computing Changes the Equation

    Cloud-native computing extends cloud best practices such as scalability and resilience to the entire enterprise IT landscape, providing a new paradigm for computing across hybrid IT environments that leverage virtualization, containers and serverless computing as appropriate.

    At the center of the cloud-native movement is the open source container orchestration platform, Kubernetes. Kubernetes requires and reinforces a cloud-native architectural approach that decomposes applications into containerized microservices. 

    Deploying, managing and operating microservice-based workloads at scale becomes the central challenge for Kubernetes, and for cloud-native infrastructure in general.

    To manage patches, organizations must follow cloud-native principles. Monolithic, “test everything for weeks” approaches simply do not align with the dynamic, ephemeral nature of cloud-native software.

    Just as application developers use canary testing for features they are rolling out, canary testing infrastructure updates largely supplants testing in the full-blown test environment. 

    Testing patches (or updates) become an ongoing, largely automated process of trying new configurations in limited production environments, analyzing the resulting performance and rolling back changes if necessary.

    Operators can now test patches (or new releases) more quickly in production, in a way that ideally minimizes the impact on the applications that end-users interact with.

    How, then, should operators manage such canary environments? By monitoring the performance of the software under test.

    The Convergence of Security and Performance Monitoring

    Unpatched software is the leading source of vulnerabilities in the enterprise IT landscape, and managing patches in dynamic environments requires performance monitoring.

    Add patch management to other performance-related cyberthreats, such as denial of service, ransomware and cryptomining, and it’s clear that security and performance monitoring are two parts of a broad spectrum of IT operations management (ITOM) capabilities.

    In cloud-native infrastructure, ITOM doesn’t stop at monitoring. Instead, operators require observability tools that monitor logs, traces and metrics across the entire infrastructure, in addition to providing tools that operators can use to mitigate and prevent problems with the infrastructure.

    In other words, where monitoring is a passive, “watch the dashboard” activity, observability goes the extra mile, promoting an active, “understand and fix the problem” mentality.

    It doesn’t really matter if those problems are performance or security-related — in many cases, there’s no distinction. Today’s operators must work with tools that bring the two together into a full-fledged security, compliance and monitoring solution.

    The Intellyx Take

    Some analysts argue that IT infrastructure has followed a natural progression from on-premises servers to virtualization to cloud computing to containers. However, there is a fatal flaw in this argument.

    The first three environments in this sequence follow a clear pattern, as virtual machines work much the same as physical servers, be they on-premises or in the cloud. As a result, coding applications remained largely unchanged as enterprises worked their way along this progression to the cloud.

    Containers, however, are fundamentally different — especially once you place them into Kubernetes and the cloud-native context overall. With cloud-native computing, it’s essential to rethink the nature of the application from the ground up. Cloud-native computing is, in fact, an entirely new paradigm for enterprise IT.

    It’s no wonder, therefore, that core operational activities like security and performance monitoring have a new role in the cloud-native world. Indeed, security and performance are every bit as important as before, but today, we must deal with both at once in the context of a dynamic, ephemeral application landscape.

    Only within this context does it become clear what cloud-native vendors like Sysdig are offering. The world of IT infrastructure is changing, and with it the world of enterprise application development and deployment. Security and performance are as important as ever. Don’t let them fall through the cracks.

  • AIOps: The Path to Greater Resilience and Uptime

    AIOps: The Path to Greater Resilience and Uptime

    Large organizations with complex IT infrastructures are facing a significant challenge when it comes to data. The complexity is such that many IT operations teams are struggling to detect, or predict, the complex failure conditions and circumstances that can adversely impact resilience and uptime.

    Monitoring a multitude of systems is a complex task, as the data generated by any system can be vast and far too overwhelming for manual IT operations processes, particularly in relation to analyzing, correlating and prioritizing alerts and remediation.

    Companies have much to gain from a better understanding of the data being created from monitoring tools and practices: increasing the resilience of systems, and the speed of remediation cycles delivers significant cost and time savings. Harnessing advanced technologies to deliver more intelligence to teams in charge of performance monitoring is becoming increasingly important, which is where AIOps can deliver significant value on top of existing monitoring and automation tools.

    Cutting Through the Noise

    Telemetry tools deliver staggering amounts of data. The Microsoft Azure telemetry platform, for example, records 10 petabytes of data per day. When dealing with this volume, the ability to intelligently decipher the severity of alerts becomes vital, especially as many of them may be duplicates or not meaningful in any way. Yet it is IT operations teams that are tasked with understanding how systems are performing, and where resources should be diverted to ensure services are always up and running. To do this effectively, the root causes of alerts must be identified quickly and correctly.

    AIOps is increasingly becoming the go-to solution to the problems inherent in dealing with big data. By applying data collection, data modeling and data analytics techniques and using machine learning algorithms to establish patterns, the noise of the data is reduced as operations teams gain more intelligent insights into alerts. So, providing more context to issues flagged within systems is the goal. Eventually, somebody has to take action when an alert is created, so the more intelligence engineers have, the easier it will be to remediate.

    The less context delivered with alerts, the more time engineers will need to resolve the issue, as the manual remediation process will likely involve interaction with other teams. Take application performance monitoring as an example. In my experience, operations teams do not have an end-to-end understanding of the applications that are live in the production environment. If an alert is created, the ops team will typically seek assistance from a member of the developer team who built it, or another colleague with a deeper understanding of the application, which of course extends the lead time of the remediation process.

    Key Considerations for Deploying AIOps

    By establishing data patterns through machine learning and other advanced analytics technologies, the following key drivers for alerts assessment using AIOps can be established:

    Frequency: Discovering how regularly alerts are created and whether it warrants automation for analysis, correlation, prioritization and remediation.

    Coverage: Telemetry is of course vital to AIOps, as the machine learning algorithms will only be as good as the data they ingest. Putting in place the right telemetry tools is therefore vital to ensure the right data is being gathered. Failing to do so increases the risk of missing critical issues.

    Impact: Not all problems require equal energy and resources. Certain issues might only occur every few months and may not be critical. In such situations, it is not prudent to invest significant amounts of time and money into developing the machine learning algorithms that will identify where and when an alert will be created. Again, cutting through the noise of the telemetry will help to identify high-priority alerts.

    Probability: What is the likelihood of certain issues recurring? Can automation tools, informed by the machine learning algorithms, be implemented to deal with these, i.e. learn where and when they are likely to occur so they can be dealt with by the AIOps platform autonomously?

    Take, for example, the issue of CPU or memory going beyond a certain threshold. Rather than manually contacting customers when an issue is flagged to inform them that services are about to go down before being spun up again, an AIOps platform can automate this process, so remediation happens seamlessly.

    Latency: Automation of the remediation process for an alert deemed critical requires increased investment in AIOps. Getting good data from the early stages of AIOps processes will reduce the amount of time taken to both flag and deal with a problem. Containerized microservices, for example, take very little time to recover, so very little investment is needed when applying AIOps tools that automate remediation. Database recovery, however, is a more complex process, the automation of which would require significant investment.

    What’s the Customer Value?

    For service providers, AIOps is essential if they are to attain the highest levels of resilience, the measure of which all comes down to the Service Level Agreement (SLA). The SLA is measured by a percentage that corresponds to the time systems and are up and running over a year. So, 99.99% uptime is good, 99.999% is great, but 99.9999% is where service providers want to be. To put this into context, downtime for an entire year in the latter scenario amounts to just 32 seconds.

    Increased automation is the only way to achieve optimal SLA. To do this, service providers are increasingly turning to AIOps solutions.

    Operations teams are in charge of the IT strategies that align with business objectives. For service providers, a key part of this is, of course, ensuring maximum availability and optimal performance of the customer-facing environment. Understanding when and where faults appear, and improving resilience against them, is the best way to ensure this. That is where AIOps truly adds value.

    — Prashant Jain

  • How Monitoring and Observability Feed Each Other to Create a Holistic Approach to Visibility

    How Monitoring and Observability Feed Each Other to Create a Holistic Approach to Visibility

    Monitoring versus observability is a hotly debated topic. It’s been argued they’re two distinct things—the former just a high-level overview of a problem after the fact, while the latter enables you to be proactive. Observability has also been dismissed as jargon, much how DevOps sounds to the seasoned operator.

    The thing is, the whole debate misses the point: it’s not monitoring versus observability–the two are not mutually exclusive, but symbiotic. Like the Ouroboros—the ancient Egyptian symbol of a snake eating itself—monitoring and observability both feed each other.

    Monitoring tells you what’s broken and where you need to have a higher degree of visibility. In other words, if something is broken and you’re having difficulty telling why, you need to increase visibility (i.e., by adding more checks and instrumentation). The same can be said for observability—a term used to describe telemetry, event logging and trace data (and, it can be argued, in many ways a subcategory of the traditional sense of performance monitoring). Observability gives you the richest context, but the difficulty is in understanding the holistic view—AKA, where to look next.

    Say your observability tool shows 99th percentile latency and you see a huge uptick: you have to guess as to why there’s such an increase. Based on your own operator knowledge, it’s either the network introducing the latency or the database is unable to respond in a reasonable or consistent time—for example, the disk could be slow or you’re on a multi-tenant system and someone is consuming CPU time.

    The difference with monitoring in this scenario is it would let you know you exceeded your trend on latency, therefore something has gone awry. It’s the same path, but you still have to make logical jumps based on your own experience—unless you’ve gone ahead and contextualized these from the get-go by creating runbooks and checklists for certain failure scenarios. If a monitoring check is properly created it will provide guidance as to what to look at first, then the observability tool gives you the much lower-level insight to go through each of those prescribed steps. Another way to look at it is monitoring as step one and observability as step two. This way, you can see how monitoring and observability feed each other, rather than existing as wholly separate concepts or toolsets.

    It all comes down to context. Traditional tools for monitoring and observability encompass everything from traditional logging to telemetry data, but none of that matters unless you have context as to why a certain behavior is happening. With this traditional approach, your users become your monitoring–tweeting at you when your site is down—and that’s bad for business. You’re still going to have to guess the context, spelunking through a multitude of data points to figure out what went wrong. It’s a polarizing topic—perhaps not quite as polarizing as monitoring versus observability—but there is such a thing as too much data. My experience has taught me a curated approach to monitoring and observability makes better use of resources and helps combat alert fatigue.

    Context is key. Monitoring is the “what is down?” and the context that helps lead you to determine your “why.” Observability tooling lets you dig further into those whys. A modern solution needs to go beyond just alerts to offer rich context and actionable insight.

    Pairing monitoring best practices with an effective observability solution can both tell you something is wrong and offer rich context. You get to the why faster, making it easier to arrive at the right conclusions in a timely fashion. One approach that marries the concepts of monitoring and observability is to apply workflow automation principles to monitoring. Operators need to have the tools to automate their monitoring workflows (such as auto-remediation), and reserve alerts for complex tasks that can’t be automated.

    By laying aside the debate of monitoring or observability and acknowledging the ways in which they feed each other, operators can have a holistic view and deep context into their systems—ultimately improving their workflows and offering better end-user experiences.

    — Sean Porter

  • Connected Devices and IoT: How the DevOps Approach Can Help

    Connected Devices and IoT: How the DevOps Approach Can Help

    The evolution of connected devices has brought challenges associated with the complexity and managing huge volumes of data. These devices also bring the need for a huge ecosystem of continuous software deployment across numerous application delivery endpoints, including a diversity of devices, mobile, web and others.

    There exists also the opportunity to unify operations and development, thus giving rise to the DevOps environment within the product engineering and IoT space—encompassing tools, processes and people as a single unit for more efficient and coherent working.

    DevOps accelerators and services allow intelligent automation and power the industrial IoT and consumer IoT companies with the capabilities of deployment, testing, build and continuous integration.

    It enables the organizations in connected health care, telematics, networking, security and surveillance, and home and industrial automation to accelerate their product development cycle, deliver significant cost savings via release efforts and reduced outages, enable operational scalability and improve code quality. It will enable the solution and product companies to accelerate their prototype to product cycle and decrease deployment time to days from months.

    Application reliability and availability are the ultimate measures of the success of IT. DevOps applies lean and agile practices all through the software life cycle to attain faster deployment and high-quality application development. Also, DevOps alleviates the rising complexity caused due to new computing trends including mobility, cloud and virtualization via increased automation. Now, let’s dig deeper into the importance of DevOps in the world of IoT and its applications.

    DevOps in the IoT

    The most effective DevOps transformations take a holistic approach, which means taking care of the entire organization in all aspects. This implies including all the constituents of the application, including quality assurance, operations and development teams, line managers and business owners. The constituents may also extend to compliance and security teams. The cross-functional inputs for software functionality and system requirements generates an ongoing feedback loop that helps reduce complexity and promotes engagement.

    Thus, one of the advantages of DevOps is improved collaboration and communications across the company. Deeper collaboration between quality assurance, operations and development teams follows an approach in which they all with collaborate with the client for designing a customized solution to fit their requirements and needs.

    Application testing should reproduce the function of a production system environment. Then, the DevOps teams can locate dependencies, gain knowledge on the functioning of an application when it is in the live environment and, accordingly, make adjustments to the compute environment. These processes become repeatable and iterative with automation and practice, allowing for more deployment, testing and development.

    Analytics and performance monitoring come earlier in the life cycle by moving the testing forward in the process. DevOps can develop performance analytics models which can predict quality and operational problems before deployment rather than waiting to acquire post-production performance data to examine what went wrong.

    These metrics can be utilized to establish KPIs (key performance indicators) and the production environment can be measured against them. The user experience and application performance can be improved as production metrics adhere more consistently to the key performance indicators. At this stage, sharing the data with business teams allows for adjustments to be made with less stress and faster, and accelerates the feedback loop.

    Continuous integration allows for better agility and collaboration to enhance code validation, which in turn reduces risks. The automated processes make for releases of higher quality that are easier to handle once they are in production.

    Treating the infrastructure configurations as code enables DevOps teams to handle provisioning on the fly in software and this sets the stage for the eventual migration towards a completely software-defined environment. With the emergence of the IoT, DevOps will become even more important. The precision of the services and software controlling networks, devices and sensors is critical as every device becomes interconnected in a software-defined environment.

    Conclusion

    Today, DevOps has become the main destructive force in the adoption of many technologies such as blockchain, which is the technology behind cryptocurrencies such as the bitcoin wallet. Owing to its substantial impact on business outcomes, operational efficiencies and deliverables, DevOps has become the major reason behind the evolution of IoT.

    — savaramravindra