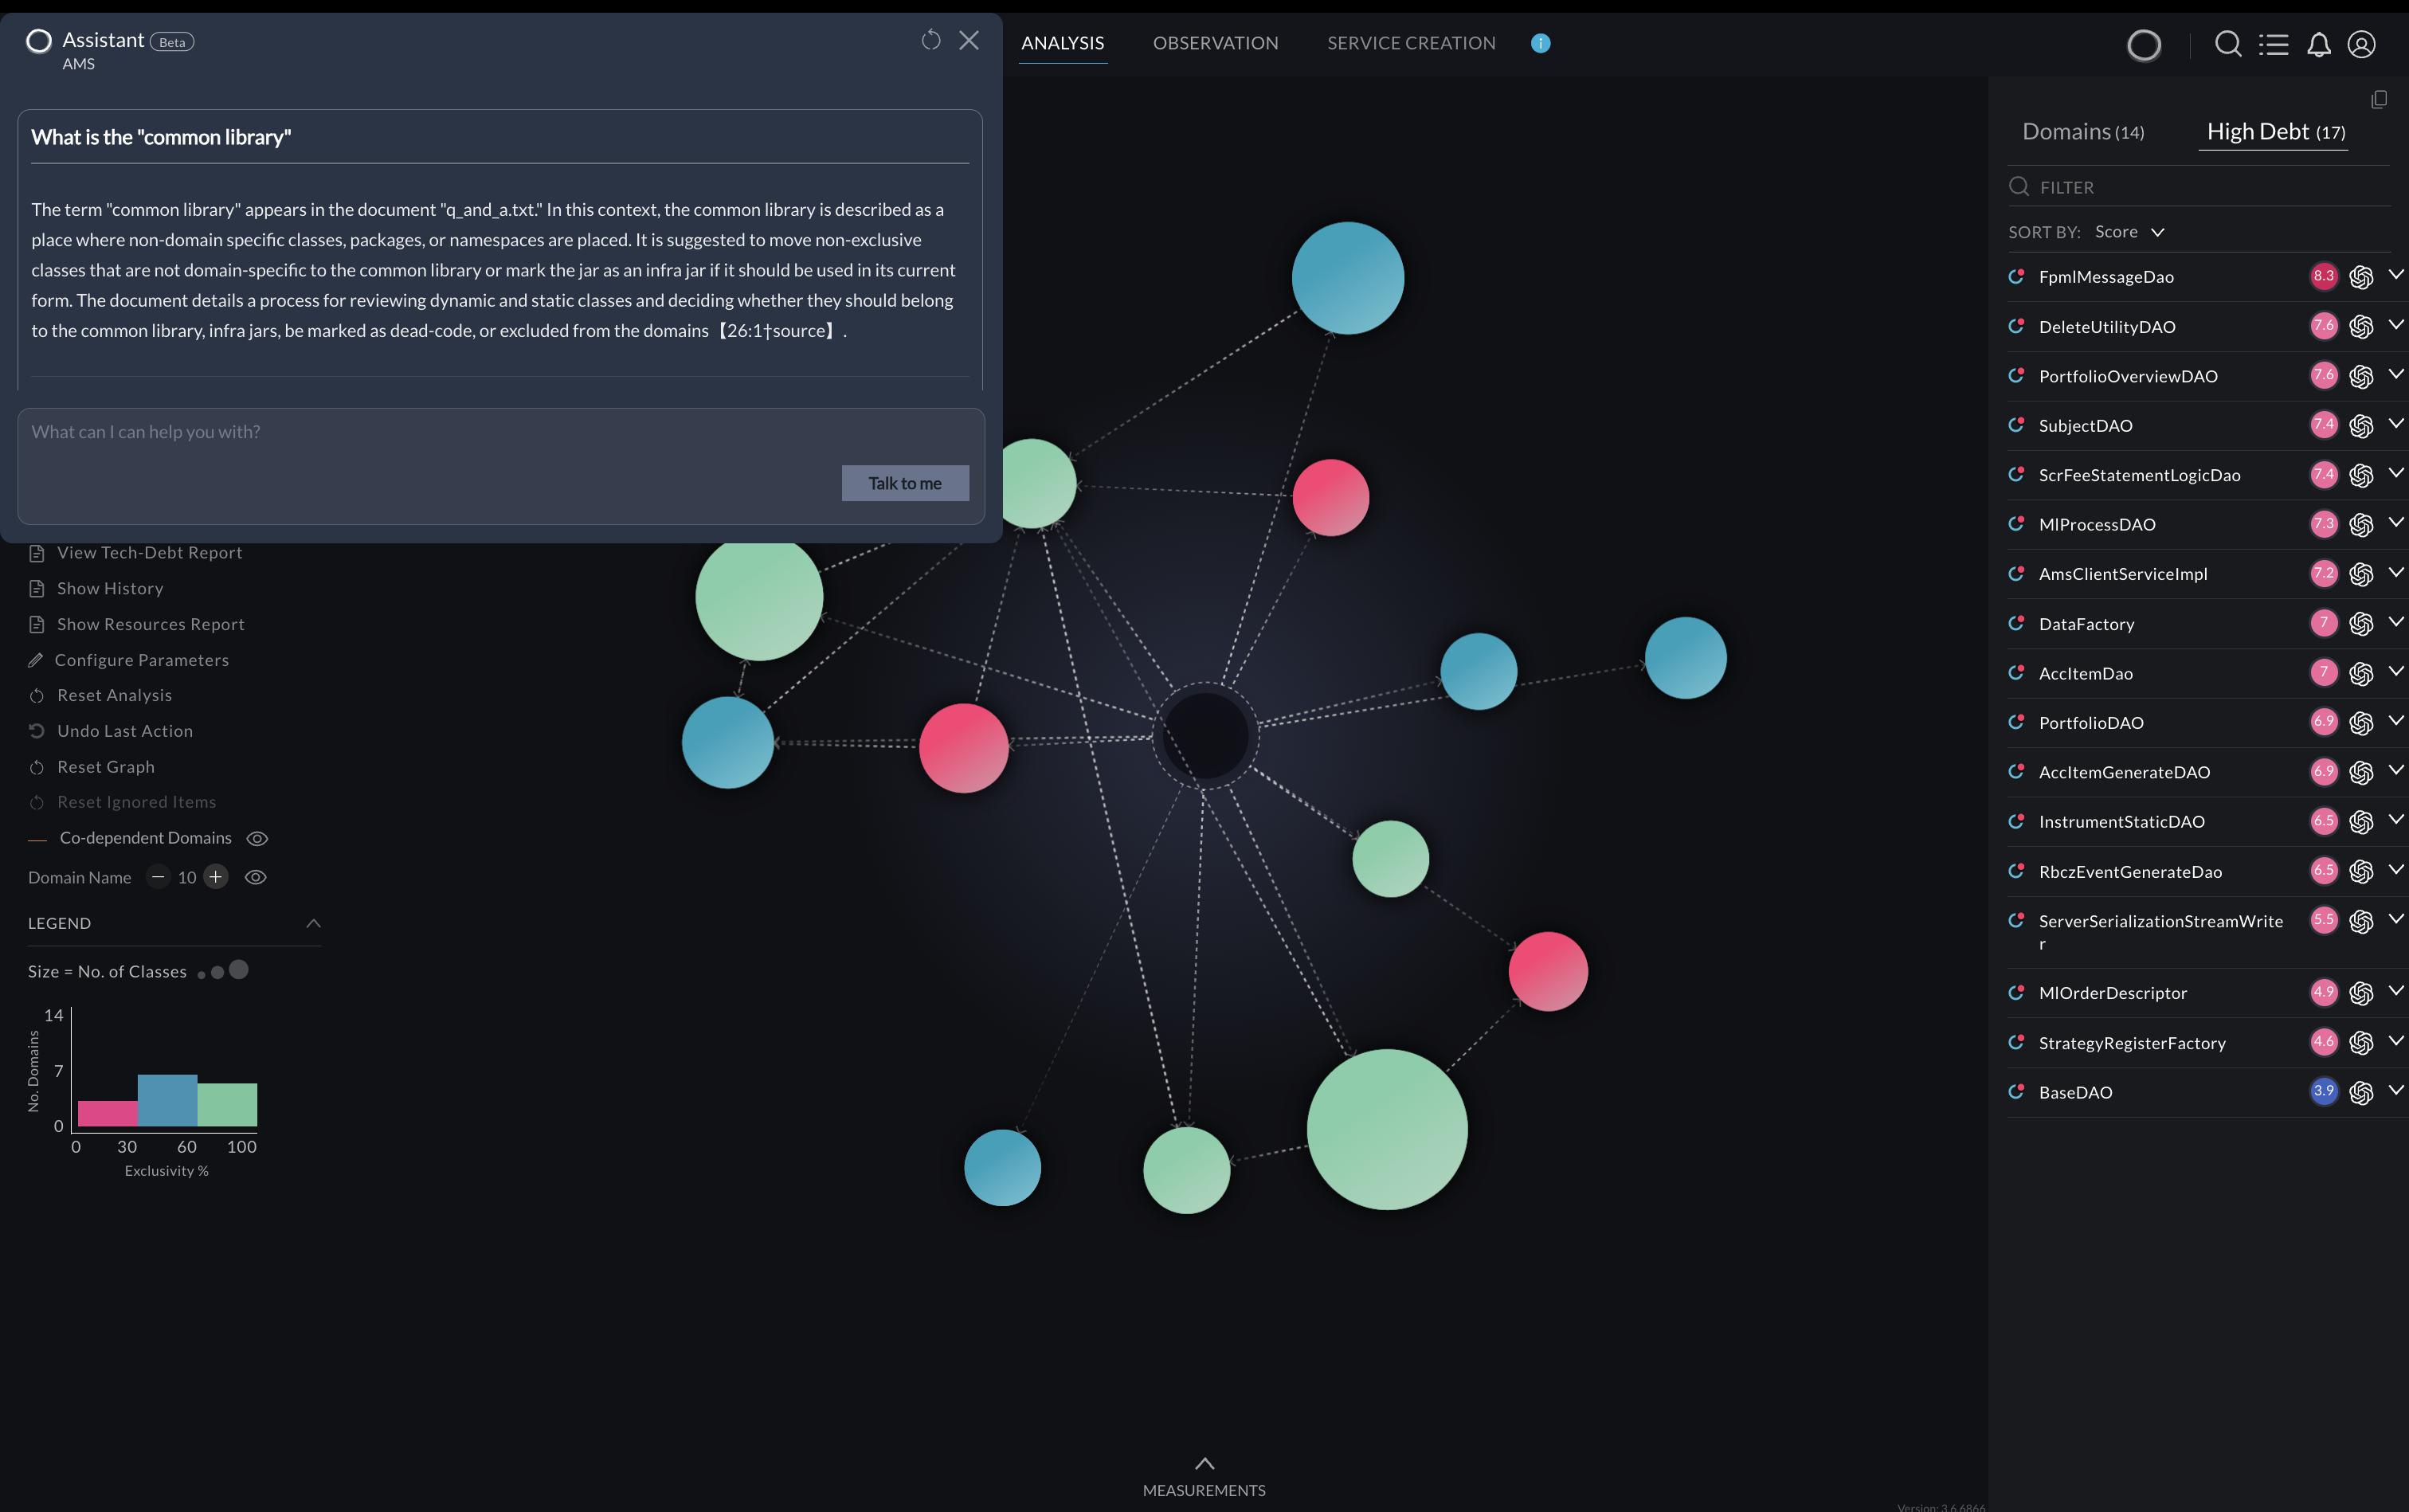
Cisco this week previewed a generative artificial intelligence (AI) assistant to the Cisco AppDynamics observability platform along with integrations to the IT Service Intelligence (ITSI) platform from Splunk and a Splunk Log Observer Connect for Cisco AppDynamics to the platform it gained earlier this year by acquiring Splunk.
Announced at the Cisco Live! 2024 event, Cisco in the third quarter will also make it possible to host Cisco AppDynamics on the Microsoft Azure platform.
Cisco also announced that it will no longer sell the Cisco AppDynamics Platform for Cloud Native Application Performance Management (APM). That platform will be replaced by Splunk Observability Cloud.
Cisco also added additional data science and machine learning algorithms capabilities to ITSI to streamline the number of alerts the platform generates. Now generally available, the Configuration Assistant in Splunk ITSI provides a centralized console by providing insights into outdated threshold models that can be optimized using guided remediations surfaced by AI models.
Finally, Cisco has enabled single sign-on capabilities to streamline shared workflows between Cisco AppDynamics and Splunk via a single console. Those SSO capabilities will be extended across the Cisco portfolio to enable increased collaboration.
Tom Casey, senior vice president and general manager for products and technology for the Splunk product portfolio, told conference attendees the platforms will gradually be integrated into a single data platform, including Cisco AppDynamics, the Cisco ThousandEyes networking monitor service and the Splunk platform. That approach will also allow Cisco to provide best-in-class capabilities for everything from application performance monitoring to digital experience monitoring across a hybrid cloud computing environment, he added.
Paul Nashawaty, practice lead for application development at The Futurum Group, said these combined capabilities highlight Cisco’s commitment to providing comprehensive visibility at a time when distributed IT environments are becoming increasingly more challenging to manage.
It’s not clear to what degree organizations are unifying observability, network monitoring, and traditional IT service management (ITSM), but Cisco is clearly betting IT leaders will prefer to standardize on a single vendor to reduce integration costs that would otherwise be incurred when using platforms provided by disparate vendors. That centralized approach will also make it simpler to train multiple AI models that will be used to further automate a range of workflows that today span multiple IT siloes.
Less clear, however, is to what degree the acquisition of Splunk might contribute to a consolidation of IT platforms as rivals make similar acquisitions to drive a more platform-centric approach to unifying the management of IT.
Each IT organization needs to decide how to best structure themselves as workflows across those teams become more integrated. Certainly, the overall size of application portfolio to be managed is only going to continue to expand as AI makes it simpler to build and deploy software. As a result, IT teams most certainly need to apply best DevSecOps practices at higher levels of scale to ensure application availability across highly distributed computing environments.
We all know how big a role observability plays in DevOps, but using it is easier said than done. Logz.io, with its cloud-native SaaS observability platform, Open 360, pulls together logs and metrics. It traces data from open source monitoring programs such as Prometheus, OpenTelemetry, Fluetnd with OpenSearch above it all to help you see what’s what in your systems.
Now Logz.io has added IQ Assistant, an AI-driven chatbot, to make it easier to find your important monitoring data and make sense of it.
Logz.io has been working on the chatbot’s back engine, AI-Driven Observability IQ, for some time. The goal is to provide not just quick answers for real-time issues via the Apache Lucerne search engine, but to provide context, conclusions and response steps.
I like this plan. I like this plan a lot.
What appeals to me about Logz.io’s AI chatbot is that it’s not just a passive AI that relies on known errors and proven troubleshooting steps. Rather, the AI-driven SaaS application combines a proprietary Logz.io AI with a large language model (LLM) to learn from an environment and user actions. That means it can get better at its job of analyzing your environment and providing you with the best mitigation suggestions. If it works, this will help you resolve issues faster and reduce your mean time to remediation (MTTR).
Other current Open 360 platform AI-based features include:
Anomaly detection for App 360: Uses AI to detect service anomalies, providing real-time insights into the performance of services, operations, metrics, and endpoints.
Alert recommendations: Employs supervised machine learning to model user actions and advise subsequent users facing similar issues.
Data optimization hub: Offers AI-based observability pipeline analytics, providing automated recommendations for managing data volumes and costs effectively.
Cognitive insights: Uses generative AI to highlight important log data, linking to related information and best practices for quick issue resolution.
The chatbot is only the start. Logz.io is formalizing its AI strategy to include several additional features, and it promises announcements throughout 2024 and beyond.
So, if you want to use the data from your open source observability programs better and more timely, check it out. As Logz.io CTO Asaf Yigal pointed out, it won’t replace your DevOps team, but it will make it easier for the team to do its job.
vFunction, the AI-driven architectural observability platform today added real-time observability and GenAI assistant.
vFunction today added an ability to observe IT architectures in real-time to a platform that automatically converts monolithic application code into a set of microservices.
In addition, vFunction has added a generative artificial intelligence (AI) assistant that identifies issues and surfaces recommendations as changes are based to application environments. Based on the ChatGPT-4 service created by OpenAI, the vFunction Assistant is designed to make it simpler to remediate and refactor applications.
Leveraging OpenTelemetry
vFunction CEO Moti Rafalin said these capabilities all leverage OpenTelemetry, open-source agent software being advanced under the auspices of the Cloud Native Computing Foundation (CNCF) to collect telemetry data.
It’s not clear how many applications are instrumented using OpenTelemetry, however, a survey of 1,000 software engineering professionals conducted by vFunction suggests that as organizations look to streamline the management of application environments there is a clear need for increased visibility. A full 80% said these capabilities are either extremely or very valuable, with nearly four in 10 (39%) acknowledging they lack visibility into their IT architecture. A total of 40% said they advocate for a “shift left” approach to proactively address resiliency concerns earlier in the development lifecycle.
A similar percentage (41%) also plans to leverage generative AI to improve application performance and scalability, the survey finds.
The survey also finds more than half (51%) of respondents work for organizations that dedicate more than a quarter of their annual IT and engineering budgets to remediating applications, including refactoring and re-architecting efforts. More than three-quarters (77%) have implemented enterprise-wide initiatives to address technical debt.
Among those respondents, 57% work for organizations allocating more than a quarter of their IT budget to technical debt remediation involving monolithic applications, compared to 49% for microservices architectures. More than half 53% also noted their organization delayed major technology migrations or platform upgrades due to productivity concerns involving microservices. The survey also finds that 44% noted monolithic application complexity that results in a lack of clear domain boundaries and decreasing modularity is a major challenge.
Most application environments will be made up of monolithic and microservices-based applications for the foreseeable future. The challenge that organizations encounter is that as changes are made to application environments the level of drift away from the original architecture starts to increase.
Apply AI to Reduce Drift
At the same time, organizations accumulate technical debt as issues that should be remediated are left to be addressed at some future date. Unfortunately, many of those issues are never resolved, simply because new application development projects require DevOps teams to divert limited resources. However, as more applications are instrumented it becomes feasible to apply AI to reduce both drift and technical debt.
Each organization must determine to what degree they wish to modernize existing applications versus replacing or retiring them altogether. However, there are plenty of instances where legacy applications are still far too critical to be replaced. The challenge then becomes to what degree to update these applications, in a way that makes them more resilient and flexible as business requirements continue to evolve.
StarTree broadly enhances its real-time database platform by adding query support for metrics, logs and traces.
StarTree today made a case for becoming the foundation upon which observability is gained in IT environments by adding support for metrics, logs and traces to its real-time database platform delivered as a cloud service.
In addition, the company is also making generally available a StarTree ThirdEye service for detecting anomalies and identifying the root cause of application issues. It has also made a free serverless computing tier available on its cloud service.
Viable Alternative to the Legacy Database
Announced at the Real-Time Analytics Summit conference, StarTree Cloud is based on Apache Pinot, an open source columnar database optimized for real-time analytics, originally developed by LinkedIn. StarTree, via a private preview, is signaling that it views Apace Pinot as a viable alternative to the legacy database, upon which observability platforms DevOps teams use to troubleshoot IT environments.
StarTree, to further advance Apache Pinot, is also now adding a vector indexing capability to Apache Pinot along with support for a write application programming interface (API) to facilitate real-time synchronization with extract, transform and load (ELT) pipelines and additional integrations to Grafana and Tableau to improve visualizations.
Chinmay Soman, head of product for StarTree, said the issue with existing databases is they are not designed to scale to the level of performance that modern application environments will require.
Early Days for Achieving Observability
It’s still early days for achieving observability in application environments but many DevOps teams are now moving well past simply monitoring a set of pre-determined metrics. Observability platforms enable DevOps teams to launch queries that make it easier to troubleshoot applications. Not every DevOps team knows what queries to investigate. With the rise of artificial intelligence (AI), it’s becoming more feasible to rely on machine learning algorithms to analyze application environments using metrics, logs and traces stored in an observability platform.
Few DevOps teams will build an observability platform themselves but the capabilities of the underlying databases on they are based are critical, said Soman. DevOps teams should make certain the databases used in these platforms today will be able to scale to meet real-time processing requirements that will only steadily increase as more complex applications are deployed across distributed computing environments, he added.
In the meantime, StarTree is moving toward providing more observability capabilities via the managed database service it provides via the cloud.
It’s only a matter of time before DevOps teams need deeper levels of visibility to manage modern application environments in real time. As organizations become more dependent on software than ever, even the most minor glitch can now have a major financial impact. The challenge DevOps teams face, of course, is finding the funding needed to acquire these capabilities.
In the meantime, DevOps teams should at the very least start assessing which of the many monitoring tools being employed today might one day be rationalized by an observability platform, that in time might lower total costs by streamlining DevOps workflows that today are often more disjointed than anyone cares to admit.
Embrace revealed today it is adding support for open source OpenTelemetry agent software to its software development kits (SDKs) that enable observability of iOS and Android applications.
Andrew Tunall, head of product for Embrace, said that as more DevOps teams standardize on OpenTelemetry to collect telemetry data from applications, there is a growing requirement for observability platforms to support it.
DevOps teams can now use the Embrace SDKs to export telemetry data from mobile applications to any backend observability platform that supports OpenTelemetry, he added. Initially, Embrace is providing support for logs and traces, with support for metrics to soon follow.
Embrace developed an observability platform initially designed specifically for engineering teams working on mobile applications. Now many of those teams are collaborating with DevOps teams as more organizations take a mobile-first approach to application development, noted Tunall. Embrace customers include Adidas Runtastic, Cameo, GOAT, Hatch, Ibotta, Marriott, The New York Times, Warby Parker, Yahoo! and Wildlife Studios.
OpenTelemetry Gaining Traction
Being advanced under the auspices of the Cloud Native Computing Foundation (CNCF), OpenTelemetry defines an instrumentation format that makes it simpler to centrally manage the collection metrics, logs and traces using open source software. It is gaining traction as more DevOps teams look to rationalize the amount of commercial agent software they need to deploy, update and manage.
Too many organizations, however, are still relying on legacy real user monitoring (RUM), error and bug tracking, and crash reporting tools to manage mobile applications that don’t provide the level of insight required to identify the root cause of a performance issue said Tunall. Observability platforms, in contrast, make it possible for DevOps teams to collect telemetry data they can query versus tracking a few simplistic metrics, he added. In the case of Embrace, the data includes signals such as crashes, errors, application not responding (ANRs), performance traces, memory issues and full user sessions.
Cost-Efficient to Centralize the Management of Applications
Mobile applications require that capability because they can be especially challenging to troubleshoot when, for example, trying to account for network latency as DevOps teams seek to achieve and maintain specific service levels to ensure a high-quality application experience is consistently delivered, noted Tunall. Most end users are not especially forgiving whenever they experience an issue because it’s often relatively trivial for them to switch to another application, he added.
It’s not clear to what degree teams that were once dedicated to managing mobile applications are being folded into DevOps teams but just about every organization that builds software now supports at least one or more mobile applications. While mobile applications have unique requirements, it’s ultimately going to be more cost-efficient to centralize the management of applications regardless of what platform they run on.
In the meantime, DevOps teams should expect the overall size of the mobile application portfolio to only continue to grow. The challenge now is melding the tools currently used to manage those applications with the DevOps platforms currently being used to manage every other type of application.
Achieving full observability across enterprise applications is challenging. While third-party services like New Relic or Datadog make end-to-end observability easier, as your application grows in complexity, so does the telemetry data, leading to increased costs. Migrating to an open source stack gives you control over telemetry data and reduces observability costs, despite challenges with existing service provider commitments.
Migrating to open source solutions is straightforward with simple architecture and tech stacks. However, transitioning the entire observability stack to open source demands meticulous planning, tools/frameworks assessments, testing, risk analysis, and cross-team communication, especially given the number of microservices, heavy cloud reliance, and diverse languages and frameworks to take into account.
A cloud observability platform usually absorbs 20%-30% of overall infrastructure spending, but in some cases, it can reach 50%-60%. If your observability expenses exceed 50%, then transitioning to open source solutions would be a sensible option to mitigate tech infrastructure costs.
For the past two years, I have been working on migrating the observability platform from a proprietary solution provider to an open source stack. Let’s dive into the key steps necessary for such a migration.
Finalize the key telemetry data and systems
Managed observability platforms offer comprehensive insights into system health, necessitating a significant volume of high-quality telemetry data. By default, the agents tasked with capturing and transmitting telemetry data are configured to gather as much information as possible, facilitating the creation of extensive dashboards and reports. However, this extensive data collection contributes to the overall cost.
Select which systems you actually need to monitor. A typical enterprise application includes databases, caching databases, container orchestrators, and numerous cloud services. Engineers often monitor more services than necessary, which leads to unnecessary complexities and costs. It’s often sufficient to streamline the monitoring scope to essential systems.
In my experience, the quantity of telemetry data required is significantly lower than what third-party services typically retrieve. You can easily divide those data collections into two buckets: must-have and nice-to-have. The “must-have” data aligns with the well-established four golden signals:
Latency: the amount of time it takes to serve a request
Traffic: the volume of requests that a system is currently handling
The error rate: the number of requests that fail or return unexpected responses
Resource saturation: the percentage of available resources being consumed
These fundamental signals serve as the foundation for key dashboards and alerts. Observability platforms built on these signals cover 80% of typical use cases.
Understanding each signal’s metadata requirements is crucial. The extent of metadata captured directly impacts the observability platform’s complexity and cost. For example, when monitoring service-to-service latency, consider the necessity for service IP addresses, instance IDs, or header information.
Select the relevant stack
Managed observability platforms such as New Relic and Datadog provide comprehensive monitoring for various enterprise components. However, when you migrate to an open source stack, you must assess and integrate the tool stacks to meet diverse monitoring requirements.
One important aspect to consider is scaling: how to manage the huge amount of data generated every minute across all those systems. Focus on two fronts: selecting the stack for storing and processing telemetry data (logs, metrics and traces) and devising methods for capturing and pushing telemetry data from diverse systems.
Telemetry signal stack selections
Stack for logs
You require a stack that can efficiently and economically process and store the substantial volume of logs generated by the system. In the past, I used the ELK stack for storing and searching logs, but it is a generic solution and not tailored specifically for logs.
I recommend Grafana’s Loki for its effective management of large log volumes and LogQL, a language akin to PromQL. If you are familiar with PromQL, navigating through extensive log data with LogQL is easy and intuitive.
Stack for Metrics
Prometheus is a popular database for storing time-series metrics data. However, it has scaling-related limitations; it cannot scale horizontally. Alternatives like Thanos, Grafana’s Mimir, and VictoriaMetrics offer better out-of-the-box solutions for horizontal scaling.
I conducted some research and ultimately chose Grafana’s Mimir to store metrics in a similar migration project. This decision was based on Mimir’s remote storage capability, as well as its scalable and highly available architecture.
Stack of Tracing
Distributed tracing is a must in a microservices architecture, for easily identifying bottlenecks in latency and for resolving performance-related bugs. Grafana’s Tempo could be a good option for several reasons:
It can seamlessly integrate as a backend for Grafana’s dashboard. Consolidating dashboards in Grafana helps avoid navigating between multiple applications. Switching platforms just for tracing while using Grafana for other aspects of observability would not be practical.
Tempo provides a similar experience to TraceQL when interacting with the database, streamlining the learning process and significantly reducing the learning curve.
Tempo is compatible with popular open source tracing protocols such as Zipkin and Jaeger. If any team already uses these protocols, transitioning to Grafana’s Tempo would be smoother.
Capturing and pushing telemetry data
You have to install an agent on the system to capture and push the telemetry data. Those steps vary based on the system being monitored. Typical enterprise application setups involve monitoring cloud integrations, process monitoring, infrastructure hosts, Kubernetes clusters and application monitoring. Among the possibilities:
Cloud integrations: This includes monitoring for cloud services such as SQS, SNS, EMR and EC2.
Process monitoring: This involves monitoring processes running on bare-metal machines. With the advent of dockerization and Kubernetes, there is now a standardized way of starting the application. In the past, there was no fixed mechanism. For example, to run a Java application, you could use a Java application, the ‘java -jar’ command, Tomcat, or OS systemctl. In the case of node, it could be npm or PM2. Each team or service may have had its own way of starting the process.
Infrastructure host: This entails monitoring the machine itself for metrics such as CPU usage, memory, disk I/O and Network IO or checking if the machine is offline.
Kubernetes monitoring: You regularly need to monitor a Kubernetes cluster, such as instances where Kubernetes is unable to schedule a pod due to insufficient resources.
Application monitoring: This monitoring focuses on overseeing the services the team created. Each service may differ in its development approach and choice of tech stack; but from an observability perspective, they usually are treated the same.
Browser and mobile monitoring: These metrics ensure optimal performance and user experience across different platforms. Browser monitoring includes tracking page load times, rendering performance, JavaScript errors and resource usage. For mobile, it includes monitoring app crashes, latency, battery usage, network requests and device-specific metrics.
Before the advent of OpenTelemetry, there was no standardized method for monitoring applications. OpenTelemetry emerged from the merger of two earlier projects, OpenTracing and OpenCensus. It stands as a vendor- and tool-agnostic framework to instrument applications or systems irrespective of language, infrastructure or runtime environment. OpenTelemetry represents a significant community effort, and its popularity and stability are steadily growing.
Validate observability stack on application architecture
Applications vary in architecture and development stages. To address this diversity, you need multiple proofs-of-concept (POCs) across different systems, such as infrastructure, cloud service and backend and frontend applications.
Migrating an observability platform from one tech stack to another is simple when the application architecture is a monolith. However, when the underlying architecture is microservices, it becomes difficult.
While the microservices architecture offers flexibility in choosing different tech stacks for building services, devising a standard solution for capturing telemetry data becomes challenging due to the diverse range of tech stacks involved.
Conducting POCs for various tech combinations is necessary to build a self-service tool that individual teams can follow to migrate their services easily. For instance, if your service uses Java 11, Spring Boot 3.x.x and PostgreSQL, these POCs can provide standardized steps to enable application monitoring.
Migrate core components
Setting up the observability platform involves configuring the stack for metrics, logs and traces, as well as installing the necessary agents. One advantage of migrating the observability platform is that there’s no need to transfer old telemetry data. During the testing phase, you will have an overlapping period to accumulate enough useful data to create specific dashboards and alerts.
Migrating alerts and dashboards to the new system is essential, even when data migration is not necessary. This is because changes in the underlying techniques for capturing metrics may modify the names of the metrics and subsequently change all query expressions used in alerts and dashboards. Some metrics may not be available in certain scenarios, especially derived metrics that can be recreated from underlying metrics.
While migrating query expressions manually is an option, a manual process is error-prone and time-consuming for a large number of alerts. I had experienced a similar situation with alert numbers ranging from 100 to 400.
To streamline the migration, we developed a Node.js script that programmatically converted New Relic’s query expressions to Prometheus expressions. The script performed the following high-level steps:
Connected to the New Relic API server and fetched all the alerts configured for cloud integration
Converted New Relic alert expressions into PromQL alert expressions
Wrote all the Prometheus alert expressions into the YAML file
Implementing this technique allowed us to successfully migrate all alerts and dashboards in four or five days, a process that would normally demand a month’s manual labor. Additionally, scripting significantly minimized the risk of human error.
Test the migration
Verify each alert and dashboard. Run both old and new platforms during testing. Parallel operation permits thorough testing of the metrics.
However, running both systems concurrently may lead to a performance hit due to services sending telemetry data to two locations. Additionally, there may be a slight increase in costs until the complete transition.
Running both systems in parallel provides an ideal setup to ensure the migrated dashboards and alerts are functioning correctly.
Testing alerts that trigger during this process is straightforward, but evaluating those that have not yet triggered poses a challenge. In one project, I reduced the threshold value of each alert and tested its functionalities. Approximately 90% of the alerts generated through custom scripts worked seamlessly, with only 10% requiring some manual tweaking.
Migrate other related components
Other systems depend on the data generated by the observability platform. For example:
Notification systems like email, Slack channel, etc., that alert in case of an incident
Incident management tools like PagerDuty provide a streamlined way to handle incidents.
These systems rely on the alert’s payload to work properly. Their assets should be updated, as a change in the observability platform leads to a change in the alert payload. Update the templates of notification systems to ensure they seamlessly integrate with the new alert payload.
Similarly, incident management tools like PagerDuty require modifications to routing rules, escalation policies, and scheduling. Fortunately, readymade open-source migration tools are available to facilitate easy migration from PagerDuty to Grafana’s OnCall. However, in other solutions, you may not have access to out-of-the-box migration tools. In such cases, manual migration or script writing may be required.
Timeframe for the Migration
Planning a migration involves finalizing key telemetry data and systems, selecting relevant stacks. and validating the observability stack on the application architecture. It typically takes around three weeks.
The project duration depends on factors such as the number of teams involved and the quantity of active services. For instance, a migration to open source with 100 microservices and involvement from 10 different teams may take four months to complete.
Migration Complete!
Transitioning your observability platform to an open-source stack offers a promising avenue for cost reduction and increased control over telemetry data. However, accomplishing this migration demands meticulous planning and execution, encompassing essential steps like feature prioritization, stack selection, POCs, core component migration, testing, and the migration of related systems. Despite the challenges posed by diverse architectures and technologies, a systematic approach, comprehensive assessment, and collaboration among teams can facilitate a smooth migration process and guarantee its success.
Enterprises are under constant pressure to ensure their IT infrastructure and applications are available throughout the year. The complexity of modern architectures (containers, hybrid cloud, SOA, microservices, etc.) is constantly growing, generating vast volumes of unmanageable logs. We need intelligent application performance management (APM) and observability tools to achieve production excellence and meet the availability and uptime goals. These include analyzing application health, performance and user experience. Adopting machine learning techniques to identify anomalies and behavior patterns will help detect the root cause early and meet customer service level agreements (SLA).
The APM and observability tools market is undoubtedly hot. These tools ingest multiple telemetry data feeds and are powerful analytics platforms providing critical insights into application and infrastructure health, including system performance. The software development teams that adopt observability are much better equipped to release their application code iteratively. As per “MarketsandMarkets” research, the market size of observability tools and platforms is expected to grow from $2.4 billion in 2023 to $4+ billion by 2028 at a compound annual growth rate (CAGR) of 11.7%.
What is Observability?
Observability is the ability to collect data about the distributed applications, infrastructure and communication among its internal and external components and services, allowing teams to debug their systems diligently. It enables the site reliability engineering (SRE), software engineering and operations teams to analyze the customer impact and triage a service outage. Observability and monitoring are sometimes used interchangeably. Observability (proactive) makes the data accessible and allows you to ask any system question to know how the code behaves more deeply. Monitoring (reactive) is the task of collecting and displaying that data and the ability to determine the system’s overall state.
Observability can be further broken down into three key pillars: Logs, traces and metrics, which are essential for SRE observability.
• Logs help us diagnose the issues and tell us why they happened.
• Traces help us isolate issues and tell us where they happened.
• Metrics help us detect the issues and tell us what happened.
Market Tools, Capabilities and Challenges
Gartner’s magic quadrant for APM and observability has identified 20+ vendor products offering APM and observability capabilities, including self-hosted, vendor-managed or SaaS deployments. These products provide multiple features, including application performance metrics, monitoring and alerting on events, traceability, anomaly detection and vulnerabilities, etc.
An enterprise business application comprises homegrown applications (such as .NET, Java, Python, SQL, NoSQL DB, etc.), third-party/off-the-shelf products (such as Salesforce, HubSpot, etc.), and integrations (such as Stripe, PayPal, etc.). Homegrown applications are hosted in an on-premises data center or by cloud vendors like AWS, GCP, or Azure. The off-the-shelf products are SaaS-based or integrated via APIs. There are highly distributed applications spanning tens and hundreds of nodes, services and instances.
• Too Many Tools: Enterprise applications use various tools for monitoring application health and performance (such as New Relic, Data Dog, etc.), Error logging (such as Splunk), and cloud vendor-provided tools (such as CloudWatch). These products overlap in functionality and maintaining and managing these tools (procurement, learning curve, etc.) can be cumbersome.
• Unpredictable Data Volume: Imagine the volume of observability data (logs, traces, metrics) collected based on the application traffic, usage, dependency on external products, etc. The amount of data storage required to consolidate these data feeds can quickly grow out of control.
• Pricing is Complex: These vendor products also offer different pricing models such as charge per host (such as Splunk, Data Dog, Dynatrace), per-user (such as New Relic), per-ingestion (such as SumoLogic, AppDynamics). The complexity of pricing models makes it challenging to compare total cost of ownership (TCO) among vendors and determine the right tool that fits your requirements and budget.
Why Choose Open Source Observability Platform?
Open source-based observability tools aim to provide a standard, vendor-agnostic approach for ingesting, transforming and sending data to an observability backend. The open source observability tools can be an alternative to save on licensing costs and consolidate multiple APM tools with the tool that fits your requirements and budget.
However, maintaining open-source systems may require efforts to set up and maintain and will add to your initial operational cost. But in the long term, you will save on licensing fees and avoid vendor lock-in and contractual agreements.
Gartner predicts that, by 2025, 70% of new cloud-native application monitoring will use open-source instrumentation rather than vendor-specific agents for improved interoperability, and 70% of new cloud-native applications will adopt OpenTelemetry for observability rather than vendor-specific agents and software development kits (SDKs).
Scale Observability Using the Open Source Ecosystem
The open source landscape for observability is quite dynamic. There are multiple Cloud Native Computing Foundation (CNCF) open source tools for observability and monitoring. This post will primarily focus on the OpenTelemetry framework and LGTM technology stack.
OpenTelemetry:
The “too many tools” challenge described above brings up a new struggle in telemetry data collection. Each tool vendor has its own APIs, SDKs, agents and collectors for logs, metrics and traces. We need a unified telemetry collection using the OpenTelemetry framework to create and manage telemetry data such as logs, traces and metrics.
The OTEL project under the auspices of the CNCF offers a unified set of vendor-agnostic APIs, SDKs, and tools for generating and collecting telemetry data and exporting it to various analysis tools. You get one API and SDK per programming language to extract your application’s observability data, a standard collector, a transmission protocol (OTLP) and more.
LGTM:
The most popular open source-based observability and monitoring is implemented using the LGTM technology stack.
In the LGTM stack, we leverage:
• Loki for log aggregation
• Grafana dashboards for telemetry visualizations
• Tempo (or Jaeger) for trace aggregation
• Managed Prometheus for metrics aggregation
Conclusion
Observability is about complete visibility across your systems and tying business metrics with technical data. Monitoring is about understanding if things are working correctly, and AIOps is about getting meaning from that visibility. Observability and monitoring are critical to ensure the smooth functioning of applications and meet customer SLAs. In conclusion, by investing in open source OTel frameworks and LGTM tools, SRE teams can effectively monitor their applications and gain insights into system behavior and potential issues. These tools offer cost-effectiveness and customization to suit specific requirements. It promotes vendor neutrality, which can be critical for avoiding vendor lock-in.
A global survey of 500 IT professionals suggests organizations are not making a lot of progress in their ability to truly observe application environments, especially as they become more complex with each passing day.
The survey, conducted by Logz.io, a provider of an observability platform, found only one in 10 respondents reported they have full observability into their application environments.
Logz.io CTO Asaf Yigal said while more DevOps teams than ever are collecting logs, metrics and traces, most of them have yet to determine how to operationalize all the data being collected. As data is ingested, it doesn’t just need to be stored; it also needs to be correlated to the various services that make up an application, he noted.
The more organizations deploy cloud-native applications in production environments the more pressing this issue becomes. All the microservices that make up those applications are now generating a massive amount of telemetry data that results in more alerts than ever being generated.
Not surprisingly, the biggest challenges organizations encounter when managing Kubernetes clusters in production environments are monitoring/troubleshooting (40%), followed closely by security (37%) and networking (33%).
Many organizations simply don’t have the skills required to manage cloud-native applications. Nearly half of respondents (48%) specifically cited a lack of knowledge as the biggest challenge they encountered when trying to observe these types of applications. From an IT management perspective, most microservices all use the same basic template, so it’s difficult for DevOps teams to identify which microservices are likely to have the biggest impact on service level objectives (SLOs) and service level agreements (SLAs) in the event of a disruption, noted Yigal.
In the absence of the ability to determine the actual root cause of an issue, alert storms conspire to increase fatigue—and that eventually results in higher levels of burnout across the DevOps team, noted Yigal. In fact, 82% of respondents said their mean-time-to-resolution (MTTR) during production incidents was more than an hour.
The survey also noted that more than half of respondents (52%) worked for organizations that are simultaneously trying to rein in monitoring costs. More than three-quarters (76%) of respondents also noted that open source OpenTelemetry (OTEL) or OTEL-centric tooling was at least somewhat important to their overall observability strategy.
In addition, 87% of respondents said their organization is already using some form of platform engineering to manage DevOps workflows at scale.
It’s not clear how quickly organizations are adopting observability tools and platforms, but too many DevOps teams lack the visibility needed to identify the root cause of an issue. As a result, variations of the same problems often keep manifesting themselves because previous remediation efforts simply didn’t go deep enough to resolve the core issue.
Of course, there may come a day when machine learning algorithms, along with other forms of artificial intelligence (AI), will make it simpler to surface these issues. The challenge, in the meantime, is laying down the observability foundation today to provide access to the data that will be required to train those AI models.
This week at the KubeCon + CloudNativeCon Europe conference, the maintainers of the open source OpenTelemetry observability agent software project being advanced under the auspices of the Cloud Native Computing Foundation (CNCF) revealed they have added profiling capabilities to enable DevOps teams to identify the root cause of issues down to a specific line of code.
Austin Parker, director of open source for Honeycomb and a maintainer of OpenTelemetry, said while several providers of IT observability platforms have in the past year added code profiling capabilities, it makes more sense to provide this as a capability surfaced by OpenTelemetry in a way that any IT platform can easily consume.
The overall goal is to reduce the amount of time it takes to troubleshoot IT issues by identifying not just the code at issue but also the development team responsible for it, noted Parker.
OpenTelemetry defines a format that makes it simpler to centrally manage the collection metrics, logs and traces using open source software. In general, OpenTelemetry continues to gain traction as DevOps teams look to rationalize the amount of commercial agent software they need to deploy, update and manage.
In effect, OpenTelemetry is aggregating agent software that, in terms of observability, provides no differentiated value, said Parker. That’s critical because as application environments become more complex, it’s all but impossible to manage them without being able to broadly apply the agent software required to instrument them.
Ultimately, as OpenTelemetry becomes more widely employed, it makes it significantly easier for developers to understand how their application is performing, noted Parker. Over time, armed with those insights, developers will build and deliver higher-quality applications, he added.
It’s still early days as far as adoption of OpenTelemetry is concerned, but it’s clearly well on its way to becoming a de facto standard for enabling observability. The number of developers who have access to not just metrics and logs but also traces should steadily increase as the cost of instrumenting code declines.
Of course, finding a way to collect that data inexpensively will also be crucial for applying artificial intelligence (AI) to DevOps workflows. After all, before an AI model can be trained, it needs access to verified data.
In the meantime, DevOps teams might want to consider at what rate they can replace existing commercial agents deployed across the enterprise. Much of that agent software is more mature than OpenTelemetry, but over time, the economic arguments for using open source agent software become compelling. Many of the providers of observability platforms have already made support for OpenTelemerty available by default.
Regardless of approach, the need for observability has always been apparent. The issue is that there is a world of difference between monitoring a pre-defined set of metrics and being able to launch queries to identify the root cause of an issue that metrics alone are not going to be able to surface.
Performance issues regularly confound DevOps teams after an application is deployed, despite the number of tests run before deployment. Upon further investigation, the issue that is most frequently overlooked is the distributed nature of the application itself. End users accessing applications from multiple locations are never going to have the same level of internet service, so software that may be running perfectly well in locations that are major urban technology hubs, such as New York, San Francisco or London, is not necessarily going to provide the same experience in farther-flung regions, especially rural areas that are halfway around the world.
All internet services are not created equal. Intermittent network latency issues can have a profound impact on application performance simply because of the laws of physics. The farther away an end user is from the data center where the application is hosted, the more likely it becomes network latency will adversely affect application performance.
Unfortunately, most DevOps teams lack any visibility beyond the data center environment where the application is running. Naturally, the first step toward gaining that level of insight starts at the edge of the network.
Internet Stack Visibility
There is a wide range of services that make up an internet stack, each of which can adversely impact the performance of distributed applications. Everything from virtual private networks (VPNs) and content delivery networks (CDNs) to domain name system (DNS) servers and switches adds latency that, depending on how network traffic is being routed, can have a major impact on application performance. Any one of these services might be experiencing an outage or, more challenging to detect, intermittent degradations that unpredictably impact application performance. Whether it’s a software-as-a-service (SaaS) application being accessed in the cloud or an internet-of-things (IoT) platform running at the network edge, pinpointing which internet service might be the root cause of an issue requires the ability to closely monitor and observe that traffic.
Without any visibility into the internet stack, surfacing the insights needed in a way that provides the context required to optimize and troubleshoot a specific application becomes an impossible challenge. All the time and effort spent building an application can come to naught simply because no one understood the impact network latency would have on the application before it was deployed. Even after an application is deployed, any change to the way network traffic is being routed can have major consequences. Without any means of understanding what changes may have occurred, it might be weeks or months before an organization realizes it may need to log a service request or switch service providers.
Any truly comprehensive approach to observability clearly needs to include an analysis of the internet services upon which organizations crucially depend to ensure a consistent application experience is delivered and maintained. Depending on how the IT team is structured, those insights can be fed into an observability platform that the organization has adopted or correlated using an internet performance monitoring (IPM) platform.
DevOps Needs NetOps
Regardless of the approach, it’s never been more crucial for network operations (NetOps) and DevOps teams to be able to align their approaches to monitoring distributed computing environments. More latency-sensitive applications are being deployed than ever. In an ideal world, DevOps teams working closely with NetOps should be able to programmatically provision and alter networking services as needed. Not every internet service can be adjusted via an application programming interface (API), but most NetOps teams have access to consoles that enable them to upgrade to different service levels when needed. At the very least, a service provider will work with them to make any changes required.
Of course, it becomes more challenging to negotiate if the NetOps team doesn’t know which element of the Internet stack needs to be upgraded. A service provider that typically doesn’t have any visibility into the application might spend weeks trying to determine which element of the Internet stack they manage is at fault. IT teams that have their own means of monitoring a set of internet services are going to be able to work with their service providers to resolve those issues much faster.
Summary
Savvy IT teams are all too aware of how prone internet services are to outages and brownouts, so as a rule, they tend to make sure network traffic can be rerouted from one service to another. That approach also provides the added benefit of maintaining some pricing leverage as they negotiate fees for the services provided.
It’s also worth remembering providers of networking services that know a customer is locked in may not have as much incentive to make sure networking services are running at peak efficiency. The only way an IT team is ever going to know what level of service is being delivered at any given time is, of course, to generate an IPM report that precisely details what services were actually available at what level of performance. Otherwise, they are wholly dependent on the report a service provider presents alongside their monthly bill.
Just as critically, the reports generated by an IPM platform also surface insights that, when shown to application developers, create a potential opportunity to optimize their code. Without that level of analysis, every developer will assume the network services are either broken or poorly managed. The challenge and the opportunity now is to provide internet performance intelligence in a way that every stakeholder cannot just act on but, just as critically, implicitly trust.