Tag: nationwide

  • 9 Lessons Learned: Getting Value Stream Insights in Only 2 Days

    9 Lessons Learned: Getting Value Stream Insights in Only 2 Days

    Gene Kim, Jez Humble and other experts say that understanding and improving your value stream is really what it takes to bring your software delivery organization to the next level. While almost every IT organization has this goal, actually knowing how to make it happen can be paralyzing, because it seems like such a daunting undertaking when trying to connect all of your systems tools and processes.

    Recently, we participated in an innovative approach that proved that you can take concrete and measurable steps and see real outcomes in only two days.

    Nationwide constantly strives to innovate and bring real change to its IT organization. The insurance and financial services company has zeroed in on improving its value stream. To begin the initiative, Nationwide developed a two-day workshop where the right disciplines would come together and determine the best way to make this happen. But the real innovation in this idea was that the organizers did not just talk about what to do. Instead, the end goal was to come up with at least one key metric the team could show to the Nationwide CIO by the conclusion of the workshop. This approach made the effort real, concrete and focused. While it was difficult, it worked.

    Here are nine important lessons learned:

    Lesson 1: Start with one artifact—specifically, defects. Measuring cycle time is extremely difficult because there are so many moving parts. To have a tangible outcome, start with defects because they tend to be the most well-understood artifacts and have relatively defined workflows and processes that people know and understand.

    Lesson 2: Commit to having a real metric based on real data. All too often organizations take the “boil the ocean” approach. When asked what metric they want to start with, the answer is typically, “Everything.” That is precisely the wrong approach. Aiming for everything is likely to get you nothing. Focus on a tiny amount to start. First understand, then improve, your software delivery value stream. Not only should you start small, but for IT value streams, start specifically with a certain artifact (see Lesson 1). And chose only one metric for that artifact, because less is truly more in this case.

    Lesson 3: Without a multi-disciplinary approach, you will fail. This part is extremely difficult. To be successful you will need the following mix of skills:

    • Domain Expert: This person knows this part of the value stream inside and out. She is a practitioner in that area of IT and truly understands the who, what, when, where and why of that particular area of the value stream.
    • Process Analyst: This person knows how the various people, systems and resulting artifacts are intended to operate together for the complete process. Often this person is closely aligned with the domain expert, but typically is not one of the practitioners actually participating in the process.
    • Data Warehouse Specialists: These are the people responsible for populating and managing the data marts or data warehouses. They need to have significant data transformation capabilities and intimate knowledge of the required data structures and formats the organization requires.
    • Report Writers: As often happens with the expertise required to wrap up a process, this role is sometimes overlooked at the beginning. This is not the right approach. The person who will report on the project should be involved from the very start.

    Some people might start by asking, “Don’t we need a data scientist?” After all, that is a title of authority when it comes to metrics. If you have a data scientist on staff, by all means, get them involved. But if you don’t, you can rely on someone with database skills—primarily, skills around writing advanced SQL (as old fashioned as that may seem). Most of this work will not require advanced data scientist skills.

    But the real challenge is to get all of those disciplines in the same room at the same time. This is no easy feat. Leadership must provide the necessary resources to ensure that each one of the roles is represented. Because if any of these roles are left out, you will not succeed.

    Lesson 4: Work in parallel. The process and domain experts can work on identifying the artifacts that must be used and manually identifying and mapping where the artifact originates, what systems touch the artifact when, and all the requisite status changes and their meanings. That work will inform the data warehouse team and report writers, but the data and report writers are actually faced with a very different problem: They must determine how to get the data, regardless of the identified artifact, and transform the raw data into a usable format that report writers and BI analysts can work with in their visualization tools. By having both teams work in parallel, with identified checkpoints along the way, you will be more efficient when it comes to the three required deliverables.

    Lesson 5: There are always three required deliverables for each value stream cycle metric you are interested in.

    • The artifact(s) of interest (defect, story, requirement, code commit, etc.)
    • The following data:
      • All required status changes and dates of changes,
      • Data to relate artifacts to each other (for the joins)
      • Any ancillary information needed to be able to slice and dice the data for the final visualization.
    • The final visualization showing the metric (which is typically not one metric but rather a macro metric that has drill down capabilities and other perspectives on the metric).

    Lesson 6: Work both forward and backward. It is always easier to get started when you know where you want to end up. In this lesson, identifying the end goal is key. Once you have identified the “end” then you can go to the beginning and determine if the end goal is actually reachable. You also can identify any holes that exist between the beginning and your end goal. In this use case, the backward story looks like this:

    • End Goal: A visualization (graph/chart) showing the metric of interest. The idea is to mock up exactly what you want the end result to look like. Create the mock up in the actual BI tool you intend to use as if you already have all of the necessary data at your fingertips.
    • Step 4: Provide the data needed to create the visualization—it must be formatted in a way that will enable the report writers to easily and efficiently create the visualization that is your end goal. Hint: start by creating a spreadsheet that contains the exact data structure and formats desired. You will use fabricated data to start. The idea is to make sure the data is structured properly to reach the end goal (the visualization).
    • Step 3: Create the interim views and tables that will enable you to get to Step 4
    • Step 2: This step is where you collect the raw data from the actual systems involved
    • Step 1: (The Beginning) Identify the artifact and all of the systems that artifact flows through.

    Lesson 7: Invite outsiders to participate. It’s difficult to see the forest for the trees in your own organization. You need outsiders who are willing to ask the questions, probe in challenging areas, push the boundaries—people who have a different point of view because they are not in the game. This does not mean outsiders should be the workshop facilitators. They could be, but it is more important for them to actually participate in the sessions and help define and create the deliverables.

    Lesson 8: Hold the workshop in a different space than you work in every day. Don’t use the conference room that you typically use. Bring the team to a completely different environment—one that inspires creative thought and innovation. It may seem like a fluffy requirement, but you will learn through workshop participant feedback that location has a major impact when it comes to productivity and focus.

    Lesson 9: Get executive leadership buy-in. The executive VP was genuinely impressed with what the team accomplished in only two days. And the positive feedback and kudos the team received has probably fueled their innovation engines for months to come. To feel a sense of accomplishment and be recognized by the executives in your organization has significant morale impact.

    Improving your value stream is no small feat. But by designing and executing on a workshop like this, you will see benefits and clear wins immediately. By the end of our two days, we had a prototype of defect cycle time and a defined repeatable process. Equally as important, the people involved were given the opportunity to fail fast and pivot where needed, which inspired innovative thinking and creativity. And, being able to present to the CIO real progress with real results in two days’ time fueled institutional buy in and momentum to drive a long-term value stream improvement program.

    About the Author / Nicole Bryan

    Nicole Bryan is Vice President of Product Management at Tasktop Technologies. Nicole has extensive experience in software and product development, focused primarily on bringing data visualization and human considerations to the forefront of Application Lifecycle Management. Most recently, she served as director of product management at Borland Software/Micro Focus, where she was responsible for creating a new Agile development management tool. Prior to Borland, she was a director at the New York Stock Exchange (NYSE) Regulatory Division, where she managed some of the first Agile project teams at the NYSE, and VP of engineering at OneHarbor (purchased by National City Investments). Nicole holds a Master of Science in Computer Science from DePaul University. She is passionate about improving how software is created and delivered – making the experience enjoyable, fun and yes, even delightful.

  • InterConnect 2016: Culture Matters

    InterConnect 2016: Culture Matters

    The recent IBM InterConnect 2016 focused on plenty of tools and technologies, from cloud/SaaS solutions to containers and automation, but there was another popular topic of conversation heard in the halls—the culture of organizations. The basic premise of these conversations was that unless you get the culture right, all the technology in the world won’t get an organization to where it needs to be to compete in the ongoing digital transformation.

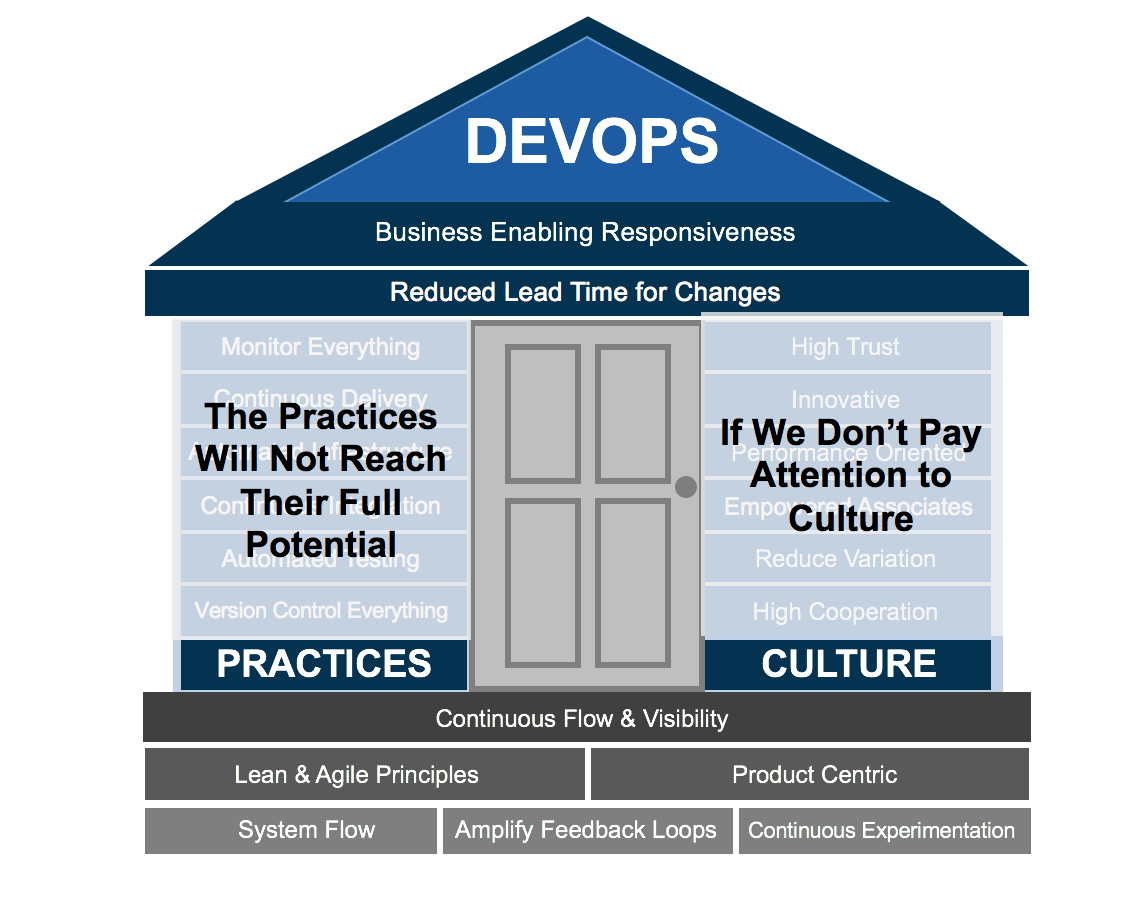
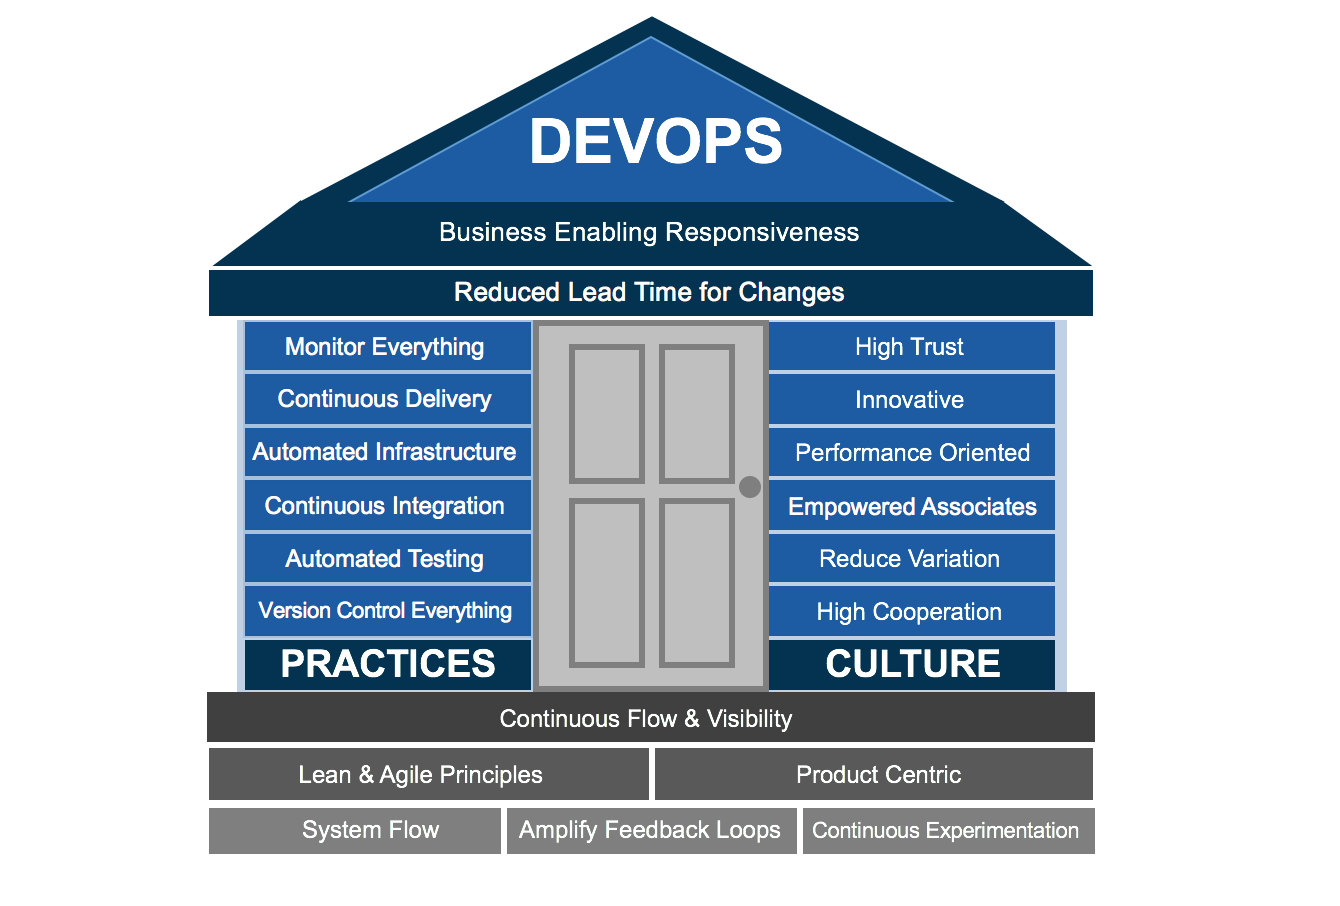
    At Nationwide, we have developed a foundational DevOps model that has two main pillars built on top of Gene Kim’s “The Three Ways” and lean and agile principles.

    While there are initiatives to implement the DevOps-related practices such as continuous integration using Jenkins, continuous delivery using TaskTop and UrbanCode and version control everything using GIT, how does one influence culture? Because clearly if the culture is not correct, technology solutions will not be enough to reach the goals of DevOps in terms of reducing lead time and enabling the business areas to be more responsive to market needs.

    Dev Cul 22

    Trust: The Foundation of Culture

    A key component of what underpins culture is trust. This was emphasized in a blog written by Lee Reid last year titled, “The Simple Math of DevOps.”

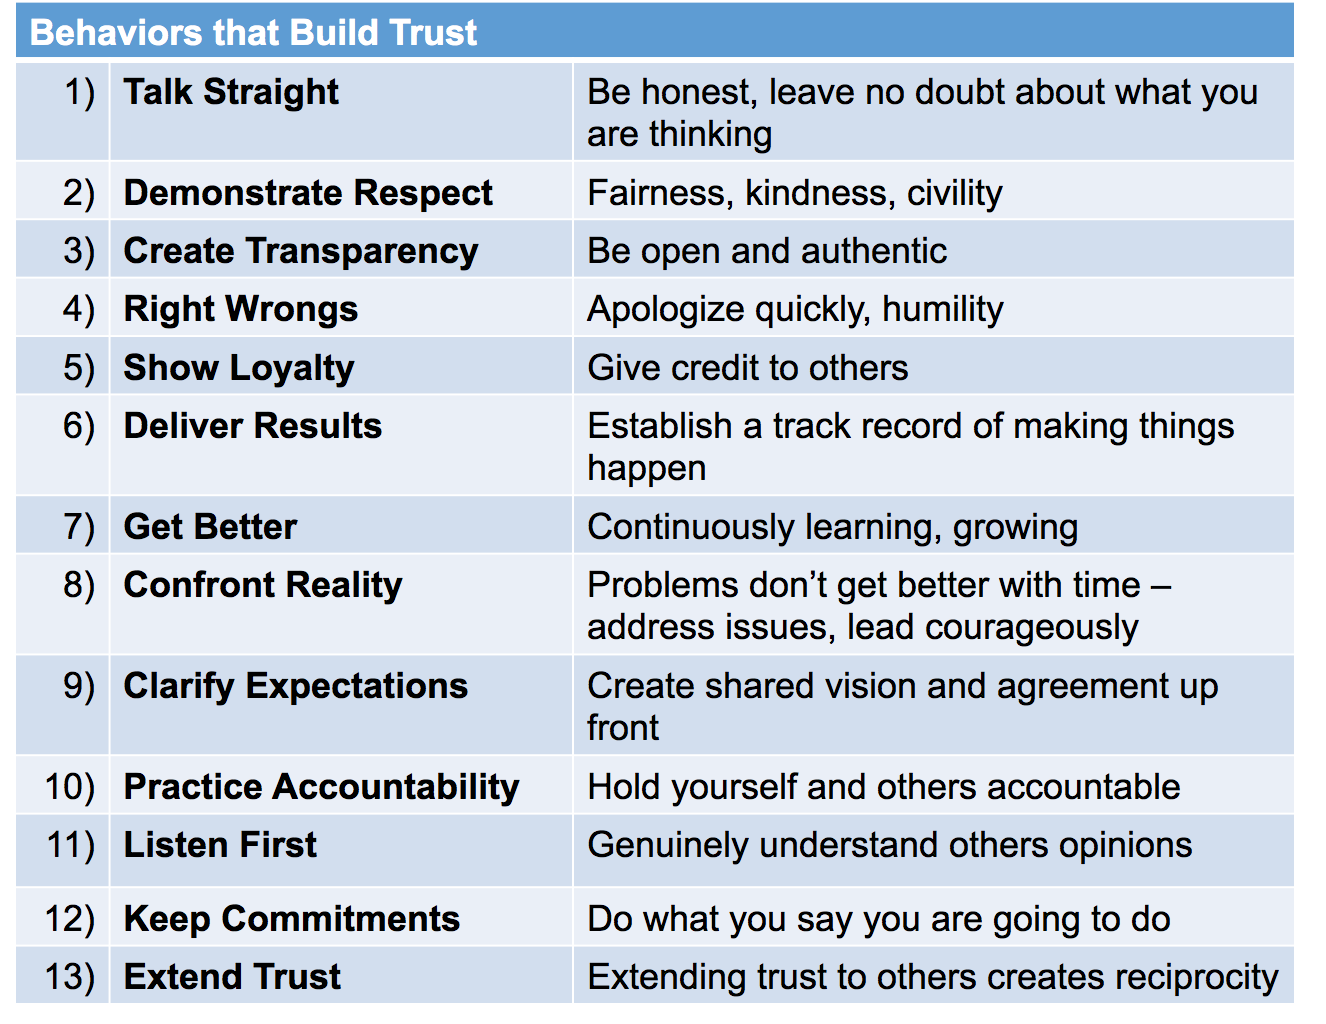
    So how does one build trust? Here are 13 behaviors that build trust from Steven Covey:

    Dev Cul 33

    Colin Powell, in a video on the Essence of Leadership, talks in a powerful way about this, saying that one way to build trust is to “Do what you say and say what you do.” He also stresses that successful leaders are those who provide selfless service to their teams.

    I don’t claim to have any magical formula to build trust, but clearly an organization’s transformational success must include a focus on culture and trust. Without this, the true promise of DevOps won’t be realized.

    You can read more about my session, “Achieving continuous visibility across the DevOps Lifecycle” at InterConnect 2016.

    About the Author| Carmen DeArdo

    Carmen-DeArdo-sq
    Carmen DeArdo is technology director at Nationwide Insurance. An ardent advocate of DevOps and a leading speaker in the DevOps and technology related events, Carmen is responsible for driving continuous delivery utilizing DevOps, lean and agile techniques across mobile, distributed and mainframe and other technologies.

  • The Calculus of DevOps

    The Calculus of DevOps

    This is the second in a series of blogs, partnering with Lee Reid, who wrote the first installment “The Simple Math of DevOps” and Sanjeev Sharma both of who are outstanding DevOps Thought Leaders from IBM.

    I am picking up on Lee’s mathematical DevOps model to apply a calculus perspective, a “calculus of DevOps” if you will, (OK, not quite core Big Bang Theory Calculus but rather approaching it from the aspects of engineering queuing theory).

    One of the cultural challenges that DevOps poses is, that some aspects of it run counter to engineering principles that many of us learned with respect to capacity and response time.   When I worked at Bell Labs, we would apply queuing theory to determine how to best package information to be sent across the network. A basic premise revolved around a tradeoff between throughput and response time. On one hand, the more messages that were packed into the packet, the more the payload would improve capacity because the overhead of processing the packet of information would be spread across the messages.   However, waiting to accumulate enough call processing information meant that the packets would be transmitted less frequently, increasing the response time.

    A simple example of this would be making trips to the grocery store. If one wanted to spend the least amount of resources (time, gas, car wear, etc.) on shopping, then one would make less frequent trips and then buy a larger amount of food. So if the Smith family made one trip a month and spent 2 hours, then their average time per week spent on shopping would be 30 minutes.   If the Jones family went every week and spent an hour, then they would be spending twice the time and four times the gas on grocery shopping. However if the Smith family run out of an item (say cereal), they would have to wait, on average 2 weeks before this was replenished. The Jones family average on any item that they ran out of would be 3.5 days in comparison.

    So when the 2014 DevOps report was published[1] which states that areas that deploy more frequently get customer feedback more quickly, that is to be expected. But what’s not expected is that these organizations also have higher productivity.   So exactly what is happening here that seems to be in a basic conflict to the principles of throughput and response time?

    Keeping up with the JONESES

    If we think of a pre- DevOps state for a medium to large enterprise, it may be typical for applications to only be released (deployed into production) a few times a year to provide business functionality. (I assume there are more frequent releases for “unplanned work” like defects and other changes or operational work). For the sake of this discussion, let’s call this the Smith Application. So from a business perspective, the business wants to pack as much work into the Smith releases as possible given they only have a few cracks a year at getting new business functionality into production.

    SMITH APPLICATION CHARACTERISTICS:

    • Deliver Business Value 3 times a year (every 4 months)
    • Cost is C1
    • Business Value (BV) delivered is V1
    • Average time from concept (e.g. Story) being ready to be pulled from the backlog to the time it is delivered to the customer is 2 months plus any additional wait times (e.g. prioritization)
    • BV delivered per year is 3*V1
    • Cost per year is 3*C1

    Now let’s transport over to the Jones Planet where the application is released into production with new business capabilities at the end of every 2 week iteration.   In this case the business is more concerned with providing a constant demand flow into IT than they are with debating over whether a given feature/story is going to be included in this particular release.   Instead there is a constant prioritization (or continuous planning) process that ensures the highest value work is being fed into the IT pipeline.

    JONES APPLICATION CHARACTERISTICS:

    • Deliver Business Value 26 times a year (every 2 weeks)
    • Cost is C2
    • BV delivered is V2
    • Average time from concept (e.g. Story) being ready to be pulled from the backlog to the time it is delivered to the customer is 1 week plus any additional wait times
    • BV delivered per year is 26*V2
    • Cost per year is 26*C2

    Based on the previous engineering analysis, we would expect the following:

    1. SMITH annual cost (3C1) < JONES Annual Cost (26C2)
    2. SMITH annual BV (3V1) > JONES annual BV (26V2)

    So the tradeoff (we would believe) JONES is making by delivering more frequently is that they are spending more money and are delivering less business value on an annual basis.

    However the data from the previously referenced DevOps report is just the opposite. In fact the findings are that enterprises that deploy smaller units of work more frequently have much higher quality and much higher productivity (Capacity). So what’s going on here?

    A NEW PARADIGM

    If you go up to any IT team (even an agile one) and ask them why they don’t deploy business value more frequently, they will generally refer to the following types of wait states of waste that they encounter:

    • Waiting for work (lack of consistent flow)
    • Waiting for somebody else to do something (dependencies from other teams)
    • Waiting for environments (contention)

    One major root cause of this is the dependencies that arise from large enterprises packing a lot of work into infrequent releases. From a planning perspective, the process is elongated due to prioritization discussions because being on the wrong side of the line can mean delay amounting to months, in delivering a product to a customer.   Ask a business portfolio leader what their highest priority is for IT and I am guessing they can tell you in a matter of seconds. However, most large organizations can spend several months a year planning their annual portfolio of work for IT. Some organizations spend more than 50% of their new project build time prior to a single story entering an agile development team’s backlog!

    From a development perspective, packing a lot of work into releases means many more dependencies that have to be managed across initiatives and impacted applications. From a testing perspective, downstream environments (ST, UAT) have to manage much more information in terms of application versions and especially test data that complicate and slow down the process. The complexity of test data increase is proportional to the number of pairwise relationships that exist within the datasets required for testing.   As such, the testing complexity will increase non-linearly (perhaps proportional to the square of the dependent systems) and from a release and change perspective; there is a lot of coordination necessary given how much is being changed at one time.

    All of this work to manage all of the dependencies found in medium to large enterprises completely eliminates any potential savings one might get from batching work into a single delivery. In addition, the possibility of having to pull some work out of a release (due to quality or business readiness or some other reason) sometimes leads to complicated source code management (feature branches in some cases) that further complicate the process of merging frequently into the trunk. These types of practices also serve to drive up technical debt. So looking at the problem from this angle shows why results we are seeing make perfect sense.

    Productivity is inversely proportional to the number of dependencies in a release

    As Lee related to in the initial blog, a lot of an organization’s success depends on trust. And one factor of trust is clarity which speaks to understanding the changes that each release is bringing to the IT and customer environments. So a factor that is working against trust is the notion of delivering more things less frequently and better controlling change somehow, is a good notion.

    Trust is inversely proportional to the number of dependencies in a release

    There is another hidden component of waste associated with “big bang” initiatives. Go back to our grocery example for a moment. Chances are that the Smith monthly excursion results in buying some stuff they end up not using. Perishable items are not spread out very well when they aren’t purchased more frequently. Likewise in IT planning, we tend to put a bunch of stuff in our IT Delivery basket that we don’t know for sure that we will need and we end up with a lot of wasted effort for features that are hardly used or not needed at all. Some enterprise estimates are that 50-65% of what they put into large releases does not actually result in true value to the business. Doing more frequent releases allows a constant discovery process to better guide the usage of IT resources on what is truly of value.

    Waste is proportional to the size of a release.  

    In other words:

    Yield (Value per IT investment) is proportional to the frequency of releases.

    REVISTING THE MATH OF DELIVERY TIME

    So if we revisit Lee’s model

    Lee Reid Blog equationand apply the “Calculus of Release” as we stated above, there are increased costs associated with having larger and less frequent releases in medium/large enterprises.

    • Planning cost TPLAN
    • Development complexity TDESIGN + TDEVELOP + TBUILD
    • Testing Complexity TTEST
    • Release and Change Management Complexity TRELEASE + TDEPLOY + TEVALUATE

    TRUST % – Even if everything was proportional between the JONES and SMITH models, the component of trust that impacts clarity, consistency and collaboration, is much lower for large (SMITH) releases.  Given that TRUST has a multiplicative impact, this alone can account for the results found in the studies.

    CULTURAL CHALLENGE

    While clearly one needs to be sensitive to the changes being introduced into the business, having the ability for the business stakeholders to pull capability when they want it and having it available more frequently is not only good for customers but also has extreme benefits from an IT perspective in terms of increased productivity and reduction of technical debt. The challenge is to convince leaders in both the business and IT areas on the merits of doing more continuous planning and frequent deliveries.   Unicorns may have led the way in this type of thinking but it is actually the horses that will benefit most from this type of culture shift because it is the horses[2] that have the most to gain in mitigating the dependency factor which can undermine quality, productivity and cycle times.

    Read more about the topic in the next blog of this series The Art of DevOps by Sanjeev Sharma.

    [1] “2014 State of DevOps Reports”, Puppet Labs, IT Revolution, https://puppetlabs.com/sites/default/files/2014-state-of-devops-report.pdf

    [2] “The Phoenix Project”, Gene Kim, Kevin Behr, George Spafford, http://www.amazon.com/The-Phoenix-Project-Helping-Business/dp/0988262592


    About the Author

    CarmenCarmen DeArdo is the Director of Application Development Tools and Technologies at Nationwide Insurance. Carmen is responsible for driving continuous delivery utilizing DevOps, Lean and Agile techniques across Mobile, Distributed and Mainframe and other technologies. This includes recommendations and implementation of technologies used across the development life cycle (e.g. IBM Rational tool suite, open source technologies).

  • What lane do you travel on the DevOps highway?

    What lane do you travel on the DevOps highway?

    Last week we kicked off our webinar series on Variable Speed DevOps. The discussion was lively and informative. For myself as moderator the webcast was as comfortable as an old pair of slippers. Two of the three panelists, Carme DeArdo of Nationwide and Sanjeev Sharma of IBM are both friends and people I have had the pleasure of appearing with before.  Additionally, Lee Reid, fit right into the discussion, not missing a beat.  You can listen to the recording or view the slides here.

    We discussed Variable Speed IT from many different aspects and how Nationwide has successfully merged onto the DevOps highway.  More than any of the other analogies we spoke about or I have heard, I really like the DevOps highway as a good way to explain Variable Speed IT and Variable Speed DevOps. The notion of multiple lanes with traffic moving at different rates in each lane is a good way to think about Variable Speed IT.

    Of course if only things were that easy. In the variable speed DevOps world the traffic in each lane is directly connected to the traffic in the other lanes.  This is where the expertise of Carmen and the rest of the panel comes into play.  In an organization such as Nationwide (see the first two slides of the deck to get an idea of Nationwide’s scope) coordinating Systems of Records with Systems of Engagements, multiple dev and ops teams and doing it all successfully is orchestration worthy of a maestro.

    Lee and Sanjeev in their positions at IBM have had the chance to work with several organizations like Nationwide so can take lessons learned across an even wider spectrum of experiences.

    All of this added up to a great webinar that I was lucky to be part of in some small way.

    Our deep dive into Variable Speed DevOps continues on May 19th with the Canada Mortgage Housing Corporation explaining how they were able to break down IT silos and in both their mainframe environments (yes even mainframes) and others. You can find out more about this one and register here: https://devopsy.kinsta.cloud/blogs/variable-speed-ibm2/?S_Tact=C34701GW.

    Variable Speed DevOps, 2-Speed IT, Bi-Modal IT – we are seeing lots of different terms to describe a common fact pattern.  We think this series of webinars will explore many of the facets of this subject.

    In them meantime we are off to a fantastic start with our first in this series. I really encourage you to go have a listen.  Many thanks to Carmen DeArdo, Sanjeev Sharma and Lee Reid for kicking us off with a great webinar.

  • Webinar:  How Nationwide Insurance is Adopting DevOps for Variable Speed IT Systems

    Webinar: How Nationwide Insurance is Adopting DevOps for Variable Speed IT Systems

    To drive towards faster innovation, and also ensure the stability of the core business, the need arises for what is being termed as “two-speed or variable speed IT.” While innovative Systems of Engagement demand speed, agility and experimentation, legacy Systems of Record need governance and predictability. Two-speed IT enables adoption of DevOps capabilities by adapting them to the “speed” of delivery. It requires two-speed business planning and processes and even two-speed organizational structure and budgeting. Join Carmen DeArdo, Director of Application Development at Nationwide Insurance, Sanjeev Sharma, lead DevOps Technical Evangelist at IBM, and Lee Reid, executive IT specialist as they show how IBM’s solution is helping Nationwide adopt DevOps practices for variable speed IT systems.

    This webinar is the first in the Variable Speed DevOps – A Deep Dive series.

    Event recorded Tuesday May 5th, 2015

    SLIDES

    [seoslides embed_id=”be17733a1254″ script_src=”https://devopsy.kinsta.cloud/embed-script/webinar-how-nationwide-insurance-is-adopting-devops-for-variable-speed-it-systems/6643/” overview_src=”https://devopsy.kinsta.cloud/slides/webinar-how-nationwide-insurance-is-adopting-devops-for-variable-speed-it-systems/” site_src=”https://devopsy.kinsta.cloud” site_title=”devopsy.kinsta.cloud” title=”Webinar: How Nationwide Insurance is Adopting DevOps for Variable-Speed IT Systems” /]

    VIDEO


    Your Host:

    alan_new_head_shot Alan Shimel, Editor-in-Chief devopsy.kinsta.cloud, An often-cited personality in the security and technology community and a sought-after speaker at industry and government events, Alan has helped build several successful technology companies by combining a strong business background with a deep knowledge of technology.


    About Panelists:


     Carmen-Deangelo-300x225Carmen DeArdo, Nationwide – Director – Tools and Technology Leader

    Carmen DeArdo, Director – Tools and Technology Leader, Nationwide Insurance, An ardent advocate of DevOps and a leading speaker in the DevOps and technology related events, Carmen is responsible for driving continuous delivery utilizing DevOps, Lean and Agile techniques across Mobile, Distributed and Mainframe and other technologies.  


    Sanjeev Sharsanjeev-sharmama, IBM Worldwide Lead – DevOps Technical
    Sales and Adoption, IBM Cloud Unit

    Sanjeev Sharma, IBM Worldwide Lead – DevOps Technical Sales and Adoption, IBM Cloud Unit, is a 20-year veteran of the software industry with expertise in DevOps, Mobile Development and UX, Lean and Agile Transformation, Application Lifecycle Management and Software Supply Chains. He is a DevOps Thought Leader at IBM and speaks regularly at conferences. He has written several papers and is the author of the DevOps for Dummies book.


    leeLee Reid, IBM – Senior IT Specialist

    Lee Reid, Senior IT Specialist, IBM, is a senior solution architect with focus on practical adoption of software engineering tools, software delivery solutions, application life cycle management, and DevOps. He has over 25 years of experience in software engineering, design, programming, testing, development, tools & methodology, team leadership, and strategic planning.

  • Q and A with Carmen DeArdo: DevOps at Nationwide

    Q and A with Carmen DeArdo: DevOps at Nationwide

    Just before the IBM Interconnect show in Las Vegas last week, we had a chance to speak with Nationwide’s Carmen DeArdo and talk about some of the challenges he has faced at Nationwide as DeArdo and his team work to bring DevOps and Agile principles to their delivery value stream.

    DeArdo is no stranger here at devopsy.kinsta.cloud, and recently shared his column Nationwide banks on DevOps to drive towards Continuous Delivery. At Nationwide, DeArdo is the director of application development tools and technologies. DeArdo is responsible for driving continuous delivery utilizing DevOps, Lean and Agile techniques across mobile, distributed, mainframe and other technologies.

    Here, we interview DeArdo on the importance of transparency into DevOps processes and the importance of attaining efficiencies throughout the delivery value stream.

    devopsy.kinsta.cloud: Talk to us about how, as you optimized certain aspects of your delivery value stream, you found wait states in other areas of the chain created delivery backlogs?

    DeArdo: If you actually look at the entire delivery value stream, we started out optimizing the middle because we started with Agile design, development and acceptance testing. We gained a lot of benefit out of that. If you take a step back and think about your entire delivery stream, and your continuous delivery efforts, what you realize is that on the upfront process you end up with wait states and lack of visibility flow at that end.

    What is happing is that as your teams get better, they actually run out of things to do. There’s nothing for them to pull forward anymore.

    Then, on the downstream side of delivery, you still have the issues through your path to production – especially if you have managed test environments. You still have manual processes, manual testing steps in deployment. Even if you’ve automated some of them, you still have manual processes. And you end up moving at the speed of the lowest common denominator. What you find is that you’re going to get diminishing returns now unless you start to address those wait states or contention points on either side of design, develop, and test.

    These inefficiencies, on the planning side, start to bleed back into the business. Many times your business areas still have a fixed mindset in terms of their budget and yearly cycles. They’re not used to determining how to continuously feed high priority work into the backlog of your Agile teams. And then on the other side of the pipeline, how can you take what’s being produced by these teams and move that more quickly into your path to deployment?


    devopsy.kinsta.cloud: That’s interesting. Your challenge is taking your continuous deployment and continuous improvement mindset and then feathering that into the annual and quarterly planning mindset of the business?

    DeArdo: On one side, what you’d like to have is more of a continuous planning, continuous flow so you’re not dumping a lot of stuff in a bursty way onto your teams. They’re going from wait state to being overburdened. You don’t have that continuous flow. And then on the downstream side, how do you start to automate some of the things and get rid of some of those manual practices? We’re very good at deploying to our continuous integration and deployment to our dev environments.

    But then beyond that, things tend to get bogged down. We sort of go slow at the beginning and slow at the end and go very fast in the middle. Well, if you’re going to improve your overall speed, you need to look at those beginning and end spots and say, “How can I try to address those?”


    devopsy.kinsta.cloud: To improve throughput throughout, it sounds like you need more feedback, more planning throughout the year with the business.

    DeArdo: There are a couple of things we need to do, and part of it is around driving more towards continuous planning. The other side is about of having an automated deployment capability. Giving the business more capability, it goes faster if it makes sense from a risk and value capability perspective.

    We’re actually focusing more on that latter part right now. We are building this automated delivery pipeline, which starts with release planning and then goes all the way through deployment.


    devopsy.kinsta.cloud: What are some of the high-level challenges that you’ve had optimizing that last mile phase?

    DeArdo: I think one of the biggest challenges, although people like to talk about tools, is is around the variance in your own processes. If you have too much variance in your own process, then you don’t want to instantiate that into a tool because all you’re taking is a bad current state and making it a permanent current state.

    So we have meetings with vendors. The last one we had, we’re pretty far along this path, but the last one we had, we probably spent 90% of the time just talking about the variance in our own process and the fact that it’s not one-size-fits-all, but you have to have a small number of patterns that you’re trying to instantiate and implement. You have to be able to tell the difference between business value-added variance and waste variance.

    I sometimes quote “The Wizard of Oz.” It’s like are you a good witch or a bad witch? Are you good variance or are you bad variance? Everybody wants to think what they’re doing differently has value, but in reality, most of it is arbitrary. There might have been a good reason for it at one point, but at this point, there is no value add in having that variance.

    One of the variances we have is our path to production: what environments, what phases and things like that. One pattern might be an urgent need to get a business capability out very quickly. So I have a certain environment, a certain way to get certification in an expedited way. It’s not about going through an environment. It’s about proving that you have the quality that you need to deploy.

    That one pattern might have a lot of automated testings run in one environment that you can get to very quickly to certify the quality and then release it. Another pattern might be around a record keeping system which is managing financials. You just have things that you have to go through. The system will have dependencies. So you’re going to go through a more elongated path to production.

    That’s just an example of two patterns you would use based on a technology and a business need, not just because I’m in Organization A versus Organization B or Organization C. I don’t care what organization you are, if it fits this pattern and this technology, if it fits this pattern, use that and then if it fits this other one, use that. Those are good variances based on the fact that there’s a business need. There’s a technology driver that defines how you’re going to deploy.


    devopsy.kinsta.cloud: That is an excellent explanation. I think many people get caught up in their “one right way” of doing things and have a tough time looking objectively at alternative ways.

    Let’s talk about your “hidden factory” metaphor. Is the “hidden factory” a metaphor for a lack of transparency into different areas of IT?

    DeArdo: Right, and the fact that you really don’t have a model. You have views. One of the things I point out is that you have a business development view, you have a project planning view, and you have release metrics, project metrics, and you have a release view. You have a path to production. None of that is visible. Some of it is hard to find. Some of it is visible if you’re in the tool of choice. But there is no visibility and no linkage or integration of that as you move from putting in your business needs at one end and seeing the code moving into production at the other end.

    DevOps is about shining the lights on that. My view is you can’t manage what you can’t see. Another example sometimes I use is a basketball coach. Let’s assume you’re a basketball coach but you’re not allowed to watch the games. What you get after every game is a score sheet. It has the score. It has maybe your shooting percentage and turnovers, assists, but that’s it. Now you have to practice for the next game to work on improving something. Well, how do you know what to improve? So let’s say your shooting percentage was low, assuming you have enough metrics to know what low is.

    Maybe your shooting percentage is bad. Maybe you think, “I’m just going to practice shooting.” Well, maybe that’s not it. Maybe the wrong people took the shots. Maybe you took contested shots, bad shots. There are a number of reasons you can have a bad shooting percentage, none of which have to do with the fact that you have bad shooters.

    But that’s sort of the way we manage IT today. We’re asking executives to manage things they can’t see based on a set of metrics, but they don’t really watch the game.