Tag: mttr

  • MTTR: The Magic Metric

    MTTR: The Magic Metric

    How do you improve with one metric quality, cost, performance, employee and, most importantly, customer satisfaction?  I think MTTR is one to consider, but with a DevOps twist (agile+lean+ITSM). The thing I love about DevOps is that it allows for people to think differently. DevOps is the movement driving organizations to find new ways of collaborating, communicating, cooperating and improving the way they use technology to create and support services.

    While many agree that MTT stands for “Mean Time To,” there is no common agreement on the R.  I like using 5 Rs, as they cover the life cycle of idea to realization (in the hands of the customers in a way they like).

    So what are the 5 Rs? Well, let’s work backward (shift-left thinking):

    • Review: What happened? How can we stop this in the future? How can we shorten the cycle?
    • Return: Do customers agree that all is well? How satisfied are they with not only our performance but the fact the event occurred?
    • Restore: The time and effort to get servers, network, applications, data, passwords back as they should be.
    • Repair: The time and effort to resolve the issue.
    • Respond: The time to notice, decide if we can fix or get others involved, and their reactions to begin getting things sorted.

    MTTR is a cycle of events. Breaking them down and understanding the value of each step enables you to reduce time, effort, waste and cost. How often do things break and why? Are they self-inflicted because we test poorly? How can you apply automation or self-healing? How good is your monitoring and alerting and response mechanisms? How great is your documentation? Do you rely on a certain person to fix things or can anyone? Knowing the answers to these questions can make issues become less frequent—or, at least, reduce the effort to address them when they do occur, as things will break.

    Knowing these answers also helps clarify priority of issues. Working back from the customer drives the flow of work to highlight faults. Why treat all issues as P1 all month? For example, payroll is only a P1 when you are getting paid, but the rest of the month it can be a P2. Working with customers will help ensure you are fixing the important things, not something someone wrote in a service level agreement that is rarely updated.

    MTTR is also a fabulous learning measure. DevOps is all about collaboration and that begins when people talk to each other, repair things or introduce a better test or monitor or alert to capture issues and customers are minimally impacted. Let your service desk own MTTR and see how issues get resolved better, faster and more safely.

    MTTR helps drive movement to virtual or cloud. MTTR can also help you improve your A/B use of infrastructure or services.  Have an issue? We’ll flip a switch.

    But the overall goal of any metric is to drive actions, decisions and improvement. MTTR is such a measure. Be brave, throw away your SLAs, get people involved for issues and use MTTR to make things better across the life cycle. Then celebrate the success of your journey!

    Let us know. Do you use MTTR? Can you measure each step and perform a retrospective?

    About the Author / Daniel Breston

    dDaniel Breston is the Chief of DevOps Transformation for Ranger4. Daniel has 30+years leading IT Service, Operations, Applications, Data Center and service partners in management of technology enabling business processes and functions. He has also spent 15 years of consulting and coaching leadership teams across the EU and UK in developing their people, processes and use of technology to deliver technology services better, faster, safer. Daniel has qualifications in IT Service Management (ITIL, COBIT,etc.), Lean and DevOPS.

  • The DevOps Scorecard

    The DevOps Scorecard

    Mid-last year our team switched from doing Agile to doing DevOps. As we forayed into the journey trying to learn about DevOps and practice it at the same time,  a lot of questions arose in the team.  How was this different from agile and most importantly How were we going to be successful?

    That’s when we wrote down what would be the success criteria for our team: “Ship code frequently without causing a customer outage“.

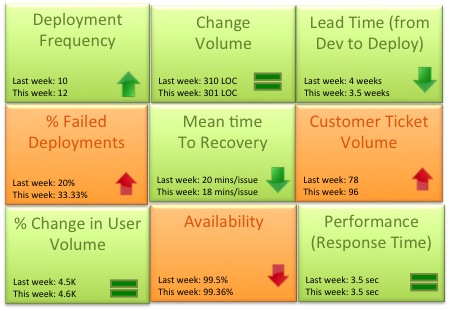
    As the team matured we started evaluating a more granular way to track success.  Could the team mantra be broken down into quantifiable success metrics that could be represented in a scorecard? Based on our experience the DevOps scorecard should contain these 9 metrics to track DevOps team success:

    DevOps Scorecrd

    1. Deployment frequency: How often were we deploying code and getting new code in the hands of our customers? This metric should trend up or remain stable from week to week. Example: Twice a week, 50 times a day
    2. Change volume: For each deployment how many user stories and new lines of code were we shipping?  Example: 3 new features per day, Average 500 lines of new code per week. Another parameter to consider in addition to volume is complexity of change.
    3. Lead Time (from Dev to Deploy): How long does it take on an average to get the code from development complete through a cycle of A/B testing to 100% deploy and upgrade on production? Lead time should reduce as the team gets a better hold of the lifecycle.
    4. Percentage of failed deployments: What percentage of deployments failed causing an outage or a negative user reaction? This metric should decrease over time. Example: 9% deployments failed this month as opposed to 15% last month. This metric should be reviewed in combination with the change volume. If the change volume is low or remained the same but the percent of failed deployments increased, then there maybe a disfunction somewhere.
    5. Mean time to recovery: When we did fail, how long did it take us to recover? This is a true indicator of how good we are getting with handling change and this should ideally reduce over time.  You can expect some spikes in this number due to complex issues not encountered before. Example: On an average it took the team 15 minutes to resolve each last week, 14 minutes this week.
    6. Customer Ticket Volume: Number of alerts generated by customers to indicate issues in the service. This is a basic indicator of customer satisfaction. Example: 54 tickets were generated this week as opposed to 38 while the user volume remained steady is not a good thing
    7. % Change in User Volume: Number of new users signing up, interacting with my service and generating traffic. As new users sign up is my infrastructure able to handle the demand? Example: This week the number of customers spiked by 30% due to an external event causing volume of requests to go up
    8. Availability: What is the overall uptime for my service and did I violate any SLAs? Example: 99.9% uptime consistently for the last 3 months even with change in user volume
    9. Performance (Response Time): Is my service performing within my predetermined thresholds? This metric should remain stable irrespective of % change in user volume or any new deployment. Example: Sub 5 second response time from all geographies and devices

    Would love to hear thoughts on what other critical metrics DevOps teams are using

  • DevOps storytime: MTTR vs. Goodheart’s Law

    DevOps storytime: MTTR vs. Goodheart’s Law

    I am not a fan of metrics. Wait. That’s not right. Let me try again. I am not a fan of singular metrics that stand by themselves. Nope. That’s still not right. I loathe singular metrics that stand by themselves as if they themselves are solutions to problems. Ok. That works. Let me explain.

    Last week, I told a tale of a secret passageway into DevOps called Mean Time To Resolution (MTTR) and explained how the introduction of this one tiny metric can magically open the door to all things DevOps. Given that MTTR and cycle time are inextricably linked, any shop that is serious about MTTR will sooner or later find itself using DevOps practices.

    Metrics + Crafty Humans = Doom

    This is very different than two weeks ago when I told a different tale. A tale of how the very origins and roots of DevOps gives the DevOps movement an opportunity to do what ITIL could not; Change the relationship between business and IT. In the telling of this tale, rife with philosophical terms like reductionism and formalism, I quoted a brilliant English economist, Charles Goodheart, who noted that “when a measure becomes a target, it ceases to be a good measure”. Goodheart discovered that “any observed statistical regularity will tend to collapse once pressure is placed upon it for control purposes.” The layman’s explanation is that humans are crafty little buggers and will find ways to artificially hit any target because the quantitative systems can always be rigged.

    So what is a DevOps voyager to do? Introduce the metric, get the change, and then proceed to watch devops die a slow death? No, my fellow DevOps devotees, that shall not be our fate. We can avoid this fate by knowing that halfway down the path of the secret passageway known as MTTR, there is a fork!

    More Metrics to the Rescue!

    Instead of introducing and presenting a flat and un-nuanced view of MTTR by itself, we can get a little crafty ourselves and find an appropriate hedge against Goodheart’s lay and instead present a weighted view of MTTR with a few other key metrics to allow for a more sophisticated view of the health of the IT factory floor.

    Apply Weighted Averages – Weight the MTTR of defects and their associated resolutions by priority to intentionally skew the measurement towards the highest priority defects. Clinging to an absolute view of defect free software doesn’t work for a large code base with limited funding and time (aside from being scientifically impossible to achieve via godels proof)

    Track Inbound Defect Counts – Track and present the inbound defect count, keeping the inbound defect count low is important, but pushing it to zero is more likely to be indicative of a shop that is more concerned with perfection than throughput

    Track Outbound Defect Counts – Track and present the defect close count. keeping a negative inbound-outbound differential is a sign of a shop that is arcing in the right direction. Several weeks or months of positive differential is a warning sign that a quality mindset is slipping into dangerous territory.

    Track Backlog Defect Counts – Track and present the count of defects in the backlog. A backlog of zero can be incredibly hard to maintain in a large enterprise with a large code base. In my experience 20 and 50 have been ominous numbers. Any more than 20 defects in an application and the backlog starts to become a fearsome beast that can only be tamed by stopping the factory. Any more than 50 and the incremental additions of any new defect seem trivial.

    Track The Age Defects – Tracking the average age of defects in the backlog is critical for any presentation of MTTR. A spike in MTTR can actually be a good thing if it represents a wave of old defects being cleared from the back of the backlog.

    Resist The Urge to Simplify

    A five part metric begs the question of an balanced score card approach with a grading formula and despite my belief in the value of this tactic for availability and performance dashboards, I advise you to strongly resist the temptation to apply it here (otherwise, we are right back where we started with Goodheart’s Law. Damn you crafty humans!).

    If you decide to bring the magical metric of MTTR into your shop, this type of reporting may be one area where starting small is quite possibly worse than doing nothing. Without the nuanced view, true visibility into the health of the shop isn’t possible. Worse than that, a flat view of just MTTR has the potential to mask real problems and raise false ones.

    Screen Shot 2014-04-28 at 12.44.25 AM

    When you pull all of the metrics together in a single view, like in the above graphic, the real message becomes clear. The health of the factory floor isn’t tied up in a neat little bow by a single number. It isn’t even made perfectly clear by three, four or five numbers. The real health becomes clear in the trend. Is your shop doing better week over week? Month over month? Getting better every day is the name of the game, and MTTR (with a few other metrics) can be a lever that moves your IT world.

  • DevOps storytime: The tale of the secret passageway named MTTR

    DevOps storytime: The tale of the secret passageway named MTTR

    When DevOps practitioners and evangelists talk about adoption, they mostly fall into one of two camps. People who talk about driving devops adoption by helping people understand the core ethical reasons of improving the world for those who work in it (I’m usually in this camp with Gene Kim).

    Others talk about driving DevOps adoption by helping people understand the monetarily valuable things that come out of DevOps like improved user engagement and conversion via better performance, more resilient operations via adaptive architectures, or an increase in IT throughput delivered by a use of automation technologies. There is, however, a third way to drive adoption; rather than introduce devops directly, introduce mean time to resolve (MTTR).

    MTTR is an Industrial Age metric that measures the time from a problem arises to the time it solved. It just so happens that shops that make a nuanced version of MTTR a very visible metric and seek to drive it down, have no other choice but to adopt DevOps methods because DevOps methods and beliefs are more and more required to push MTTR closer and closer to zero.

    A Story We Are All Too Familiar With

    Let me tell you a story of Alice, Bill and Carl. Alice and Bill work for Carl inside an IT shop where nothing of DevOps is known or practiced. All is manual in the land of Alice and Bill and the tyranny of work in progress keeps productivity and throughput capped.

    One day, when Carl asks Alice and Bill to get the cost of system defects and outages under control. Alice and Bill both start to research the methods for managing defects. Bill, the more linearly aligned of the two people chooses to focus on prevention of defects and starts to introduce checkpoints and controls for how changes get made with the aim of preventing defects from being introduced.

    The Plot Thickens

    Alice on the other hand thinks a little differently than most. Alice believes the answer for reducing costs related to defects is by reducing the impact of each defect introduced. In her mind, she sees the only way to reduce defect counts to zero is to either add more and more gates, barriers and checkpoints thus providing additional layers of certainty, or to stop all change completely. Neither of these options smells right to Alice and she decides the first step for her is to start measuring the costs of the outages.

    In her efforts to measure the costs, Alice discovers and then introduces a metric that neither Bill and Carl have seen before called MTTR. Alice explains to Bill and Carl that she doesn’t believe that speed and quality are naturally opposed to each other, but rather that the game to be played is how to be both fast and good. After Carl hears from both Bill, who wants to limit the number of defects introduced, and Alice who wants to limit the impact of each defect,  he understands the logic of Alice’s approach, but that it’s just plain crazy to not try to reduce the number of defects. Carl instructs the team to go after both objectives, and limit the number of defects and reduce the impact of each one by measuring and driving down MTTR. When leaving the room Carl like every other executive says, “Remember that you can’t add any new headcount, we have to get costs down, not move them up!”

    As Alice and Bill work together to establish the metric and reduce the number of defects, a funny thing happens. Both Alice and Bill see that automation of deployment tasks will positively impact both of their goals without requiring any additional headcount. Alice gets to reduce lead time on applying fixes while Bill gets to decrease the likelihood of errors as the automation scripts improve. While working through the deployment automation, it becomes clear that the exact same effect happens when the QA process is automated. Even funnier, when the previously manual processes are automated, peoples’ attention begins to free up to accelerate the pace of automating manual processes.

    Again and again and again it happens, first in automation moving backwards through the development lifecycle and then in instrumentation to both lower the time to notice that a defect has occurred and also to catch a defect earlier in the lifecycle before it gets deployed. Defects and outages go down, speed and throughput go up and what before Alice and Bill can say “Bob’s your uncle”, their teams are doing everything they can to speed up the automation processes themselves to drive cycle time even lower. What a wonderful coincidence! Performance engineering has now become something that the teams now actively engage in.

    The Moral of the Story

    Did Alice, Bill and Carl live happily ever after again? Time will tell and they are more certain to get better results out of their teams given that they have visibility into, and are grounded by, a metric that  puts how you respond to an error as more important than error prevention. Next week, I’ll go under the hood yet again and give a little more insight into how to create a robust, mature and almost qualitative view of my favorite metric: MTTR.