Tag: microservices

  • JFrog Delivers on Hybrid Cloud Promise for DevOps

    JFrog Delivers on Hybrid Cloud Promise for DevOps

    JFrog announced the availability of what it claims to be the first available hybrid DevOps platform capable of spanning multiple clouds.

    Dror Bereznitsky, chief product officer for JFrog, said the JFrog Platform integrates a range of DevOps tools within the context of the continuous integration/continuous deployment (CI/CD) platform that the company previously developed, with the goal of making it possible to continuously release software originating from any source on to any platform.

    Announced late last year, the JFrog Platform also provides DevOps teams with the first universal package manager with JFrog Artifactory along with support for both REST application programming interfaces (APIs) and a command line interface (CLI), he said.

    In addition, the JFrog Platform provides a common integrated user interface to access all capabilities and has been integrated with JFrog Pipelines for CI/CD, which is based on code JFrog gained via its acquisition of Shippable last year. The JFrog platform also enables DevOps teams to now also deploy applications on Kubernetes clusters.

    Finally, because the platform is managed by JFrog, DevOps teams can count on high availability and cybersecurity updates that are automatically delivered, said Bereznitsky.

    Bereznitsky said thanks to the rise of microservices based on containers and other cloud-native technologies, organizations are reaching a tipping point in terms of the amount of complexity their existing DevOps platforms can absorb. As such, many organizations that have already adopted a DevOps platform will be re-evaluating them. JFrog is betting that rather than spending more time on managing their underlying DevOps platform, more organizations will prefer to divert more resources to application development.

    It’s too early to say precisely how application development will evolve going forward. There is certainly an opportunity to centralize DevOps processes in a way that will make organizations more efficient. Most organizations today employ multiple platforms for building and deploying applications that often conspire to increase total costs unnecessarily. The challenge those organizations will face is overcoming the cultural issues it is likely to create within their organization.

    In the meantime, JFrog rivals clearly see the same opportunity. The race to become a de facto standard for building and deploying a new generation of highly portable applications is now on, at a time when many of the providers of DevOps tools are starting to consolidate. At the same time, the number of applications that will be deployed across an extended enterprise that now spans everything from public clouds to edge computing platforms soon will dramatically increase. As the volume of applications increases, the level of friction associated with building and deploying applications will ultimately determine the DevOps platform any organization is going to be inclined to standardize on.

    — Mike Vizard

  • Instana Expands Scope of APM Ambitions

    Instana Expands Scope of APM Ambitions

    Instana has launched a series of additions to its application performance management (APM) platform that reach into the realm of IT infrastructure as well as mobile and Java applications.

    Chris Farrell, technical director and APM strategist for Instana, said the company is adding support for VMware vSphere because more customers are converging their management of applications and IT infrastructure, thanks in part to the rise of DevOps practices. Many IT organizations are also simultaneously embracing emerging platforms such as Kubernetes to run microservices-based applications on top of VMware vSphere, he noted.

    Instana also recently added support for the Container Runtime Interface based on the Open Container Initiative specification, otherwise known as CRI-O, alongside existing support for Docker containers.

    At the same time, usage of Instana, which was created to focus mainly on emerging microservices-based applications, is expanding to include monolithic applications. As a result, Instana has added a free AutoProfile feature for Java applications based on tools it gained by acquiring StackImpact.

    Available in beta, AutoProfile attaches itself to the running process automatically with no restarts or reconfiguration required, to surface how specific pieces of code and associated bottleneck impact overall performance.

    Finally, Instana has also made available in beta an End User Monitoring of Mobile Applications module. That capability is also being made available at no additional charge. Troubleshooting mobile applications should become easier because Instana captures every single request made at the client by both the browser and the application.

    While adoption of APM platforms relative to the size of the IT market remains slight, Instana as a startup has been gaining traction at the expense of incumbent rivals. Instana claims it is now monitoring more than a half a million container and program run-time processes via its software-as-a-service (SaaS) platform, including hosts, containers, Java Virtual Machines, NodeJS runtimes and AWS Lambda functions written in PHP or Ruby. In total, Instana claims to also be gathering 1.5 billion metrics per minute, with more than a million application request traces being captured every second. New customers acquired in 2019 include Vivy, MacMillan Learning, TIpico, ExaVault and Avoris. Overall, Instana reports that its base of customers grew 150% in the last year.

    The Instana APM platform is designed from the ground up to automate application monitoring, including application discovery and mapping, monitoring sensor and agent deployment, and application infrastructure health monitoring. Instana is betting that the rise of microservices will not only require more organizations to rely on an APM platform to manage an increasingly complex application environment in real-time but also force many organizations that have APM platforms to reconsider their options when they discover how limited the visibility into containerized applications those platforms provide. At the same time, by adding support for VMware vSphere and making additional capabilities available for free, Instana is ratcheting up the pressure on rivals in 2020 further.

    Of course, it’s not clear there is anything approaching general dissatisfaction with existing APM platforms, so Instana may have its work cut out. Nevertheless, competition among providers of APM platforms has never been fiercer.

    — Mike Vizard

  • Six Routing Challenges When Managing Microservices in Production and How to Avoid Them

    Six Routing Challenges When Managing Microservices in Production and How to Avoid Them

    Even experienced DevOps teams can struggle with the nuances of managing microservices in production–where a greater spotlight on network communications can introduce new operational challenges beyond those common to traditional architectures. But, by being smart about your software-based routing components, it’s possible to avoid or reduce the impact of roadblocks in the following areas.

    Implementing Tracing and Monitoring

    Even applications that are rigorously tested during development will exhibit anomalies in production. To address these, DevOps teams require effective tracing and monitoring tools to gain visibility into what’s happening within clusters at runtime.

    As a strategy, developers should select routing solutions that integrate well with their existing monitoring and tracing backends. Remember that while a microservice may be developed by a certain internal team, once deployed it becomes available for others. If the application is instrumented to be traceable, compatible tracing tools can dynamically identify the source of service invocations and their call flows–enabling other teams to utilize the microservice. When the application is also designed to provide metrics, monitoring tools can usefully track the microservice’s key resource consumption metrics to assess the scalability of its subcomponents under load, and recognize any performance limitations that require attention.

    Because all inter-service communications travel through software routing elements, you can strategically design your application to enable microservices tracing and monitoring data to be collected. Teams can then put this data to work to more easily overcome challenges when building out new capabilities.

    Mitigating Communication Failures

    Considering the myriad communications taking place within production microservices-based environments, it only makes sense that this architecture will be prone to communication failures in which microservices simply cannot be reached. Whether these failures occur as the result of an error by the container, host, a network partition, or a short-term interruption in the availability of the service itself, resilient safeguards must be in place to mitigate any impact to an application’s user base. 

    For example: When an instance fails, the load balancer can be used to automatically reroute requests to healthy instances, and then return traffic to the failed instance upon detecting that it’s again available. In scenarios where an entire microservice becomes unavailable, client services should leverage circuit breaking to stop requests, return an error and initiate a fallback response. Doing so avoids dangerous repetition of retry requests, which only eat up resources and can lead to cascading failures.

    Each of these mitigation strategies could be accomplished by placing the necessary logic with each client. However, this technique would be both cumbersome to implement and prone to errors. The better approach to these challenges is to leverage routing solutions to perform instance health checks and circuit breaking, allowing DevOps teams to control how their applications respond to faults, rather than relying on logic at the network layer.

    Handling Unanticipated Load Spikes

    In production environments, loads can spike unexpectedly and for any number of reasons–ranging from simple sudden popularity with users to malicious distributed denial-of-service (DDoS) attacks. Whatever the root cause, applications must be well-prepared to withstand these events without failing.

    To ready applications to handle load spikes, rate limiting is a simple (but powerful) technique that allows operators to specify the request rates to front-end services. Implementing this safeguard through a routing solution answers the challenge of avoiding downtime due to surprise changes in load intensity.

    Securing Microservices Communications and Permissions

    Security is always a constant concern when it comes to operating production deployments. However,  microservices environments often have absolutely zero enforcement of internal network communications permissions. They also face the challenge of implementing proper encryption to secure sensitive data within both internal and external traffic. 

    While allowing any service to access any other offers flexibility, the risks are substantial. In order to safeguard microservices that access and expose sensitive data, it’s wise to limit access to only those client services with a vetted business justification. Routing technologies make it possible to enforce these secure policies using network segmentation.

    At the same time, routing solutions can help businesses encrypt the in-flight transport of critical data, which is not only a best practice, but in many industries a necessity from a regulatory compliance perspective. Service meshes can offer the benefit of providing secure TLS encryption for all internal east-west traffic, while edge routers offer to encrypt external north-south using a provided certificate. Also of note for north-south traffic: combining routing technology with services such as Let’s Encrypt can serve to fully automate lifecycle management of trusted certificates, eliminating the need for human intervention entirely.

    Achieving High Availability

    Leveraging software routing technology to achieve high availability is more cost-effective and efficient than traditional hardware failover solutions. It offers the opportunity to build production microservices environments that are quite resilient. For example: Routing implementation should utilize a highly-available architecture that includes a horizontally scalable data plane and a separate fault tolerant control plane. While the data plane allows for adding instances as necessary to meet capacity and resilience needs, the control plane is prepared to tolerate failures and ensure that users experience seamless and uninterrupted uptime.

    Deploying Across Multi-Cloud and Heterogeneous Environments

    Larger enterprises often utilize deployments across multiple cloud and/or on-prem environments, each of which may rely on disparate container orchestration technologies. Highly portable routing technologies capable of supporting a range of orchestration tools can vastly reduce the challenges developers face in supporting multiple environments. This allows them to deploy the same familiar solution and a common routing layer model across deployments.

    Routing technology is a key variable in determining the capabilities and ease with which DevOps teams are able to overcome challenges to the success of their production microservices deployments. By making a carefully considered choice in selecting a routing solution, teams can better prepare for these challenges–or even avoid them altogether.

    — Manuel Zapf

  • 3 Lessons in Network Visibility from the A-List

    3 Lessons in Network Visibility from the A-List

    The network can be host to multiple performance killers. Here are three worth noting

    Like Ed Sheeran as a secret stormtrooper in “Star Wars: The Rise of Skywalker,” some cameos are hard to spot. They can appear out of nowhere halfway through the film or remain a complete mystery until behind-the-scenes footage reveals the masked actor.

    The same can be said for guest appearances on your network. It’s tough to spot the hidden malware, application interactions, network delays and other “cameos” popping up, especially when organizations today are grappling with the complexities of public, private and hybrid cloud infrastructure and multi-tier applications. To adequately support a robust and secure digital infrastructure, you need network and application-layer visibility.

    With movie awards season upon us, I invite you to sit back, relax—pop some champagne, if you’d like—and I’ll tell you about three cameos that can be easy to miss in the network environment, and what you should do about them.

    Hidden Malware

    At a pivotal moment in the Oscar-nominated “Joker,” the evil protagonist studies a tape to prepare for his appearance on a popular TV show. On the tape, he sees a comedian appear on the same show—played by Justin Theroux. It’s a blink-and-you’ll-miss-it cameo from Theroux, very much like hidden malware traversing the network without detection.

    Whether they’re sophisticated or non-targeted, high-volume criminally motivated attacks can move throughout the network without your knowledge and cause enterprises significant damage and cost, to the tune of $6 billion by 2021. Emotet, described by the Department of Homeland Security as one of the most costly and destructive instances of malware, likely comes to mind as one of the most pertinent examples. It has the ability to move laterally through the organization, spread other damaging malware and constantly evolve.

    Spotting hidden malware requires network visibility that spans the entire distributed digital infrastructure, as well as having access to network data to ensure visibility for all security and performance tools. Specifically, organizations need reliable access to data in motion to tap into traffic across cloud and on-premise infrastructure and traffic flowing across 5G and 100GB networks. This type of pervasive visibility allows enterprises to keep up with the speed at which networks and businesses run, as well as with security demands.

    Interactions Between Applications or Microservices

    When Brad Pitt’s character in “Once Upon a Time in Hollywood” unknowingly ends up at the Manson Family compound, he comes across Dakota Fanning, who plays a key member of the infamous cult. Their meeting is short but meaningful, and sets the stage for additional character development and exchanges down the line. Interactions between applications or microservices are just as meaningful, with 80% of network traffic consisting of such communication on average.

    Understanding these interactions is critical for guiding digital transformation (DX) efforts, which are a top priority for 87% of business leaders. Among the goals of DX are streamlining business processes, cutting costs, improving productivity and introducing new business models that redefine industries—or build new ones. These are ambitious goals, and they’re ultimately realized through new digital applications built on intricate microservices-based architectures that need to be managed and secured.

    Only with a clear view, and the right kind of data, can you understand the applications’ interactions, performance and security characteristics to accelerate DX. And the only way to get to this view is to look at the data in motion on the network. The ability to isolate specific applications or microservices communication streams for deeper inspection allows infosec teams to easily understand access patterns and put in place effective micro-segmentation strategies. Application developers, too, can benefit from this by better understanding communication bottlenecks between applications and microservices, as well as troubleshoot them.

    Traffic Bottlenecks

    The latest rendition of “Little Women” follows a non-linear storytelling structure, constantly jumping between two timelines. It can be jarring to viewers when the girls’ father returns from war, revealing himself as the actor Bob Odenkirk. While this moment is meant to be an intimate glimpse into a family coming together after a long separation, it brings the movie-watching experience to a standstill, since the audience associates Bob Odenkirk less with a serious scene and more with his previous comedic roles.

    Networks today are similarly prone to experiencing abrupt slowdowns or bottlenecks that limit network performance and waste bandwidth. Managing the network to ensure constant availability is a major challenge when data volumes are growing exponentially. It’s estimated that about 1.7MB of new information will be created every second for every human being on the planet this year. This data explosion paired with digital transformation technology investments and lightning-fast 5G and 100GB networks has led to a very complex enterprise infrastructure setup—and network blind spots across physical, virtual and cloud environments.

    The solution lies in having the right kind of data to help you understand network and application performance. By analyzing the network traffic, you get immediate actionable data points that can be used to address trouble spots.

    Whether we’re talking big screen or enterprise network, surprise cameos are common and they are easy to miss—and this is particularly problematic when things like malware and bottlenecks pose a threat to network security and speed. For the NetOps and infosec pros tasked with complex infrastructure development, implementation, maintenance and security, you need a clear line of sight into what’s happening within the network. Armed with insights on traffic patterns (both cloud and on-premises), delays in data flow and insecure areas, you can use this intel to write the screenplay (or plan) to support a robust and secure digital infrastructure.

    — Shane Buckley

  • New Relic Adds Support for W3C Trace Context Spec

    New Relic Adds Support for W3C Trace Context Spec

    New Relic has begun adding support for the W3C Trace Context standard within the agent software it uses to collect metrics for its application performance management (APM) platform.

    W3C Trace Context is a specification that defines the format for propagating distributed tracing context between services. Distributed tracing makes it simpler for DevOps teams to track events across multiple services. Each step of a trace is correlated through an ID that is passed between services, with the specification defining a standard for the context propagation headers.

    The W3C Distributed Tracing working group moved the Trace Context specification to the point where it could be consumed by platform vendors late last year. TraceContext has since been adopted by the OpenTelemetry project, an open source observability framework being developed under the auspices of the Cloud Native Computing Foundation (CNCF), along with providers of APM platforms such as New Relic, LightStep and Dynatrace. Vic Soares, director of product management for New Relic, said many of the individuals working on the TraceContext and OpenTelemetry projects come from the same organizations.

    The first phase of the Trace Context project has focused on HTTP. The members of the project are also working toward defining trace context propagation for other formats, starting with AMQP and MQTT for IoT. The project team is also working on providing context propagation from clients and web browsers.

    That approach solves an issue that arises when using proprietary formats: As trace context headers move across boundaries such as proxies, service meshes and messaging systems, proprietary headers tend to be dropped, which often winds up breaking traces, said Soares.

    Soares said DevOps teams will need to upgrade the agent software they have in place to take advantage of Trace Context to provide more context across distributed services. Distributed tracing, however, will not replace sampling. Rather, distributed tracing provides a mechanism for identifying the root cause of issues that may first be uncovered using sampling techniques.

    New Relic APM agents for Java 5.1.0 and higher, Python 5.5 and higher, Go 3.1.0 and higher and the New Relic open source Elixir agent now support the standard. Support for Trace Context support in other New Relic agents, as well as the New Relic Browser agent, are expected to be available shortly. New Relic APM agents that support W3C Trace Context can accept and emit both the W3C Trace Context header format and the New Relic header format. The new agents are also backward-compatible to enable trace context and will be propagated between services with older and newer releases of New Relic agents. IT organizations can also opt to disable the New Relic proprietary trace format once they’ve upgraded all agents to a W3C-compliant version.

    Given the complexity of microservices-based applications, many organizations that deploy these applications will be among the first DevOps teams to take advantage of distributed tracing to not just troubleshoot applications but also proactively manage their application environments. Going forward, a lot more of the DevOps focus needs to be on identifying potential issues long before they can become a bigger problem.

    — Mike Vizard

  • LightStep Adds Regression Monitoring to APM Platform

    LightStep Adds Regression Monitoring to APM Platform

    LightStep this week announced it has added a Service Health for Deployments module to its namesake observability platform designed from the ground up for microservices and serverless computing frameworks.

    Talia Moyal, senior product manager for LightStep, said Service Health for Deployments will make it possible for DevOps teams to monitor performance regressions both during and after an application is deployed.

    DevOps teams can also take advantage of aggregate trace analysis functionality such as latency histogram comparisons, operations diagrams and an automated correlation engine for performing rapid root cause analysis to understand why a regression is occurring.

    Finally, a built-in instrumentation scoring capability enables DevOps teams to compare performance before, during, and after a deployment; compare latency across instances to estimate the size and scope of a regression; correlate tags that have the biggest impact on latency; and map critical path latency for each operation or service.

    As organizations embrace microservices and serverless computing frameworks, the overall IT environment becomes more complex to manage. As an application performance management (APM) platform, LightStep makes use of OpenTelemetry software to gather metrics that are then fed into a statistical engine to detect anomalies, which the APM can then record and replay. By employing OpenTelemetry, LightStep is able to employ distributed tracing to surface more context than traditional APM tools, said Moyal.

    Given the costs involved in employing APM platforms, most IT organizations historically have limited their use to their most critical monolithic applications. However, the dependencies that exist between microservices and serverless computing frameworks that make up a modern cloud-native application are now requiring IT organizations to apply APM platforms more broadly. In fact, observability is a core principle of best DevOps practices that many organizations are embracing more widely as they build and deploy cloud-native applications. Many of those applications will run just fine when initially deployed, but over time performance can degrade for a whole host of reasons that span everything from increased storage access latency to too many calls being made to the same application programming interface (API).

    Of course, there is no shortage of options when it comes to APM platforms. LightStep is making a case for OpenTelemetry because it provides a single set of open source APIs, libraries, agents and collector services to capture distributed traces and metrics. That approach makes it easier for developers to instrument their applications in a way that allows platforms such as LightStep to surface more insights into application performance. LightStep claims it has already employed that approach to analyze more than 1.4 trillion traces. OpenTelemetry is currently being developed under the auspices of the Cloud Native Computing Foundation (CNCF).

    It’s too early to say to what degree traces will supplant traditional sampling methods to analyze application performance. The one thing that is certain is as developers are held more accountable for application lifecycle management, many of them are demanding access to more sophisticated APM tools to provide the visibility they require to resolve application performance issues faster.

    — Mike Vizard

  • Microservices: The Advantages of SOA Without Its Drawbacks

    Microservices: The Advantages of SOA Without Its Drawbacks

    Service Oriented Architecture (SOA) was the great hope of organizations decades ago when they sought to advance legacy system integration, reduce and bypass layers, and rapidly access the system of record. At the time, the existing solution was point-to-point integration, creating a brittle “spaghetti” middle layer that was hard to manage. This was replaced by SOA, which was later augmented with ESB. This fixed the spaghetti mess by creating an intermediate set of layers, which added complexity to the integration process.

    Unfortunately, most IT departments with legacy systems and SOA still struggle to be as agile as needed in this ever-increasing global and digitized world. 

    SOA Solved Many Problems, But Not All

    Today, upward of 90% of the world’s enterprise applications are monolithic. When they were created, monolithic design was the best approach available. However, as business needs evolved and the demand for greater agility intensified, developers and IT teams are considering breaking free of these monolithic architectures.

    SOAs have become a hindrance, not the solution they once were.

    The SOA Integration Challenge

    The promise of SOA initiatives was extending the reach of core business functions while reducing the internal expenses and complexity that grew alongside monoliths. SOAs achieved these goals by breaking the core functions of a monolith into web services using protocols such as simple object access protocol (SOAP) and eXtensible markup language (XML).

    SOAP was built for universal application communications. Because it’s based on XML, SOAs designed with SOAP could, in theory, be used to create an agnostic integration layer. Rather than struggling to piece together various proprietary systems, these protocols would open monoliths on different operating systems so they could work together.

    This agnostic integration layer would let system administrators connect pieces of a monolith to an enterprise service bus (ESB) to achieve an agile, plug-and-play SOA. In some cases, this approach succeeded.

    A great deal of “legacy SOA” still provides value. In these cases, the value the SOA provides is the behind-the-scenes server-to-server communication that mostly aids developers. When it comes to serving internal and external customers–and their rapidly changing demands–SOA isn’t always up to the task.

    To achieve service integration, the ESB must oversee the messages from start to destination. This communication isn’t as simple as the SOA vendors may have promised. Consider an SOA integration within a core banking application. The message must go from the core application on the mainframe to a branch office server. If the business logic states a message is only relevant for one business day, administrators must decide whether to move it to a queue, log or disregard when the day passes. This is a common scenario for core banking applications in an SOA, but how well does it work?

    In this example–and others like it–the ESB must know whether a business day has passed to make the right decision about where to send the message. Therefore, the integration requires an algorithm–meaning that ESB cannot simply rely on a universal rule for sending messages between the monolith and external integration.

    When administrators introduce new business logic into the monolith integration, it turns what was supposed to be an agnostic service layer into a new application layer, increasing complexity. Instead of simply integrating the monolith into a new digital service, the enterprise ends up with a larger monolith–one that includes the mainframe and all the new integration stacks.

    Despite the promises of SOA, the integration problems result in increased maintenance time, greater complexity of code and software and the continued growth (not elimination) of monolithic applications.

    The first rule of effective integration is “smart end-points and dumb pipes.” Building logic and layers into the service layer breaks that rule, increases the overall complexity and adds another legacy application to your portfolio.

    Bottom line: Trying to optimize the SOA approach will only result in larger monoliths.

    Improving SOAs with Microservices

    Using microservice architectures helps realize the original promise of SOAs, delivering the benefits of SOAs while removing many disadvantages.

    For decades, CIOs have tried to transition away from monoliths by taking traditional approaches to integration, only to find they’ve doubled down on legacy investments. All these integration stacks end up coupled to legacy systems and only result in more work for the IT team–and a less agile organization.

    The integration step of SOA was never intended to include business logic. Trying to force business logic into this approach leads to workarounds and extra effort just to achieve a less-than-ideal result.

    The key factor is how to incorporate microservices without adverse effects. Luckily, microservices architecture can be forged from SOAs by introducing these new principles:

    •   Context Mapping: When replacing an existing SOA, teams must consider the size and scope of the new microservice and apply proper contextual boundaries. For example, SOAs that typically sought broad integration with digital services should be broken down into smaller domains to simplify operation.
    •   Shared-Nothing Architecture: Too many SOA integrations create sprawling dependencies that create complexity in the tech stack. Microservices avoid these cross-service dependencies. For those looking to move to microservices from an existing SOA, it’s important to look at the list of dependencies and work toward standalone functionality.

    Ultimately, the goal should be to refactor monoliths in a way that shifts the IT stack toward microservices. By taking the right approach, you can make the most of both microservices and APIs within your SOA. You enhance your digital journey, leading you to IT efficiency, faster cycles, greater scalability and competitive differentiation.

    — Zeev Avidan

  • The Acceleration of Data and Data Storage Trends

    The Acceleration of Data and Data Storage Trends

    There’s never been a more exciting time for data. Increasing demands for size, speed, performance and reliance have propelled the data market forward at a faster rate than could have ever been anticipated, and new technologies are making some dreams for data a reality.

    From open source adoption in place of legacy databases to cloud-native app stacks and more, here are seven trends driving the acceleration of data and data storage. 

    Oracle’s Slow Fade Drives Cloud-Native Adoption

    Organizations of all sizes continue to eschew Oracle for cloud-native databases, shrinking the user base of the monolithic legacy provider. Two major trends driving this activity are the ongoing move to microservices-based redesign of applications and the rise of cloud-native deployments running in public clouds or Kubernetes. Overall, Oracle has lost market share every year since 2013, and legacy relational database players have dropped about five percentage points per year. Major organizations, such as Amazon and Salesforce, have already figured out that it’s to their benefit to use less, not more, Oracle.

    Open Source DB Usage Increases

    Open source databases that claimed 0% of the market 10 years ago, now make up more than 7%. It’s clear that the market is shifting and an increase in open source database adoption is on the rise. This goes against the recent trend of database and data infrastructure companies abandoning open source licenses for some, or all, of their core projects. However, as technology rapidly advances it will be in the best interest of database providers to switch to a 100% open source model, since freemium models take a significantly longer period of time for the software to mature to the same level as a true open source offering.

    Furthermore, Gartner predicts that, by 2022, more than 70% of new in-house applications will be developed on an OSDBMS or OSDBMS-based dbPaaS. It’s clear that open source has proven to be the most successful approach to developing and distributing business-critical infrastructure software, driven by the benefits of reduced total cost of ownership, access to community support and innovation and compatibility with commercial databases, making it easy to migrate towards an open source solution. 

    Kubernetes For Stateful DBs

    There has been continued growth in the adoption of both microservices and containerization. With the combination of massive adoption and the support of a large and thriving open-source community, it is clear that the dynamic nature of containerization and microservices deployments will have huge implications on fundamental application architecture. To put it simply, this is the future of how applications will be built. This is also why the adoption of Kubernetes has continued to grow.

    Multi-Cloud Goes Mainstream

    Multi-cloud deployments are becoming the norm in today’s enterprise. A multi-cloud approach is critically important for organizations that run on-premise, since they need to stay in a hybrid mode when moving microservices to the cloud. As a result, enterprises are widely embracing distributed SQL databases to ensure agility without the availability constraints of traditional monolithic databases, such as Oracle. 

    Rise of Edge Data Centers

    While the rise of edge data centers is assuredly a trend, Gartner predicts that three quarters of all databases will either be deployed or migrated to a cloud platform by 2022. There will also be an increase in multi-cloud adoption as a result of the geo-distribution of data. Edge data centers are already starting to offer data services with geo-distribution, a clear sign that demand is creating supply.

    Cloud-Native App Stacks Gaining in Popularity

    Modern microservices-oriented architectures are becoming increasingly popular. Over time, this leads to environments with lots of microservices that should be able to notify one another of changes and store these changes in a system of record. The application stack that is getting very popular for such use-cases is a combination of:

    • Spring framework to build the applications.
    • Kafka as the message bus to send notification between the microservices.
    • A Distributed SQL database to store the data in a scalable manner and query it efficiently.

    Other application stacks that are rising in popularity are the JAMstack ( Javascript, APIs and Markup) where there is no dependency on any particular web server. Javascript frameworks such as ReactJS and VueJS have become very popular for building the frontend portion of the app. GraphQL frameworks such as Apollo and Hasura are getting increasingly adopted as efficient ways to build the API portion of the app.

    Advances in innovation for data and data storage will undoubtedly continue, driven by major trends across all areas of business, as long as organizations are prepared to embrace change and hit the accelerator on their data strategies.

    — Karthik Ranganathan

  • Opsani Applies AI to Rein in Cloud Costs

    Opsani Applies AI to Rein in Cloud Costs

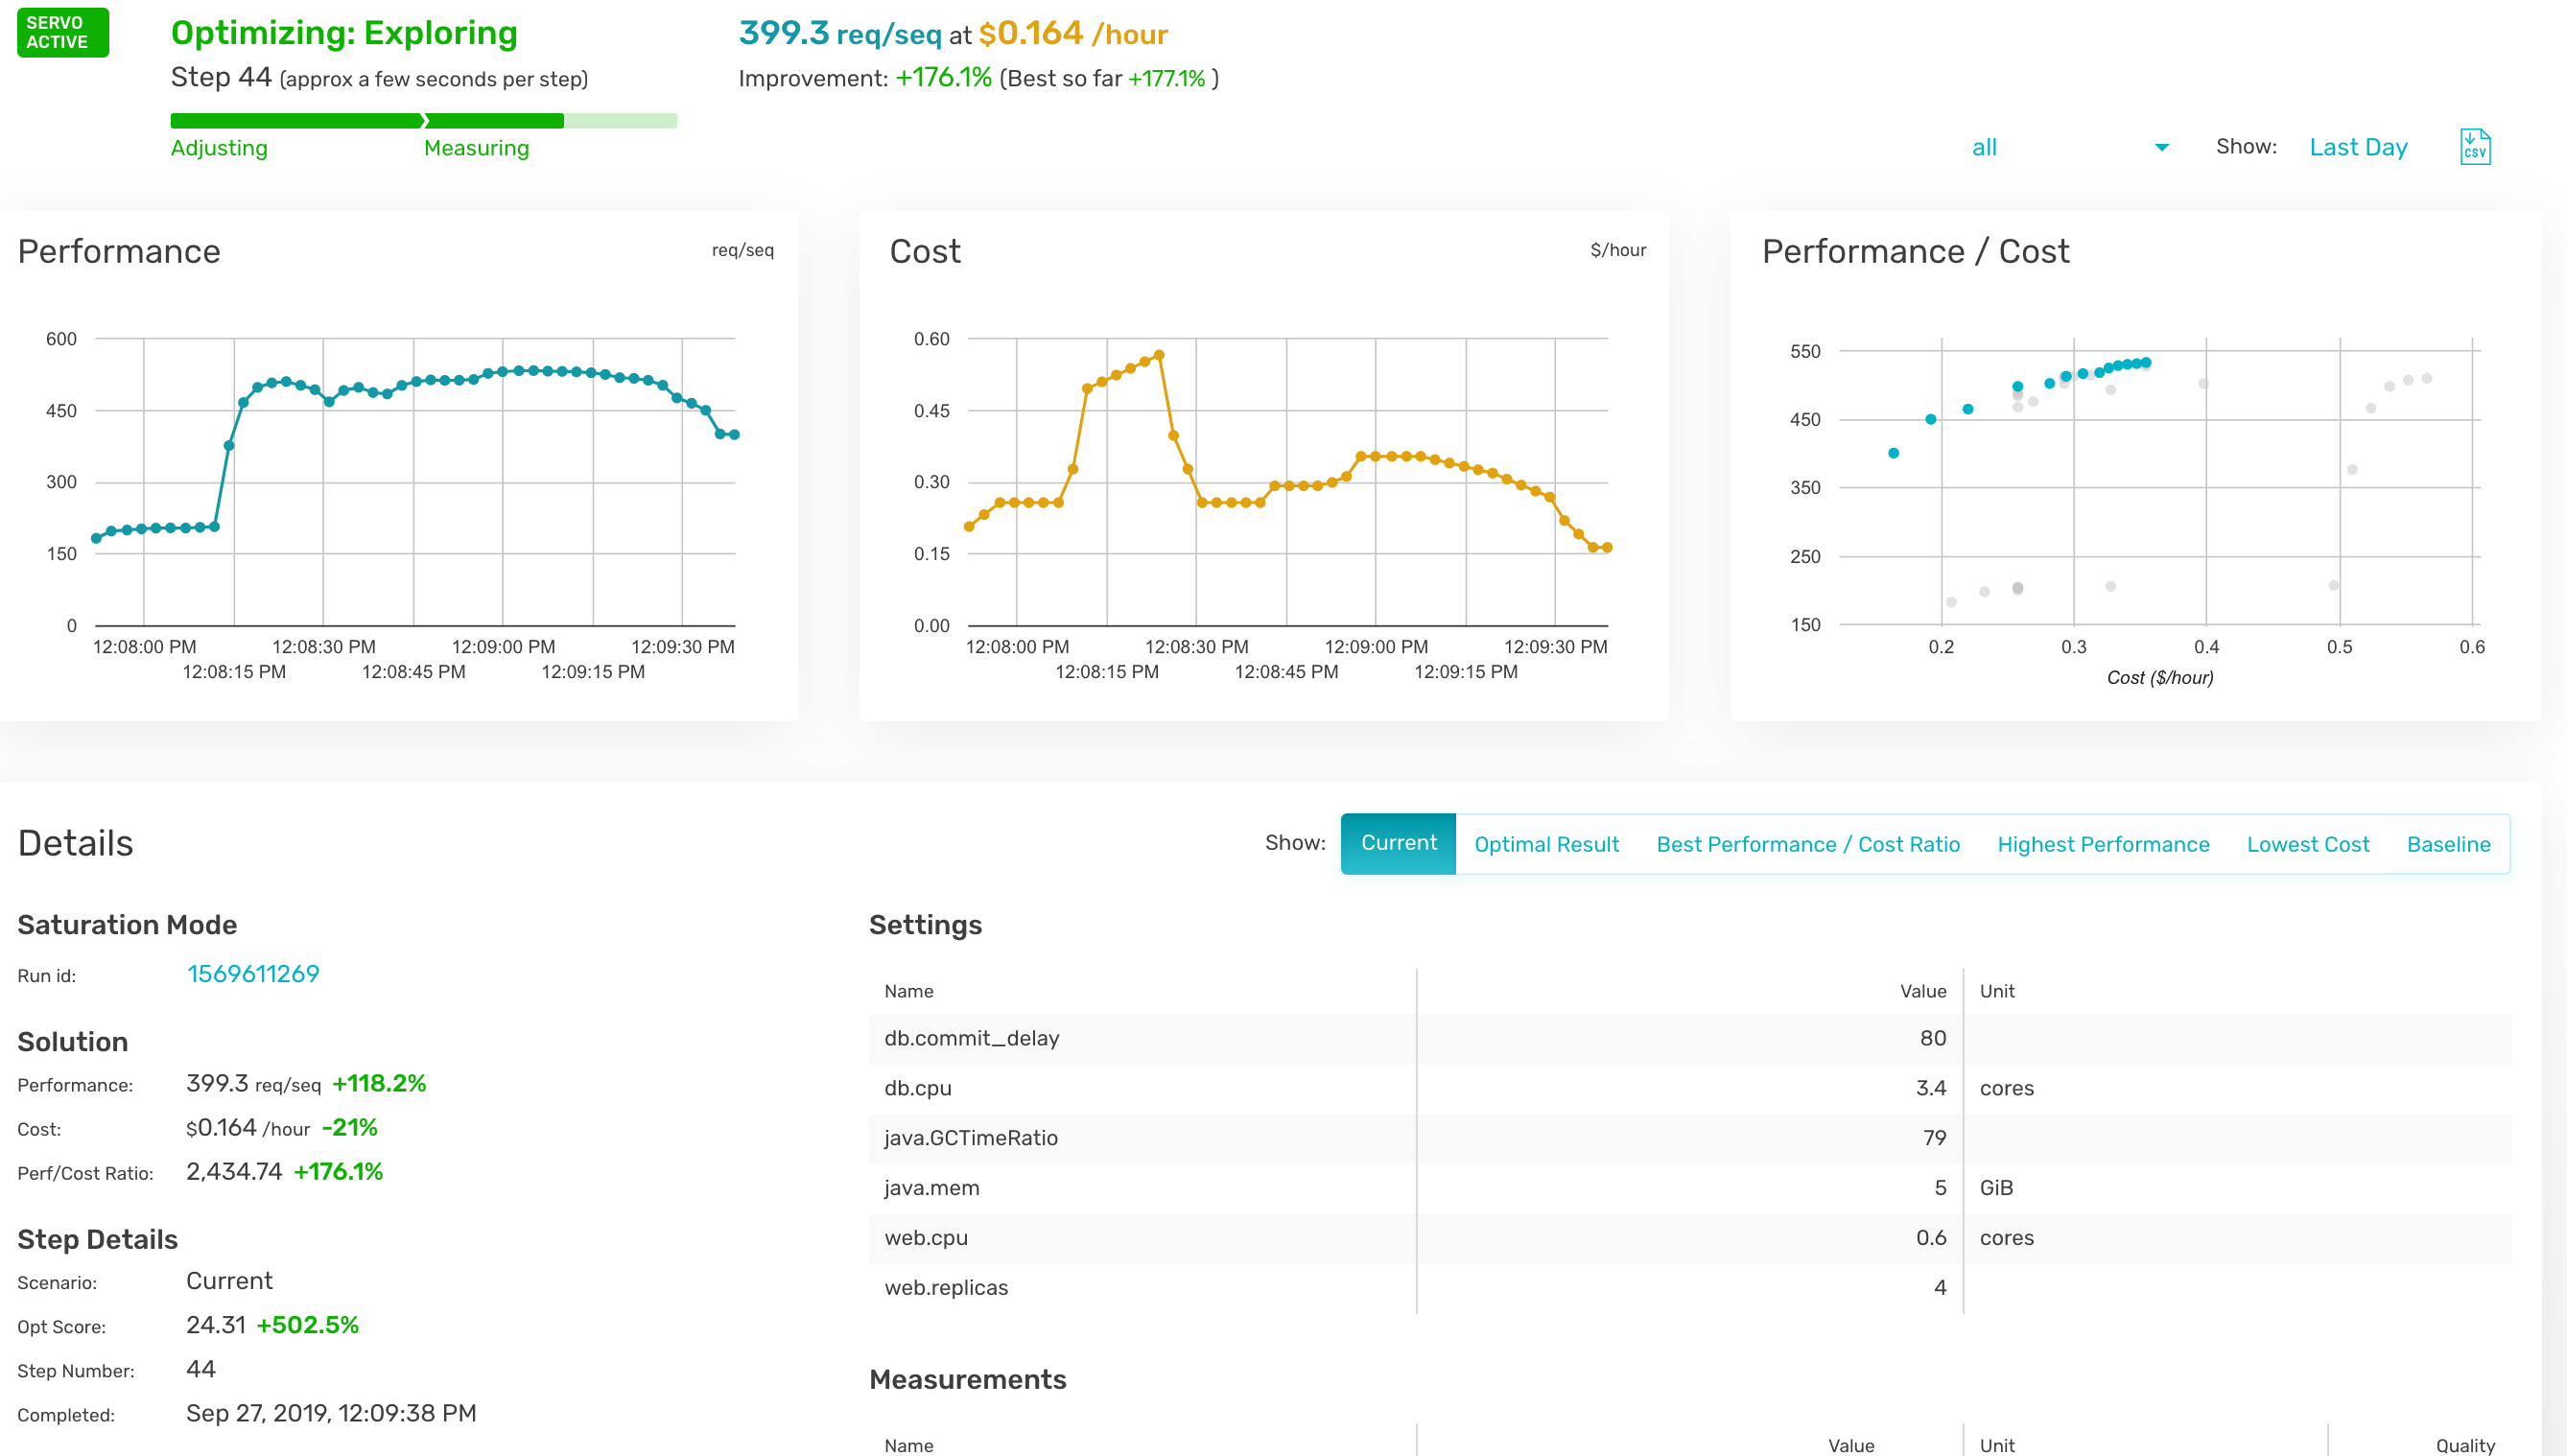
    Opsani has added support for cloud computing environments to its namesake software-as-a-service (SaaS) platform that leverages machine learning algorithms and other forms of artificial intelligence (AI) to optimize the IT environment.

    Company CEO Ross Schibler said Opsani AI not only proactively tunes resources such as CPU and memory, but it also can optimize middleware configuration variables such as Java virtual machine (JVM) type and pool sizes; kernel parameters such as page sizes and jumbo packet sizes; and application parameters such as thread pools, cache timeouts and write delays.

    Given the size and dynamic nature of most cloud computing environments, Schibler said it’s not possible for IT administrators to manually optimize cloud computing environments to match the specific needs of each class of application workload being deployed. The Opsani platform makes it possible to leverage AI to optimize settings for the lowest cost or best performance every second, he said.

    Opsani claims existing customers are seeing more than 200% increases in performance per dollar while saving up to 80% on their cloud spend.

    In addition, Opsani has made available plugins for a variety of DevOps tools including GitHub, Terraform, Jenkins, Spinnaker, Wavefront, DataDog, SignalFX, Prometheus, Splunk and New Relic, on all the major cloud computing platforms.

    Schibler said Opsani can be applied to existing monolithic applications as well as emerging microservices-based applications based on containers running on Kubernetes clusters. The goal is to make it possible for IT teams to rein in cloud costs at a time when most cloud resources are being employed inefficiently, he said.

    Individual developers are deploying applications on virtual machines in the cloud with little to no appreciation for total cost, noted Schibler. Before most IT organizations realize it, the cost of running applications on a public cloud has far exceeded budget allocations. IT organizations not only need tools to rein in those costs, but Schibler noted Opsani also makes it possible to model those costs before an application is deployed or upgraded.

    The adoption of public clouds and DevOps often go hand in hand. The challenge organizations are encountering more often is that as the number of applications running in a public cloud computing environment increases, they often wind up overprovisioning resources. Over time, the need to optimize the consumption of cloud resources becomes a more pressing financial concern. However, most IT organizations don’t have the resources or expertise needed to manually tune each instance of cloud workload. At the same time, the typical IT organization doesn’t have the ability to build its own AI engine. Opsani is making the case for a SaaS platform that provides that capability without requiring an IT organization to build its own AI models from scratch.

    Naturally, many IT professionals are dubious of AI because there may not be enough transparency into the AI models being employed. However, because Opsani is a SaaS platform, the risk of experimenting with AI to optimize cloud workloads is relatively slight. Of course, there’s no absolute requirement to employ AI at all. However, as financial pressure on IT organizations continues to mount, there doesn’t seem to be much of an alternative either.

    — Mike Vizard

  • Service Meshes: Improving Security, Delivery and Availability

    Service Meshes: Improving Security, Delivery and Availability

    Containerized microservices are taking over the software world. These services provide developers a way to quickly create and deploy cloud-native applications. However, containers aren’t perfect. Orchestrating and managing container deployments can be a serious challenge. 

    To help ease this challenge, service meshes were developed. In this article, you’ll learn about service meshes components and architecture options. You’ll also learn how services meshes can improve your container deployments.

    What Is a Service Mesh?

    A service mesh is a dedicated communication layer that sits on top of your request/response layer. It works similarly to a Container Networking Interface (CNI), which controls the connection of your services to your network. A service mesh sits on top of your CNI, adding additional functionality, such as service discovery or security. A service mesh is not a replacement for a CNI or a service orchestration platform.

    Services meshes are designed for use with containerized microservices. You can use this technology with any container or container orchestration tools. However, the most active projects seem to favor developing service meshes for Kubernetes.

    Service Mesh Architectures

    When deploying a service mesh, there are three architectures you can choose from.

    Library 

    The library architecture employs a library that is imported in an application’s code and runs from inside the application. Using a library eliminates the need to call out to a remote service, making it more secure.

    Libraries make it easier to allocate resources since all work is contained in the microservice running the library. A library architecture works well for in-house applications that are written in one language. Third-party applications are difficult or impossible to add the library to.

    Node Agent 

    A node agent architecture uses a node agent or daemon that serves all containers on a particular node. A node agent architecture is language-agnostic since it doesn’t run from inside your microservice. It can be used with in-house and third-party applications. However, node agents must be coordinated with infrastructure processes, making this architecture more complex to deploy.

    Node agents require less memory than sidecars since information can be shared across a node. This architecture employs work resource sharing, with dynamically shared resources, making it easier to scale. The downside of sharing, however, is that it can be abused, with one service hogging all available memory.

    Sidecar Proxy 

    A sidecar proxy architecture uses sidecars that run alongside your containers. The sidecar handles all traffic into and out of the container it is attached to. Sidecars do not require coordination with your infrastructure since one proxy is assigned to each container. This lack of coordination makes sidecars easier to set up than node agents.

    Sidecars only serve one pod and are not influenced by other pods. This isolation makes this architecture better for zero-trust deployments as each container is accountable for its own actions. Sidecars can be added to containers at any time, enabling you to easily scale processes.

    Use Cases For Service Meshes

    Service meshes are an emerging technology, with new use cases being actively developed. The three use cases introduced here are just the ones that are currently most common.

    Improving Security

    Containers are isolated environments and generally considered to be more secure than traditional applications. However, containers still contain vulnerabilities, such as possible abuse of root access. 

    Service meshes can help address security concerns by providing:

    • Zero-trust security—any communication, either from inside or outside requires verification. Verification prevents compromised containers from interfering with other microservices or your broader system. It restricts a container’s actions and communications to that container alone.
    • Communication tracing—enables you to collect communications information and isolate errors or issues. If a container is communicating in an unexpected way or against protocol, you can identify it. Once identified, you can easily replace the container with an uncorrupted image or remedy the issue. Tracing enables you to pinpoint possible attacks, including where attackers came from and what they’re trying to accomplish.

    Improving Delivery

    Containers already improve on application and service delivery by making it easier to release and patch services. Service meshes expand upon these capabilities by improving application and performance monitoring functions. 

    Service meshes can also help improve service delivery by enabling:

    • A/B testing—provides advanced routing, enabling you to divide traffic between A and B versions. This routing makes it simpler to set up A/B testing. Additionally, tracing features enable you to gather and analyze user traffic and interactions.
    • Rapid versioning—new versions can be released with zero downtime and reduced risk. Containers can be started and verified healthy before traffic is gradually shifted between versions. If issues arise, changes can be rolled back without system-wide consequences. Easier corrections enable you to relax delivery requirements with minimal risk.

    Improving Availability

    Containers can provide improved availability, depending on your hosting configuration and resources. Service meshes can expand upon these abilities by improving load balancing, traffic management and health monitoring functionalities.

    Service meshes can also help improve availability by enabling:

    • Resilience testing—enables you to test how services respond with fault injections. Service meshes enable you to test your services’ fault tolerance. Increased understanding of how faults affect resilience helps you identify and correct vulnerabilities. Greater service resilience leads to greater availability.
    • Deployment and request shadowing—enables you to simulate anticipated traffic flow and see how services respond. Shadowing enables you to test the traffic and workload capacities of your services. With this information, you can determine whether you need to scale resources and connections. Proper scaling ensures that your traffic needs are met and prevents traffic bottlenecking and decreased availability.

    Conclusion

    As microservices become standard, teams are placing an increased focus on improving container performance and security. The development of service meshes is a result of this increased focus.

    Hopefully, this article helped you understand what service meshes are and how this technology can help improve your container deployments. If you’re interested in seeing how a service mesh might help you, check out this tutorial explaining how to build a service mesh.

    — Gilad David Maayan