Tag: logging

  • Chronosphere Acquires Calyptia to Process Log Data More Efficiently

    Chronosphere Acquires Calyptia to Process Log Data More Efficiently

    Chronosphere today announced it has acquired Calyptia to add additional pipeline management capabilities to its observability platform.

    Calyptia created Fluent Bit and Fluentd, a set of open source log processors that are now being advanced under the auspices of the Cloud Native Computing Foundation (CNCF).

    Chronosphere CEO Martin Mao said these log processors will be embedded into the company’s namesake observability platform to enable the routing, transformation and optimization of log data at scale. That issue has become problematic because cloud-native applications based on microservices create exponentially more telemetry data than legacy monolithic applications. If it becomes too costly to analyze that data, then DevOps teams will begin to limit the number of applications they will observe, noted Mao.

    The Calyptia platform achieves that goal using filters at the data source to reduce the volume of data that might otherwise be shared by 30% or more.

    The shared data can then be analyzed in real time rather than waiting for it to be stored and indexed. In addition, DevOps teams can enrich that data in flight to include additional context.

    Calyptia cofounder Anurag Gupta added that the primary mission for the company has always been to make log data more accessible to developers as they build and deploy applications.

    The acquisition of Calyptia comes on the heels of a log management alliance between Chronosphere and CrowdStrike through which a log storage and virtualization capability, dubbed Logs powered by CrowdStrike, has been added to the observability platform. The overall goal is to simplify the management and analysis of logs via a single click of a graphical tool or within the context of a larger DevOps workflow based on a command line interface (CLI) without requiring data engineering expertise, said Mao.

    It’s not clear how fully DevOps teams have embraced observability, but it’s apparent the legacy monitoring tools that collect a set of predefined metrics are not able to keep pace with the complexity of cloud-native application environments. An observability platform makes it simpler to query log data and discover the root cause of an issue—hopefully before a catastrophic event occurs. The challenge, of course, is providing that capability without incurring massive increased storage costs for log data.

    Despite those concerns, the need for observability is becoming a more pressing issue with each passing day. Organizations have never been more dependent on applications to drive revenue. A degradation in performance is usually an early indicator of a disruption that often has a direct impact on revenue and profitability.

    There is, of course, already no shortage of observability platforms. The issue most DevOps teams encounter is finding the funding needed to employ one at a time when organizations have become much more sensitive to IT costs. There may be an opportunity to rationalize some monitoring tools to help pay for the cost of a more modern observability platform, but regardless of approach, an ounce of prevention is always going to be worth a pound of proverbial cure.

  • The Right Tool for the Job: Alerting Edition

    The Right Tool for the Job: Alerting Edition

    In high-tech, we have a terrible predilection for finding a good tool and abusing it until we hate it. I’ve written several “Use the right tool for the job” articles and posts over the years, most notably an examination of trying to make one programming language (or another) into an all-purpose solution. We’re thankfully past that … for now. But we do the same thing across all of IT in general and DevOps in particular. Consider what we did to Jenkins when DevOps was coming of age. It went from a great innovative tool to a bloated monster we tried to use to automate just about everything short of making coffee in between integration runs. Fact is, Jenkins is still a good tool in the CI space; everyone started hating it because it was over-used. It’s a terrible tool when used for things other than what it’s good at. Imagine that. We can make the same statement about, well, everything. “A car is a terrible tool when used as a life preserver,” is a good example of some of the absurdity that makes us hate good tech.

    The 2023 edition of this phenomenon came up on a for-fun video call with some friends this weekend, and talking about it made me realize how bad it has become. Thus, I give you the point of this post:

    Slack is not your documentation tool. It is not anything but an efficient alerting tool and maybe a stand-in communications tool for short-term convos.

    I see it all over the place. “Oh, we discussed that on Slack.” That’s great, where did you document it? Because honestly, some of the companies I deal with have busy enough Slack channels that if the conversation happened more than an hour ago, it will never be seen again.

    Slack, and a few similar tools, are astounding alerting channels, offering an opportunity to notify when events occur, and we really should continue to reap the ease-of-use and massive alerting benefits that these tools offer. But don’t confuse that with long-term anything. Because it is not.

    Alerting to Slack needs to be one piece of a larger puzzle. Making sure that whatever was alerted on was also logged somewhere (either by the alert mechanism or by whatever tool spawned the alert), and for a whole array of issues that are alerted on and many of the conversations that happen in Slack, long-term documentation needs to be created.

    So this is a lot of words to remind you of what you already know: Slack can enable quick communications, alerting and innovative solutions by having broader discussions without cramming everyone into a conference room. But it is not a documentation tool in any way, and it needs to be part of an integrated solution that uses the right tool for the job. Security alerts, for example, better be ending up in the SIEM (they are in every organization I’m aware of; just using that as a glaring example).

    And keep rocking it. Just make sure while you’re running at 500 miles per hour to keep up with Agile and DevOps speeds, you are capturing the stuff that will be important in six months or a year somewhere that people can actually find it. And use each tool to do what it’s best at. Convenience is almost never the best selection criterion for a tool to solve a given problem.

  • Free Dev Tools! But What’s the Catch?

    Free Dev Tools! But What’s the Catch?

    Software companies, especially young startups, are always in a development race – by definition, they are trying to maximize achievements and minimize their burn rate. That means development teams naturally face an internal tug-of-war. On one hand, they seek to use the newest dev tools that the market can offer, targeting their applications to become better (more secure, more efficient and compliant with the latest standards). On the other hand, they cannot spend money on such tools since they need to save every penny. With the current economic climate, many new investments are being delayed or, at minimum, double-checked. 

    To appeal to developers, many vendors and software development tool companies offer freemium programs. Some are driven by the spirit and the goodwill of open source and community; others are business-to-developer (B2D) companies relying on the product-led growth (PLG) mode. If developers see value in the free tools, they are more likely to become paying customers later on to get access to more features.

    Here, we’ll review the common parameters of popular free developer tools and distinguish their services between the free tier (aka the community tier), the entry-level paid tier and other paid program offerings. We’ll look at tools for observability, logging, vulnerability scanning, compliance, authentication and VPNs.

    1. Volume Threshold

    Logs are considered to be one of the three pillars of observability and are the bread and butter of troubleshooting and debugging. The more code lines you have in your product, the more loglines you collect, store and aggregate. Logs accumulation can quickly get out of hand and become very heavy on the budget. One logs aggregation vendor, Sumologic, provides a freemium offer that allows log collection up to one gigabyte per day. If you need more volume, you can move to their paid tier that allows for higher volumes or pay more for no limits at all.

    2. Transactions Threshold 

    Transactions and tests are probably the most imperative features of a freemium offer. It involves the core offering with a quantity limitation, giving you a chance to try the product through practical use, but you’ll probably have to move up quickly into the first paid tier. Snyk.io, for example, will help you scan your open source software for flaws alongside container vulnerabilities as early as code creation, with up to 200 open source tests and 100 container tests per month.

    3. Certified: Security and Compliance 

    It’s one thing to play with, say, a free AutoCAD seat that doesn’t involve sensitive data and another thing entirely to draft the next-generation design that must not leak to your competitors. Security and compliance certification is often included in the freemium tiers; more detailed reports and analysis of security and compliance are for the paying tiers only.

    4. Availability and SLA Support 

    Having a free tool is great–but if this tool is bound to a proprietary service, then you should probably demand these tools meet the same standards and SLAs that you are offering your customers. Observability platform Rookout offers 24/7 support and dedicated account managers and tools for enterprise customers in all tiers.

    5. Legal Aspects 

    One key aspect of free tiers is the legal aspect of using the tool. The dev tool may interact with sensitive data, not only in your own dev environment but also with your customers’ environments. Your customers may require your dev operations to meet specific criteria, making the free tier a potential legal issue. For example, if you use the free tier of JFrog to manage your supply chain, you won’t be able to use Artifactory to publish data to third parties; should you want to do that, you will have to move to one of the paid commercial programs.

    6. Usage Threshold

    Some free tools operate based on a usage model—you are entitled to a free tier until a certain amount of users or actions is reached. Auth0, for example, a user authentication solution (now part of Okta), provides their service free of charge for up to 7,000 users (generous!) but should you grow beyond that, you’ll need to graduate to a paid tier and be charged according to your monthly usage.

    7. Speed Threshold

    Some free and freemium offerings are tempered based on connectivity speed, bandwidth and even VPN. Today, you can even get a secure VPN for free, but only to a specific threshold. For example, ProtonVPN will provide you with a free VPN at a medium speed, if you move to the highest speed VPN, you’ll need to move to a paid tier.

    In most cases, the freemium tier will limit a dev tool’s usage according to one or a few main characteristics but will allow you to perform the basic actions and enjoy the essence of the tool. Some parameters may be trivial, like volume of tests, while others require developers and DevOps teams to carefully monitor usage. There’s a lot of value in free and freemium dev tools—but make sure you read the fine print.

  • How to Build Actionable Logging Systems

    How to Build Actionable Logging Systems

    Logging is often considered an automatic process that doesn’t require much thought. We see logs, in general, from any system and take for granted that those logs have the information that’s needed. However, thinking through a logging strategy and architecture is extremely important for troubleshooting and performance efficiency. Regardless of how you log, the most important part of logging, after simply having logs in the first place, is having logs you can actually use. Actionable logs provide enough information, enough detail and enough history to ensure you can use the logs to get something done.

    Let’s examine an example system. This example system is an application, with a microservices architecture, running on a Kubernetes cluster that lives on top of an RHEL box. By default, you get logs from the operating system and Kubernetes. But to get logs for the different microservices, you have to program those logs into your application while building the codebase. So how do you set up useful, actionable logs successfully?

    Three Main Considerations

    Consider the following elements when you think about building actionable logs.

    Enough Information

    Your logs should provide enough information to answer ‘when,’ ‘who’ and ‘where’ for any event. As an example, let’s say you want access logs. If there was an access event for your system, the log line for that access event should tell you when that access occurred; this is known as the timestamp. The log line should also include information about who accessed the system. Often, this detail comes in the form of an IP address or other identifier, and the ‘who’ should include not just human interaction, but also actions by other systems. Always log every access! Finally, the log line should include the location from where the system was accessed, meaning which service or which part of the platform was accessed.

    Enough Details

    Your logs should provide enough details to tell you exactly what happened during any single event. Simply answering the who, when and where doesn’t actually tell you what happened, and a basic answer such as “This pod started,” doesn’t provide enough detail to differentiate a code change triggering a pod restart from a system crash triggering the orchestrator to restart pods.

    Enough History

    Finally, your logs should provide enough history to understand why something happened. Logs, overall, help you understand the context of the action that was taken. Writing log lines to a terminal somewhere without storing them is pointless. A single log line doesn’t provide you with enough context to understand the “why” for any action or event. How could you tell if an event was normal for a system without an easily accessible history?

    All three of these components are necessary to create a plan that will lead to actionable logs—logs you can actually use to understand what happened, why it happened, and how you can act to handle the situation. If you can answer who, what, where, when and why from your logs, you probably have actionable logs, and are well on your way to meeting or exceeding logging best practices.

    Next-Level Considerations

    Once you’ve thought through those higher-level considerations, you can think about the nitty-gritty of your logs themselves. When I think about the practicalities of logging, I think about these main considerations: log levels and data needs, format and structure and security and compliance

    Log Levels and Data Needs

    Using log levels properly ensures that you collect and store the data that you need, and only that data. Logging can get very noisy, very fast in modern environments. Log levels provide the ability to fine-tune your logs to store only what you need; this can help you find information quickly in an emergency, rather than digging through the haystack for the proverbial needle. In addition, someone is more likely to keep logging capabilities turned on when it gets noisy if they have the ability to reduce the noise and fine-tune the information, versus having only an on-off switch.

    Different programming languages use different combinations of log levels, but all of them have general categories of major, minor and debug logs. Major logs, as you might guess, should be on for all environments. Minor logs, generally, are turned on in environments for which you need to be able to understand the data flow without necessarily knowing the minute details. Finally, debug logs are generally turned on in dev or QA environments, and only when you need to know every detail – such as when you’re looking for issues that could turn into problems later on. You will need to ensure the necessary log levels are set in your code, as they aren’t necessarily automatic, but taking this extra step is worthwhile.

    Format and Structure

    You need to think about who or what is the primary audience of your logs. If you anticipate sifting through the logs yourself, you’ll likely not mind a text-based format. However, most modern logging uses machines to parse the logs and make the mounds of data more useful. In that case, you should use structured logging; JSON is the standard for structured logs due to the plethora of tools available for working with the standard.

    Security and Compliance

    Logging for security and compliance could be (and has been!) a full article, on its own. The short version, however, is that logging is a key pillar of a compliant system that is aware of, and actively monitoring, its security. If your stack doesn’t log everything to one or more append-only log files, stored in secure location(s) with a read-only archive stored in a separate location, then you’re at risk of an attacker coming in and modifying or deleting logs so you can’t track their actions across your system.

    Your logging processes shouldn’t store personally identifiable information (PII) in clear text or behind an easily broken cypher, either. It’s better to keep that PII in a secured and hashed database, with a unique identifier (UID) that correlates to the database, if you definitively need to keep that PII in your logs in some form, or strip it out if you don’t need it.

    Working Together

    All of these tips are fine and dandy, until you realize that you cannot get enough buy-in from others to ensure everyone follows the same best practices. It’s generally best to come to an agreement as to logging standards and practices across an organization. That will also help, as anyone working on a different system will start from the same baseline, and not have to understand another team’s standard, if they come in to help in an emergency. Ops teams working across many systems will appreciate the standards, as well. To get everyone to the table in the first place, start by appealing to each of their needs. Ask about people’s problems with logging and listen to responses. You likely will need to address assumptions folks make, misconceptions, complacency and resentment. The key is listening; you won’t get buy-in until everyone feels heard and validated.

    To get everyone on the same page, you should first identify, as an entire organization, the needs you have from your logs based on the components of actionable logs. Ensure everyone has a seat at the table and the ability to discuss and unearth all needs, so no one is tempted to go around the team’s decision. One team’s needs will not match another’s, so you need to ensure that all viewpoints are heard and accounted for. Then, organize related needs and set standards for those needs. Once you’ve agreed to your new standards, work together to update your systems. This will take time, just like it does with resolving any technical debt! Start with smaller systems, or less-critical systems, so you can monitor how the standards are surfacing in real life, and how well everyone’s needs are met. Adjust, if you need to, with everyone’s agreement. Needs and standards will change, just like your systems will, and they need to adapt to fulfill the needs of your teams. If you take the time to get everyone to the table and make sure everyone is on board, you’ll be better off.

    What You Need to Succeed

    Logging may seem like simple magic that ‘just works,’ but there’s a lot to think about before you can have a successful, useful system. You need actionable logs that have enough information, details and history to be useful. You need to think about the data you need for all of your various systems, how you’ll structure that data and how you’ll ensure you stay secure and compliant. Finally, you need to ensure your team is on board with standards so logging can be as useful as possible. If you do all of that, though, you’ll find logging becomes a great way to communicate across teams and organizations to ensure you deliver the best product possible.

  • Cracking Production Performance Issues With Open Source Observability

    Cracking Production Performance Issues With Open Source Observability

    I would like to share a recent case study on our organization, Logz.io, which battled a very serious performance issue, the solution for which turned out to be a small change in code but with a huge impact on all of our HTTP endpoints in our platform.

    Among other topics, I’ll cover:

    • How we investigated and found the root cause.
    • Logs, metrics and tracing all together to have better observability.
    • How Jaeger, as a tracing tool, ease to visualize our potential bottlenecks.
    • How to correlate logs and traces.

    Performance: Our Wake-Up Call

    Some may say we are experts in observability and mainly in logging; after all, that’s what we do for a living. Once we encounter any performance issue, it should be no-brainer for us to fix it in no time.

    That might be true in certain use cases, such as whenever there are few slow endpoints and identifying the root cause via logs is easy. But in practice, logs are not enough when the situation is more complicated. We’ll see this later on.

    In our case, performance issues were reported especially during peak usage times—2-7 p.m. local time, overlapping between EU and U.S. customers.

    We use our own product, just like any other customer, so we saw on our internal Slack channels that employees were experiencing increased latency over the same period of time.

    Better Observability When Using Logs, Metrics and Tracing

    To correlate users’ complaints and actual monitoring data, we usually check all three main pillars of observability: logs, metrics and trace data. Let’s have a closer look at how we used each one of them in this case:

    Logs

    Our log analytics product is built on top of open source ELK stack.

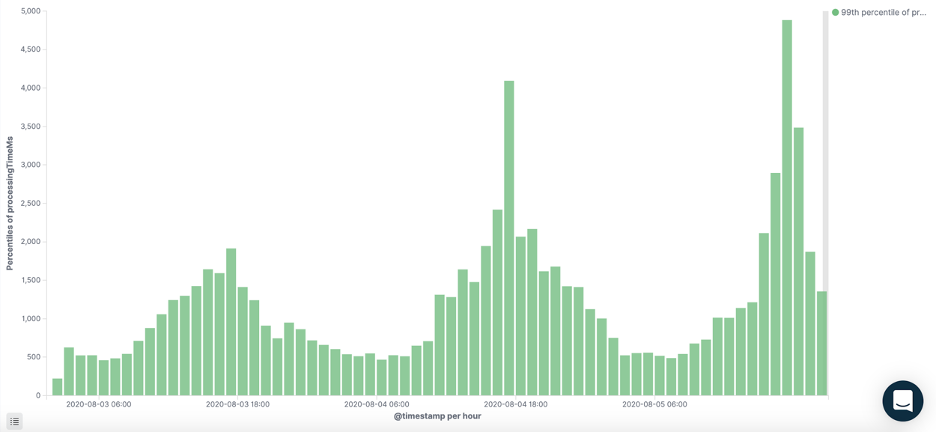
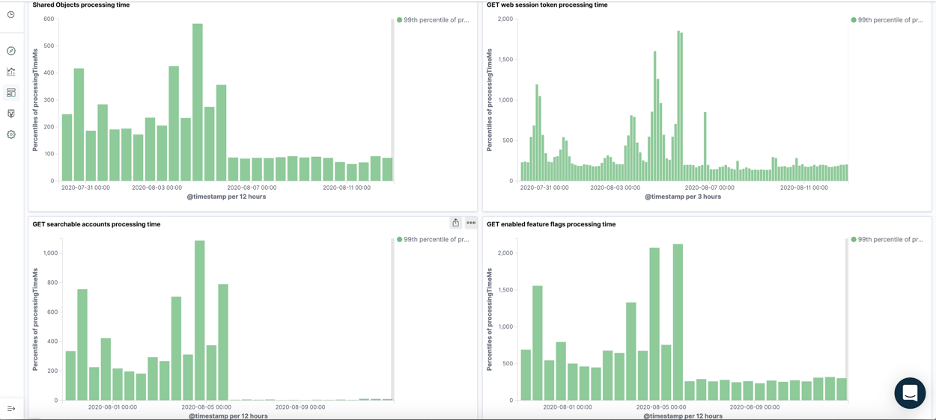
    We use a custom field processingTime (the amount of time it takes for a backend endpoint to be processed) in our access logs and then visualize it over time in Kibana. That better picture can identify suspicious endpoints that take more time than anticipated in peak times. We can see below an example of an endpoint that consistently takes more time (ms) during the 2-7 p.m. window.

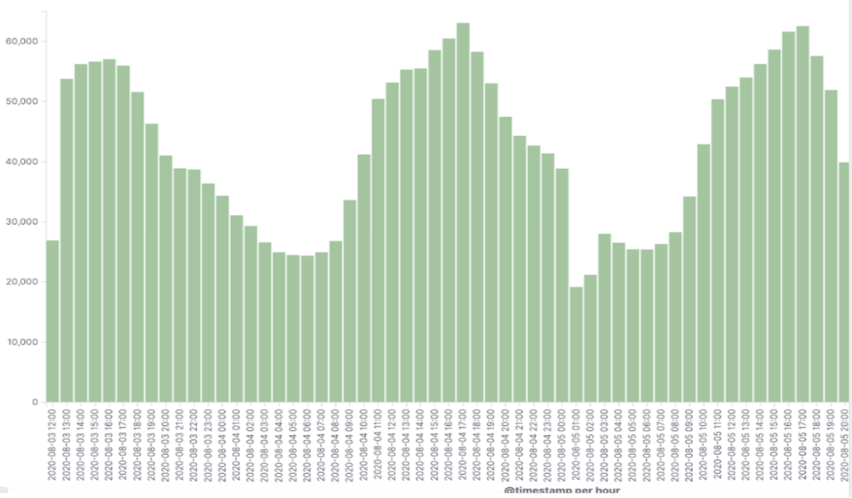
    In addition to the processing time each suspicious request took, we saw growth in the number of requests to the microservice handling our user session tokens. Likewise, we noticed a very high load of requests during those same peak hours.

    Metrics

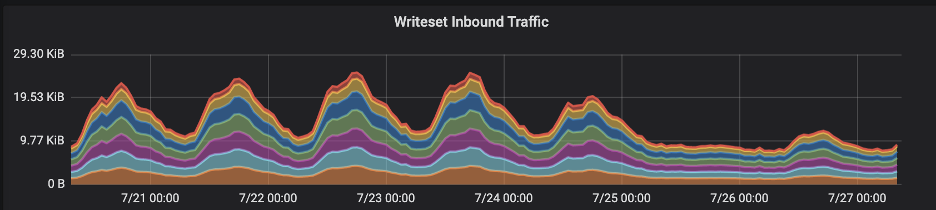
    Our metrics product is built on top of open source grafana. In our backend infrastructure dashboards, we found consistent spikes in transaction commit size written into our distributed database (Galera). Those spikes correlated with the same peak times above between Monday and Thursday. Apparently, this might look pretty valid because these are our customers’ rush hours, but we’ll see later why it made us suspicious.

    Additionally, we faced significant replication latency in our database cluster during the same period:

    Distributed Tracing

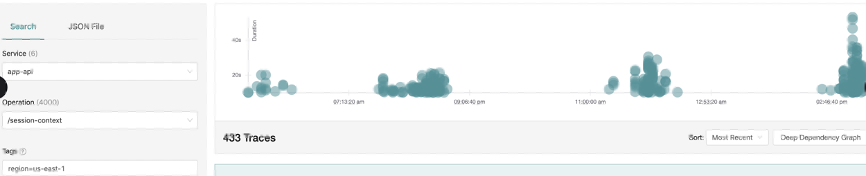
    Last but not least, our tracing product is built on top of open source Jaeger. We checked for patterns of high latency by filtering out requests that took less than 5 seconds. Again, slow requests popped up more during peak hours.

    Each type of representation of data has its own benefits, so with using Logz.io it was very easy to correlate all data and navigate between them to find the performance bottlenecks.

    One of the must-have features to correlate logs, metrics, and traces is using the trace-id common tag. Alternatively, in lieu of it, another common tag such as request-id matches these requests throughout all of our microservices together.

    Performance Investigation Deep Dive With Jaeger

    As we already discussed, our goal was to find what made our application slower than usual during peak hours. We needed to trace our application flow to find out where the performance bottlenecks were. More importantly, we can track how we got there, i.e., find the request flows that led us to the suspiciously slow span. As modern microservice-based applications boom, it gets more difficult to trace things manually, by adding dedicated logs of before and after any needed code block. Moreover, it makes the code cluttered and unclear with unwanted log lines.

    In our case, Jaeger made our life much easier. Especially for a new developer in the company who was not fully familiar with all of the involved components, it was easier to understand the business flow by identifying long-running spans before changing any code (which takes much more time).

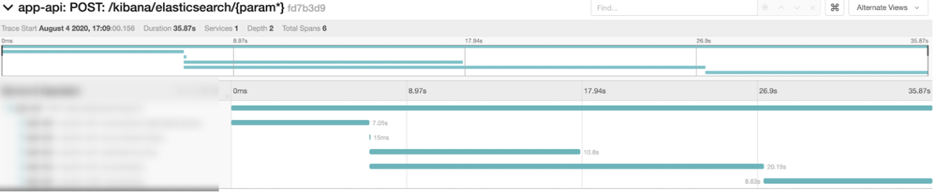
    So, if we could point to the exact places in our code where performance bottlenecks, it would be super easy to fix it in no time. However, our case was a bit different. Virtually every endpoint in the back end was suffering at peak times while firing a search request:

    Peak hours trace

    Normally with slow search queries the suspicion falls on the database, in this case Elasticsearch. So, we correlated the above span from the POST /services/query request with our logs and realized that the actual Elasticsearch query only took 15ms! So, we were able to rule that out.

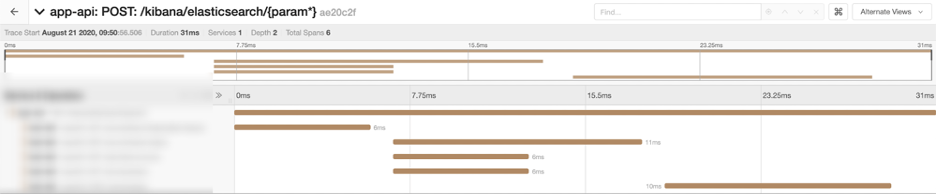
    It’s important to emphasize that in non-peak hours, these microservices take 10 milliseconds at most:
    Off-hours trace

    As we can see, that looks way different from the example we showed before! So, why does it behave so dramatically worse in rush hours?

    The Root of Performance Issues: We Found It!

    We encountered pretty much the same slow pattern in all related endpoints when performing search requests. As a result, we were pretty confident that the root cause for all of it had to be in one of our core cache components. In other words, too many requests were delivered to our internal microservice (which serves the user session token object from the database) instead of getting it directly from the cache.

    This hypothesis also fits the scenario above since more active users implies more SELECT and UPDATE queries for each user session token at precisely the same time we saw latency peaks in our graphs.

    From there, finding the best solution was pretty straightforward and the fix took us just two lines of code! It was a matter of changing the configuration of our session token cache eviction policy.

    Boommmm

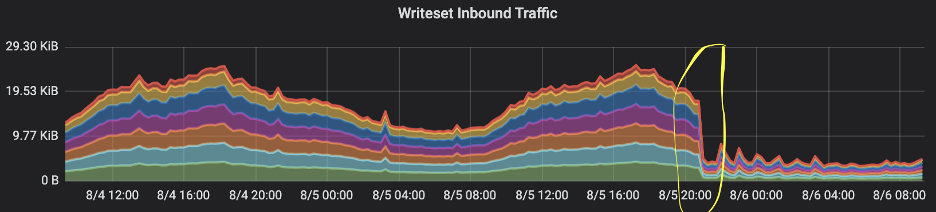
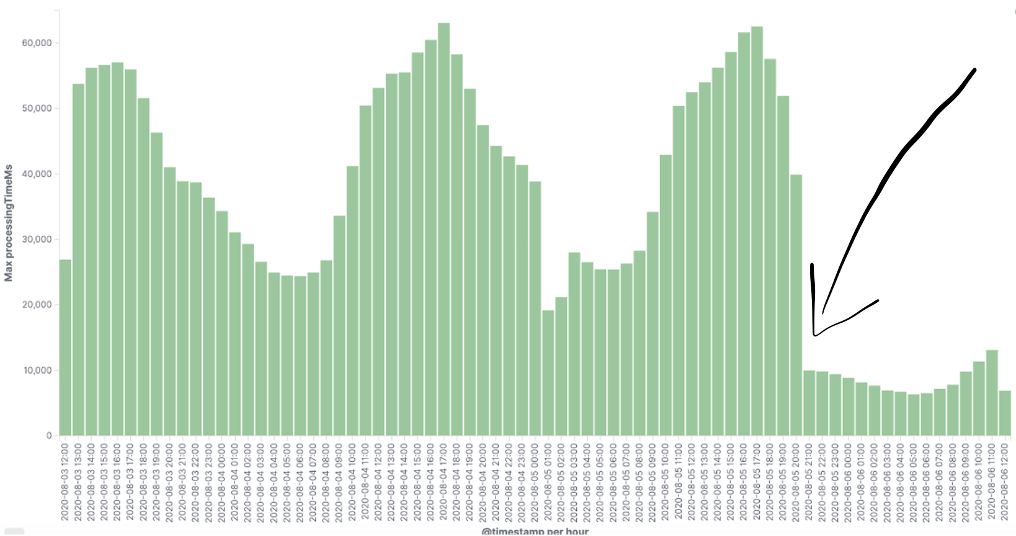
    The most exciting part of these kinds of fixes is to see how all the graphs change immediately. The writes and reads traffic to and from the database, plus the high latency in many requests, dropped as soon as we pushed the fix live to production. The impact was absolutely clear in our application dashboards:

    We could see the total size of transaction commits dropped right after the deployment.

    Also, we saw the total number of requests to the problematic service cut off by more than 80%!

    And most importantly, as soon as we deployed the fix, the latency dropped across all the impacted endpoints:


    For the coup de grace, we were waiting to hear from our customers any positive feedback. And we didn’t have to wait long—we immediately received high marks.

    Summary

    We still have a long way to fully instrument our system, but even with what we did so far we see that the efforts have paid off. We got a really cool and meaningful view of our system, which makes us better understand our business flows and, more importantly in our case, to quickly identify any bottlenecks.

    We already learned from our ongoing tracing adoption journey a few tips worth sharing:

    • Correlation between spans and logs is a must-have. The best practice for doing it is with a unique identifier such as trace-id or in case it’s missing with request-id. It brings a lot of value when you better want to examine a full request end to end by one click, which moves you to the respected logs page and vice versa. With Logz.io, you will get the log-trace correlation out of the box, which simplified things for us.
    • If your application is multi-tenant and you want a better view of traces of a specific customer, I’d recommend adding custom tags like customerId or userId.
    • If you want more finely tuned traces, consider adding custom spans for important pieces of application logic. Don’t just wrap every endpoint, which is the easy thing to do. If we suspect, for example, a slow query in the database, we can easily add in code for a custom span that will measure just this section and then it’ll be visualized under the parent transaction span, so we can see how much time it takes comparing the other spans.

    Having Logz.io made our journey much smoother—having logs, metrics and traces in one consolidated platform without the need to install and maintain it ourselves and with built-in correlations.

  • How Logs Can Empower Your CI/CD Delivery Pipeline

    How Logs Can Empower Your CI/CD Delivery Pipeline

    Change is the currency of software success. This need to change and grow is the basis for continuous integration and continuous delivery (CI/CD). Each year, new industries embrace this philosophy of constant change, but without the necessary data underpinning their decisions, every deployment is a risk. When you enrich your software delivery with log data coupled with best practice log management, you mitigate this risk and enable rapid, safe change in your organization.

    Logs are often the most common source of information about an application’s behavior. They provide context as well as result, opening up far more information than a simple count metric will. Despite the immense insight that they can offer, organizations regularly overlook them. Many leave their logs in files on servers, far away from the CI/CD pipeline that needs them. It doesn’t have to be this way; with some best practices, every part of your business can collect, analyze and utilize the hidden knowledge within your logs.

    Add Life to Log Data With JSON

    Logging in an unstructured format dramatically increases the complexity of detecting patterns in your logs. By logging your application output in JSON, you open up the possibility of analysis of all of your logs. This gives you a top-down view of your entire system while still maintaining readability. This empowers your CI/CD pipeline by allowing you to query and filter your logs, which then enables you to focus in on the problem and precisely diagnose any unwanted side effects of your latest change.

    Create Actionable Alerts

    If alerts are defined and channeled correctly, have context and can be interpreted easily, they will be actionable, add context and offer greater value. It is difficult to provide context when a single metric exceeds a threshold, but log lines are more sophisticated. They can include additional information to provide context and allow us to pinpoint the source of the issue fast. This is an essential capability for a company embracing CI/CD.

    Prioritize Your Logs

    Structured logs often come attached with a severity, which indicates how seriously we should investigate an event. An INFO level log signals business as usual, but an ERROR demands immediate attention. Once your logs have these tags, you can make intelligent, automated decisions that will automatically respond to unwanted changes in your system.

    Benchmark Each Version to Understand ‘Normal’

    “Normal” is a complicated idea when working in a microservices architecture. It may be safe to ignore a minor slowdown of a single service, but an unfortunate combination of events can lead to disaster. Benchmarking enables us to see these disasters well before our users. Benchmarking is the act of recording what the normal behavior of an application is. After each deployment from your CI/CD pipeline, compare your new behavior with your previous benchmark. If something is out of the ordinary, logs provide the information you need to act decisively. They provide an outstanding baseline signal for your benchmark.

    Analyzed Logs Can Level up Your CI/CD Pipeline

    Building a CI/CD pipeline is not the most difficult part. Neither is the deployment of new features. In fact, the greatest challenge facing any organization wanting to deliver their changes via a CI/CD pipeline is observability. With a best-practice approach to the preparation, curation and analysis of application and system logs, we can overcome this challenge and confidently change at a pace that propels us to the forefront of our market.

  • Why DevOps are Keen on Open Source Logging

    Why DevOps are Keen on Open Source Logging

    With the advent of DevOps, we are now moving toward more collaborative workflow models, where the integration of development and operations teams make it easier to quickly move development projects into production, and with fewer roadblocks. However, within DevOps, many of our activities are not as clear-cut as they were in previous siloed methods. While previous methods made it easier to keep track of activities and processes, these systems were not particularly efficient.

    In the DevOps model, moving software from development to production is much faster. But, we need to be able to identify actions that occur in our increasingly complicated applications. We now have many chefs working at the same time, and visibility suffers.

    Logging helps us better understand applications throughout each stage in the process so that we can identify problems or larger issues that might arise already during the development process. This is particularly true within CI/CD environments where items are regularly pushed into production. We need methods for identifying not only if there are critical errors, but also the ability to attribute the errors to specific versions throughout the cycle.

    To deal with the increasing complexity and decreasing visibility, DevOps identifies complex issues using logs to keep track of services, APIs, containers, infrastructure issues, network activity and also security related logs.

    Log files provide a tremendous amount of useful information about what goes on beyond the CI/CD pipeline and also identify issues that directly impact customers. Good log analysis tools make it possible for DevOps teams to get much closer to the end user. And open source is the preferred starting point for many organizations.

    Why Open Source?

    Lack of Lock-in 

    Many DevOps teams make use of a wide-range of tools and find that they can work much better without vendor lock-in, which can be caused when using proprietary stacks exclusively. This makes it far easier to make any needed changes as the need arises, and not be reliant on individual vendors. This also helps avoid many risks, such as vendors disappearing, ending support, changing pricing models, etc.

    Widely Used

    Within CI/CD, there are many commonly used open source tools, which makes it easier for new members to be on-boarded. There is already a widely accepted suite of tools that almost all DevOps teams use. It’s hard to imagine working without Jenkins, Docker, Kubernetes, Git, etc.

    Regular Skill Development

    Open source work ensures that DevOps teams are actively learning and directly interacting with software and systems. It becomes a way of ensuring that skills and abilities of teams are continually staying updated. This can translate into better troubleshooting and problem solving skills. When working with closed systems, there’s considerably less opportunity for knowledge advancement, as closed systems tend to encourage rote work with existing software rather than skill development.

    Quality

    Fears about subpar open source software are largely unfounded, particularly if the projects are widely used and have a large community. There are far more developers working on a project in the open source community than in proprietary systems. Closed systems can lag behind, and there may actually be bad code but that is hidden due to its closed-source nature. The ability to make modifications to create functionality beyond that which already exists in closed source systems, makes open source extremely appealing for many DevOps personnel.

    Some Drawbacks

    It’s important to note there are a few drawbacks when attempting to work entirely within open source environments. Many resources used are not open by nature–for example leading clouds are decidedly not open source in nature. Individual users (outside these companies) have much less control over how they actually operate. However, if we look at the toolkits that we described above, we can think of open source tools as needed resources for working in and around these environments.

    Another drawback to consider is the actual costs of managing open source software versus a fully-managed service such as Coralogix, for example. Many times, teams will start with the self-managed approach and move to a managed service when faced with scaling and complexity issues as the organization grows. 

    Types of Features to Look for in Open Source Logging Models

    When setting up to work with open source logging tools, it’s important to understand there is a range of different types of models available, which can work better or worse depending upon needs and capacities.

    • OpenAPI: provides a useful interface into many different systems. It is language agnostic and can generate clear documentation of methods, parameters and models. In most cases it will work within RESTful interfaces, but will also work with other protocols such as SOAP.
    • Open Standards: Even if a tool is not open source, typically these should follow a set of standards to make sure that different pieces can talk to each other. OpenAPI is one example, but not the only one.
    • Federated Model: This is a broader type of open source model which is like many default open tools, but allows a much wider set of input and may allow individual users to provide input and maintain some control over local development areas. This means that aggregation, processing and control remain local. However there’s still a central organization which will be able to collect summarized or complete code. The advantage of a federated model is it increases flexibility for individual teams, while still contributing largely to the project as a whole. 

    Elasticsearch, Logstash, Kibana (ELK)

    One of the most popular open source logging stacks is known as ELK. It is particularly powerful and effective for the purposes of those wishing to create a clear aggregation and understanding of their log files, with the ability to find both problems and solutions quickly. 

    ELK is a combination of three tools.

    • Elasticsearch: a popular NoSQL Lucene search engine.
    • Logstash: a pipeline system which will take data from logs, ingest it and transform it into a data store (such as Elasticsearch), so that it can be searched and analyzed.
    • Kibana: a tool which makes it possible to create clear visualizations for Elasticsearch to appear in a human-readable format. 

    What ELK provides is a single place for all of your data, where it can be stored, searched and analyzed in a method. It is useful for DevOps teams wishing to make use of the vast amounts of data stored in log files. 

    Upfront expenses for open source tools like ELK are minimal; the software itself is free. However, this does come with a caveat. Professional management of ELK tools is required, otherwise costs can grow quickly out of control. 

    Generally, for low volumes of data, one can manage ELK for as little as a few hundred dollars a month on a platform such as AWS. However, without careful management, the cost can grow exponentially for large amounts of data.   

    Work required for ELK involves:

    • Setup, which may take some time but that’s typically not a problem for many ops teams—and is a project many will enjoy.
    • Maintenance of elastic search clusters can be quite a bit of work—several hours per week simply solving issues or resolving downtime. This can vary based on the size and growth of clusters. The more activity you have occurring, the more time you will need to spend maintaining your logs.

    FluentD

    FluentD is an open source alternative to Logstash which can collect, parse and transform data for further analysis. It has features which may be particularly helpful if you are running your logs in a Kubernetes environment.

    One of the drawbacks of Logstash is that it is written in JRuby, which means it requires a Java runtime for each implementation. If you are running many different microservices in Kubernetes, this can result in a large amount of your memory being taken up.

    Because FluentD is developed in CRuby, it doesn’t require as much memory to use with each new pod creation. This can help solve some memory allocation issues which could cause your logs to slow down your applications.

    FluentD also has a wide range of plugins, which can cover pretty much any use case that you come up with. Another advantage is that its tag-based routing makes it slightly easier for developers to work with than Logstash. 

    What to Log?

    With continuous integration, there are many things that merit monitoring. These can include everything from checking the frequency of merge conflicts in Git, or whether pulls are preceded by pushes prior to any other pulls.

    Are you receiving a high number of compiler warnings? You can identify code that has a strong likelihood of breaking builds, change your unit testing procedures and implement better automated checking in Jenkins.

    Much of this data is worth visualizing in Kibana for analysis. Deciding what specific activities to log can be a bit involved. Areas that are a good idea to log include:

    • Diagnostics: For example, understanding the causes of repeated errors.
    • Auditing: Track how well errors in code have been fixed, and whether they succeed or fail a second time.
    • Profiling: For example, get an idea of how long it takes for certain parts of code to execute, for the purpose of identifying whether this has any impact on customer experience, and identify areas for improvement.
    • Statistics: Code performance, such as execution time or memory consumption.

    Conclusion

    Gaining complete visibility or your infrastructure will go a long way to make sure that your operation runs smoothly and that your CI/CD pipelines function at optimum efficiency. Open source tools remain an attractive option for DevOps because of its advantages and knowing how to get around drawbacks.

    Finding the right tools is, of course, only the first step, but if you’ve picked good architectures and have implemented them properly, you are already moving in the right direction to a more streamlined operation.

  • 5 Best Practices for Feature Flagging

    5 Best Practices for Feature Flagging

    Feature flags, also known as the feature toggles, are important concepts in the field of DevOps. They have been around for a long time and have been used continually by developers for their convenience. As software development services providers are striving for higher agility, practices such as feature flagging are becoming increasingly relevant. If you are not familiar with the concept of a feature flag, let’s start with understanding what feature flagging is.

    What is Feature Flagging?

    Feature flags are used for the process of branching your code, which means to turn certain code paths on and off to separate the release of new features from the actual deployment of our code. Why do DevOps developers want to branch their code through feature flags? Well, feature flagging is a great software development practice for two reasons. Firstly, for features that are a work-in-progress, developers can use a feature flag to hold their release until they are ready. This ensures the release of other features that are ready is not delayed just because one feature is not. Secondly, features that are being worked on can be kept off using the feature flag and only once it is ready it can be turned on. This allows developers to work directly on the feature without changing the main code, also known as the trunk or master branch. When all is working and ready to be released, turning on the feature toggle releases the feature, just like a switch.

    To understand feature flags in the simplest term, feature flags are “if/else” statements to develop a conditional branch or pathway into your code. For example, you can use a feature flag to state that “if so and so feature is enabled, run new algorithm; or else, run old algorithm.” This allows developers to control the functionality—if the feature flag is enabled only then the new algorithm is executed; else skipped. This is the most basic form of feature flags, however, they could be more complex.

    Feature flags are a practical way for software teams to maintain the delivery and release of features, and there are many advantages of using them. However, too many feature flags can make your code more complex and difficult to manage.

    Here are the best practices of feature flagging that can save your project from becoming a feature flag hell.

    More Feature Flags Equals Complex Code

    Feature flagging is a good practice that can help you maintain the delivery and release of different features, however, using too many feature flags can quickly turn your code into a feature flag hell. The more feature flags you create, the more code paths are going to be created, this increases the complexity of your code and makes the testing process harder. A higher number of code paths can cause a mess and risk the functionality of your code. Therefore, it is best to only create feature flags when it makes sense and always check if a previously created feature flag can be re-used instead.

    Name Your Feature Flags

    For efficient management of feature flags, it is crucial to have a proper flag naming system. Without it, it is possible to confuse the flags, forget why they were created for, or create flags with the same name—all of which can cause disruptions and confusion. When working with a team of developers, it is important to ensure that everyone follows the same labeling method so they can get the information about the flag just by looking at the name. Otherwise, it is likely that a team member might mistakenly trigger the flags, upsetting your code.

    Log and Clean Up Old Flags

    Over time, it can become difficult to keep track of the changes that are made to a feature flag. Therefore, it is important to track changes through logging, especially when working in teams. Using logging, you can keep a track of who created the feature flag, who made a change and at what time. This can save you from wasting time figuring out who was responsible for what change. A log will set the record straight about every change introduced for every feature flag.

    This is also great to know which flag and code paths are obsolete and redundant now. When you know which flags are unused you can clean them from your code to avoid any conflict or confusion.

    Use a Feature Flag Management Tool

    For better management, control and visibility of your feature flags, you can use available feature flag management tools. Like every other management tool, feature flag management tools are enterprise-scale software to manage feature flags. Some of the most popular tools include LaunchDarkly, Rollout and Bullet Train. Tools like these can make the management of feature flags easier for you and increase your development speed.

    Use Feature Flags to Collect Data

    When it comes to scaling your product, feature flags can be of great help to collect data from users. For instance, if you want to introduce a new feature, you can roll out the change slowly to a few users first. Using feature flags, you can make the new feature or update available to a smaller set of users only and collect data about how well they respond to the release. You can then use their feedback to improve or change your features to deliver an improved user experience. Feature flags are used in this manner by companies such as Facebook and Netflix to test their new features before releasing them for the entire user base.

    — Emily Williamson