Tag: log management

  • Era Software Adds SaaS Edition of Log Management Platform

    Era Software Adds SaaS Edition of Log Management Platform

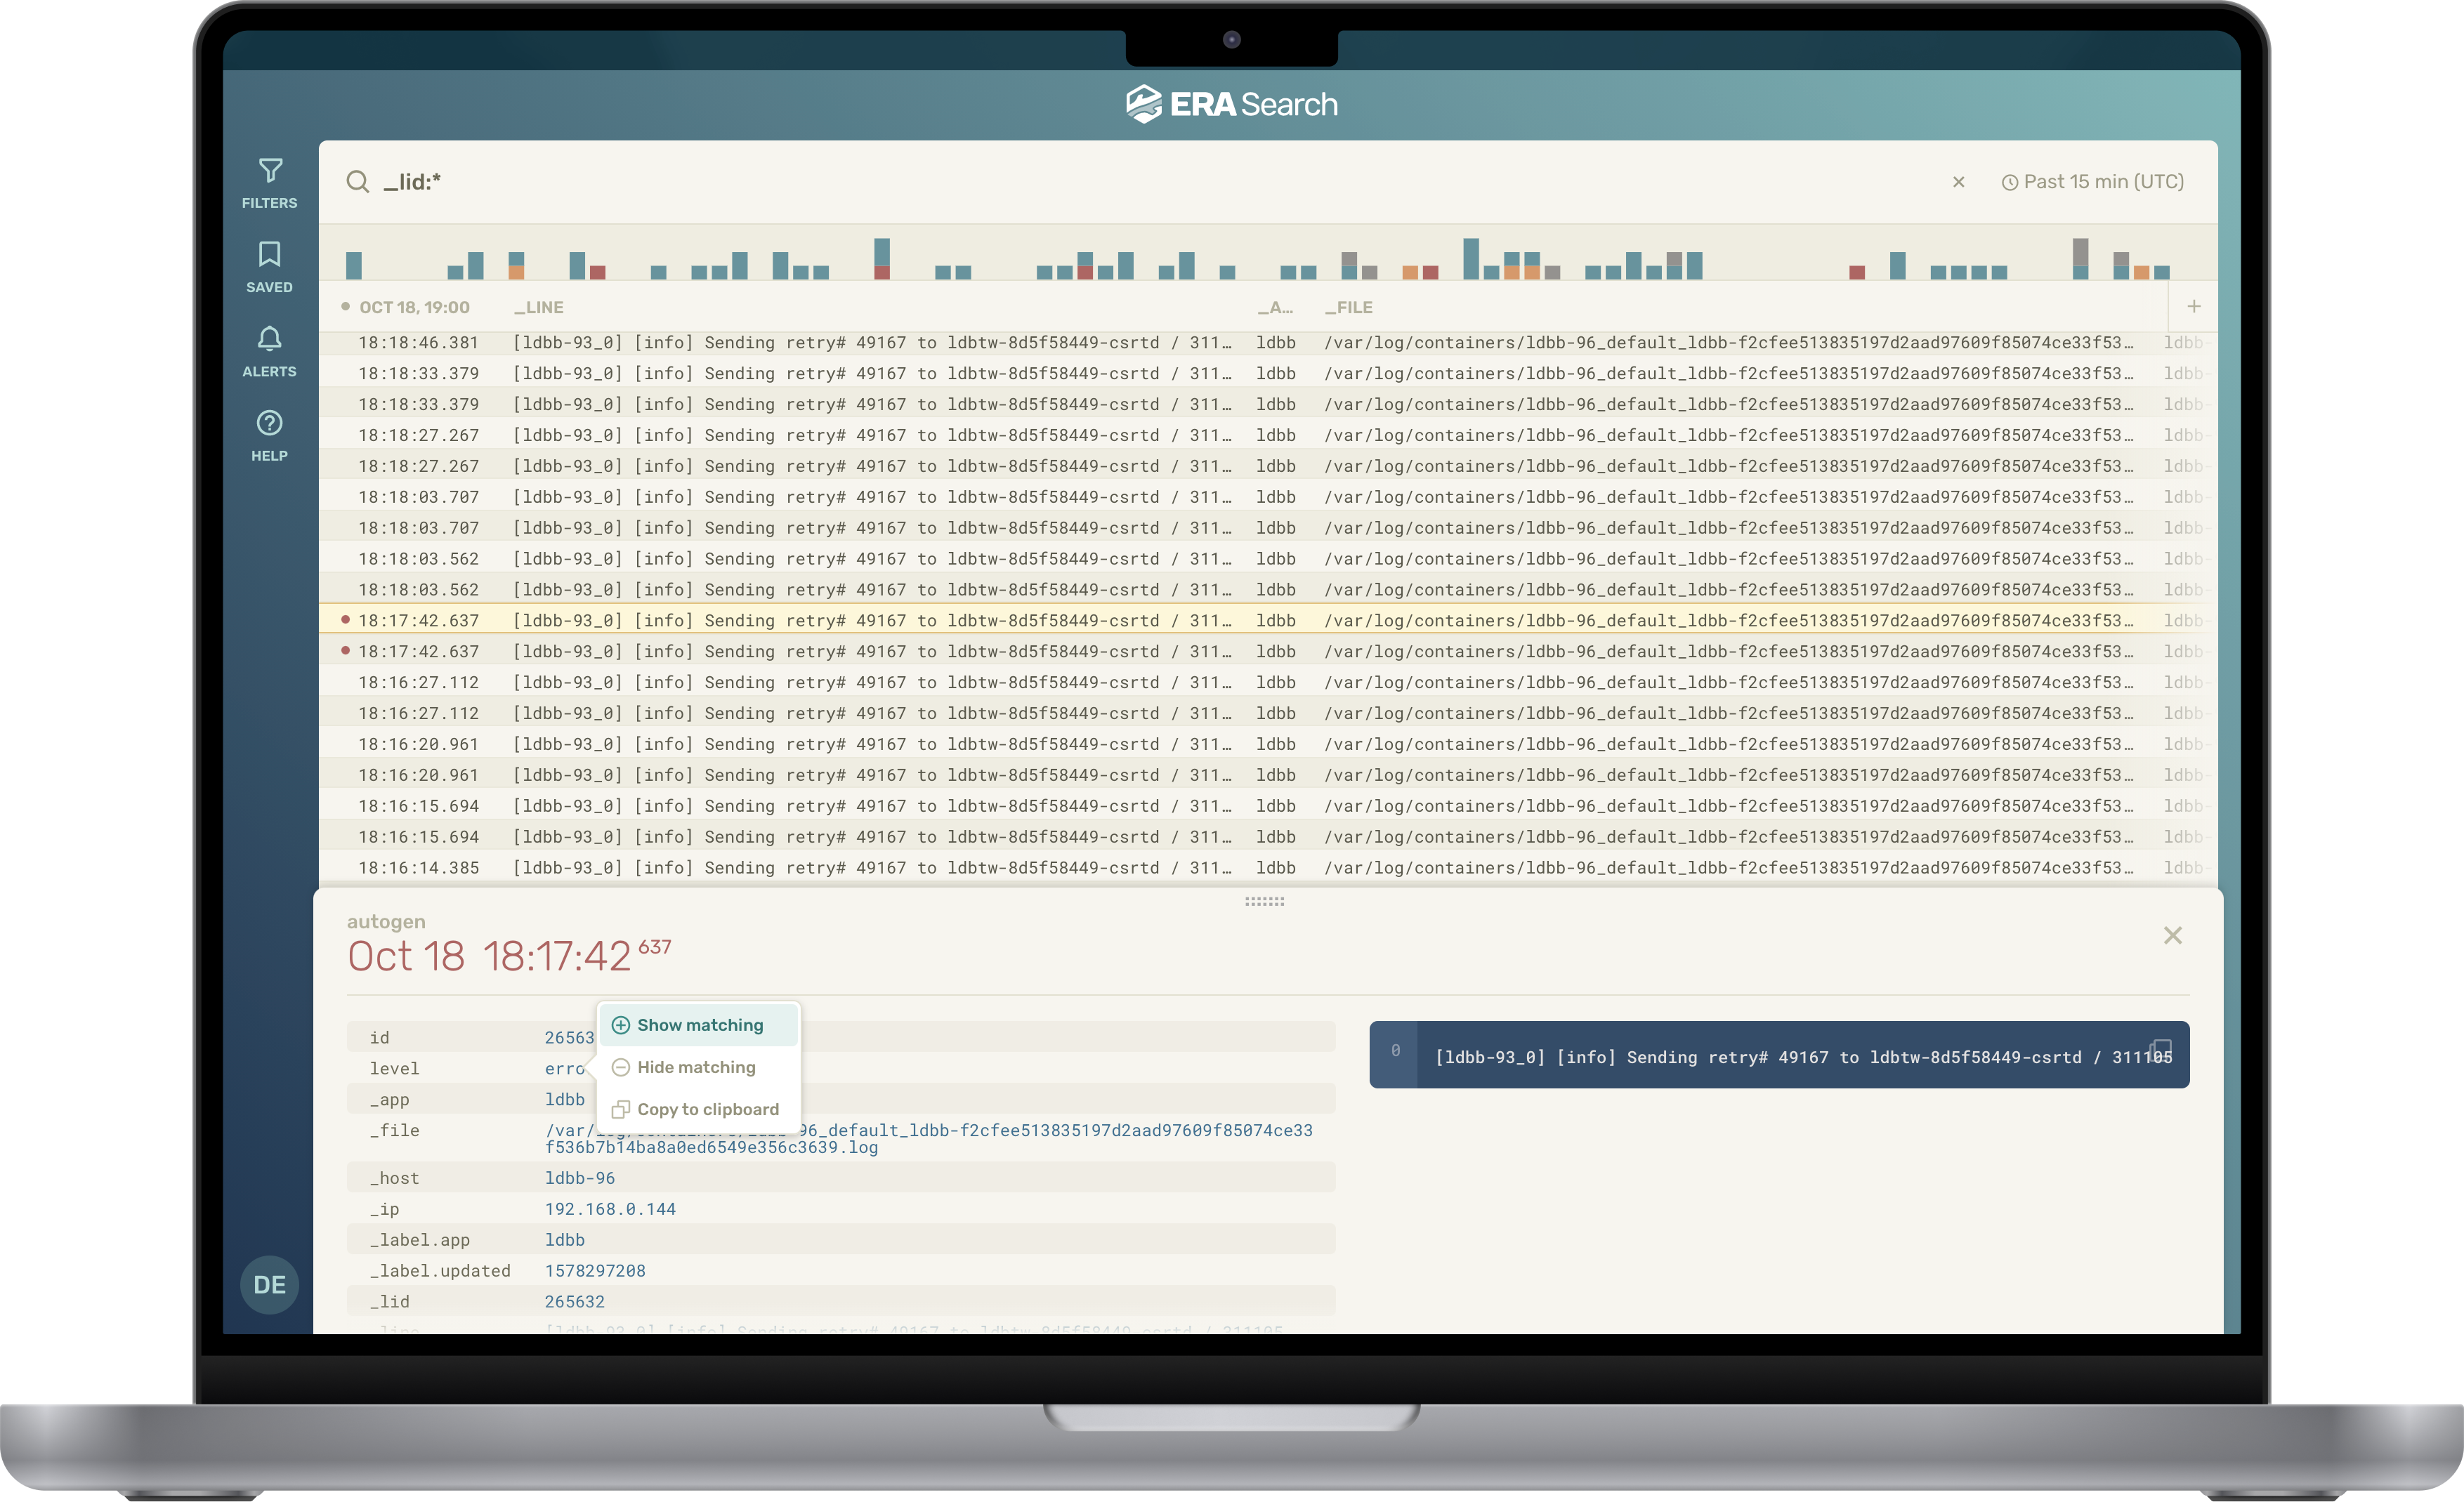
    Era Software has unfurled a software-as-a-service (SaaS) edition of its platform for collecting and managing log data that is based on a time-series database it built.

    At the same time, the company has revamped the user interface of the underlying EraSearch log management platform that IT teams can deploy themselves to make it simpler to troubleshoot IT issues.

    Stela Udovicic, senior vice president of marketing for Era Software, said the EraCloud edition of the log management platform provides a more accessible way to access a log management platform based on an object storage system that can handle any type of log data.

    There’s also an indexing engine based on machine learning algorithms that enables the platform to scale better than rival platforms, she noted.

    Available via the Amazon Web Services (AWS) marketplace, EraCloud collects, indexes and analyzes log data from cloud applications, Kubernetes and IT infrastructure platforms to provide a centralized means of collecting data at a lower cost. In addition to being able to continuously monitor billing costs, an EraSearch cluster can now be provisioned in minutes.

    Era Software, previously known as EraDB, earlier this year raised an additional $15.25 million in financing to drive development of a log management platform that provides an alternative to open source platforms, such as Elasticsearch, that don’t scale as well. The result is a higher total cost as the volume of log data that is less efficiently managed via Elasticsearch steadily compounds. As part of that effort, the company also supports a subset of the Elasticsearch application programming interface (API) to facilitate transitioning from Elasticsearch.

    Many organizations today already have terabytes of log data they are trying to manage and store, noted Udovicic.

    It’s not quite clear how many IT organizations are considering alternatives to log management platforms. However, as the amount of log data that IT teams want to be able to store over a longer amount of time increases—in part to facilitate greater observability—the pressure to contain the cost of retaining all the data is also rising.

    Observability, in general, requires combing logs, metrics and traces—a specialized form of logging—in a way that makes it easier to identify the root cause of an issue by querying data. It differs from monitoring in that observability is achieved using a predefined set of metrics that track whether a platform or application is performing within expectations.

    It may be a while before most IT teams generally achieve observability, but the journey typically starts with finding a more efficient way to collect log data in both proprietary and open source formats. Rather than having to normalize all that data, Era Software is making a case for analyzing that data in whatever format it happens to be available.

    One way or another, a much larger percentage of the applications deployed by IT teams in production environments will have to be instrumented to achieve observability. The issue now is determining how best to make all the data collected from those applications available to DevOps teams at a reasonable cost.

  • LogDNA Adds Usage Quota Tools to Help Control Costs

    LogDNA Adds Usage Quota Tools to Help Control Costs

    LogDNA announced today it will enable IT teams to apply usage quotas to help rein in log management costs.

    Tucker Callaway, CEO, LogDNA, said as applications become more complex – thanks, in part, to the rise of microservices – the amount of log data that a DevOps team can collect has significantly increased. IT teams can now assign DevOps teams both hard and soft quotas to limit the amount of log data collected during a specific time period, Callaway said.

    IT teams can set a daily or monthly hard limit on the volume of logs stored or, alternatively, they can also set soft daily or monthly quotas that can apply throttling logic to ensure mission-critical log data will continue flowing through LogDNA as usage volume approaches the limit threshold. It will then be up to each IT team to determine, based on the tasks at hand, whether to enable a DevOps team to exceed those thresholds, Callaway said.

    IT teams can also make use of soft limits to reallocate storage resources from one DevOps teams to another based on how much log data might be generated in a specific time period, Callaway noted.

    LogDNA will notify team members any time a quota is hit, or when an exclusion rule is triggered because a quota has been reached. Those alerts can also be integrated with email systems or the Slack messaging platform. Logs that are not retained are not counted toward the monthly bill, but are displayed and will trigger other relevant alerts.

    In the wake of the economic downturn brought on by the COVID-19 pandemic, IT organizations are, generally, more sensitive to costs. At the same time, many of them are encouraging developers to assume more responsibility for application life cycle management as they embrace DevOps best practices. The usage quotas are intended to enable IT teams to strike a better balance between what can be two competing agendas, Callaway said. IT leaders are not necessarily trying to discourage DevOps teams from collecting log data as much as they are trying to make sure costs are predictable, Callaway added.

    Log data, of course, is one of the core elements of any observability strategy. While observability has always been a core DevOps principle, the number of organizations that have been able to meaningfully achieve it has been limited. However, as organizations start to deploy microservices with multiple dependencies, the need to provide context when troubleshooting those applications has become more acute.

    It’s not clear to what degree more granular control over log data might sway an IT organization toward one platform versus another. However, when it comes time to justify a choice to senior IT and business leaders, it’s always a good idea to address, at some point, how one decision versus another might have a more positive impact on the bottom line.

  • LogDNA Extends Log Management Reach

    LogDNA Extends Log Management Reach

    LogDNA has extended the reach of its log management platform to add support for a Node.js platform from Vercel and a feature flagging tool from LaunchDarkly.

    In addition, LogDNA has expanded an existing alliance to IBM to add support for instance of Red Hat OpenShift running on VMware platforms hosted on the IBM Cloud, which enables IT teams to centralize log management using LogDNA and IBM Log Analysis.

    Chris Nguyen, chief strategy officer for LogDNA, said the goal is to continue to establish partnerships that will enable DevOps teams to manage larger swaths of the IT environment via a single pane of glass.

    Vercel has been gaining  traction as a provider of an open source reactive programming framework that is being employed to build more interactive front ends for web and mobile applications.

    LaunchDarkly is a feature management platform that serves more than 6 trillion feature flags a day spanning 14 million mobile devices and 3 million servers. The integration between LogDNA and LaunchDarkly enables developers to rapidly iterate on feature flags using logging data surfaced by LogDNA.

    Nguyen said that as IT environments continue to become more complex, more organizations are relying on log analytics to reduce the noise level being created by all the tools and platforms that make up a modern IT environment. The challenge IT organizations face is most of them can’t find or retain a site reliability engineer (SRE), so they need tools that enable developers to make better-informed decisions.

    LogDNA is making the case for a log management platform deployable in the cloud or on-premises, designed for DevOps teams as an alternative to existing log management platforms that were designed for IT administrators who rely on graphical tools. LogDNA instead provides developers access to log analytics that are accessed via command-line interface (CLI) or a user interface.

    It’s not clear whether or how much IT organizations may be willing to replace legacy log management platforms. However, as more organizations embrace best DevOps practices that include observability as a core tenet, LogDNA is betting those organizations will prefer an approach to log management aimed at developers rather than IT operations staff.

    As DevOps teams assume more responsibility for the management of IT on an end-to-end basis, a seismic shift in IT tooling is underway. Providers of legacy IT tools are quickly shifting toward making APIs and CLIs available in response to a range of startups that are making available tools designed from the ground up to appeal more to DevOps teams. It’s too early to say how this battle for control over observability will play out, but the number of providers of tools for DevOps teams has never been greater.

    In the meantime, many DevOps teams are still sorting out when best to employ log analytics, metrics and distributed tracing to optimize IT environments. The challenge these days isn’t so much being able to discover what’s occurring in an IT environment as much as it is making sense of it all.

  • How Centralized Log Management Can Save Your Company

    How Centralized Log Management Can Save Your Company

    Through centralized log management, organizations can consolidate all log data into one central, data highway and directs logs wherever they need to go

    The digital transformation wasn’t gradual. It came crashing into industries worldwide in response to safety restrictions around the pandemic.

    Nearly a third of Americans are working remotely in light of the pandemic—drastically increasing the external users—with no signs that employees will be returning to the office full-time post-COVID-19. A recent PwC survey found that 83% of employees want to work remotely at least once a week and that 55% of employers anticipate their employees will do so even after the pandemic.

    Companies have implemented new and creative solutions to deal with the spike in remote access: VPNs and SSL connections through web applications, to name a few. However, many of these solutions were only a bandage that won’t suffice for long term remote access.

    There is one thing amid all these changes that can become an increasingly large problem if left unaddressed: logs. Logs are collections of data that continue to be collected whether users are in the office or in their living room. Without centralized log management, this data can put organizations at a critical security risk. As the digital transformation takes industries by storm, it’s important for organizations to remember the importance of managing logs.

    Today’s Log Landscape

    When a company’s remote workforce jumps from 50 to 5,000 in a matter of weeks, things change. Compared to in the office, logs at these companies have jumped by 10,000%. Remote work generates logs on security access points, remote access, server logs, terminal services and application logging—all of which are fed into an organization’s security information and event management solution (SIEM).

    This jump is creating and revealing more blind spots to companies, which proves how difficult it is for administrators to increase the rates for their security monitoring tools to reach that level without drastically upping their company’s budget for its SIEM. Even Microsoft and network providers are running into issues with so many changes happening at the same time. Additionally, companies have to worry about privacy laws, making sure all personal data is encrypted and secured.

    Centralized Log Management

    Organizations should implement centralized log management (CLM) to consolidate all log data into one central, data highway that collects all logs and directs them wherever they need to go. CLM solutions reduce SIEM costs once SIEMs are no longer effective log management tools.

    Dropping all logs into a SIEM spikes costs, so oftentimes only a portion is collected, which creates fragmented or incomplete pictures and impacts security monitoring and incident response. CLMs lift the burden of having to hire staff, provide training and support for SIEMs. CLMs also reduce the costs organizations would incur with their SIEM providers, as well as the risk of endangering the SIEM infrastructure by storing unmanaged logs.

    Fragmented data collection can become a unified data collection with a data highway. Organizations can now filter unruly data and deliver only what you need. This helps overcome the age-old strategy of letting separate teams have their own sources of data, which could instead be directed to the appropriate team via your data highway. The data highway lets you collect once and use it many times, where it’s needed.

    Parsing: Cleaning up the Data

    Once logged, data needs to be parsed. To prime your data to be parsed for specific items, unnecessary and unwanted information must be filtered out. This diminishes the storage space logs take up and increases the usability of the data.

    One example of superfluous information is the timed mark that many applications add into the log of their system to show they are online. Unless a security auditor will need to see this, there is no reason why an organization should be paying to store it in their SIEM. Administrators are even able to filter out all extraneous text and add parsing for specific events. This quickly and easily reduces costs that are likely spiraling out of control during this time.

    Parsing, filtering, masking and other transformation techniques in your data highway allow security teams to overcome privacy issues and filter out personal information that shouldn’t be distributed. Resolving this problem could become crucial as more and more personal data is being collected than ever before, and as privacy laws are becoming stricter.

    The Data Highway

    Build your dream team to utilize your new data highway to its greatest potential. Not everyone reviewing logs will be SIEM experts or as skilled as a Linux or UNIX administrator (or even one at all). Build your team to be able to easily operate your new data highway, because you don’t want it to be gathering dust on the shelf.

    With your new data highway, you’ll be able to optimize your SIEM, increase your likelihood of meeting compliance requirements and be able to log from more places with easy searchability. With that encrypted data store, your compliance officer may even be able to sleep at night. Beyond the SIEM, you’ll be able to send your data anywhere: Kafka, MongoDB, any database, big data systems and more.  Don’t just optimize your SIEM; build your data highway and collect those logs once, distribute them where they need to go and cut costs with centralized log management.

    So, in this crush of new technologies spiraling into the new digital transformation age, don’t forget the importance of managing your logs. IT and security admins shouldn’t be in the position of going to company management to inform them of uncontrolled SIEM costs. They can be managed and reduced without losing their effectiveness by simply feeding to the SIEM only the data that needs to be there.

  • observIQ Lauches Open Source Log Agent Project

    observIQ Lauches Open Source Log Agent Project

    Blue Medora, after selling its core monitoring integration platform to VMware, today changed its name to observIQ and launched an open source agent project that will serve as the foundation of a log management tool to be delivered as a software-as-a-service (SaaS) application.

    Company CTO Mike Kelly said the observIQ agent, which is written in the Go programming language, will provide IT teams with access to highly configurable agent software that doesn’t adversely impact performance. In contrast, existing open source log agent software requires IT teams to sacrifice one for the other, he said.

    Because the observIQ agent is highly configurable, it will also serve to make it easier to collect a wide range of metrics that can be consumed by a wide variety of management tools, Kelly added.

    The company will employ observIQ to collect metrics for observIQ Cloud, a SaaS platform currently in beta, in addition to continuing to invest in BindPlane, an IT operations data management platform developed by Blue Medora that delivers a relationship-aware stream of metrics and logs in real-time.

    Kelly said IT teams need access to a highly configurable agent software because the types of metrics that need to be collected continue to expand and evolve.

    At the same time, Kelly notes IT teams need to be able to affordably instrument many more applications, which becomes difficult to achieve when relying on commercial agent software.

    Finally, as IT environments become more complex, organizations are embracing best DevOps practices to manage applications, which requires organizations to increase dramatically the level of observability they have into any application environment. The issue DevOps teams encounter is they wind up having to support multiple agents, so if an open source project leads to fewer agents that need to be maintained and updated, that might be a benefit that resonates.

    In the meantime, as log management heads into the cloud along with most other IT management services it’s also becoming easier for IT teams to manage applications from anywhere. Most IT teams are going to be working remotely much more often than they did prior to the onslaught of the COVID-19 pandemic. That transition is easier to achieve when the tools being relied on reside in the cloud.

    Many IT teams also tend to limit their use of log analytics because of the costs associated with storing and collecting data. To limit those costs many IT organizations opt to only store log data for a limited time or only collect metrics for their most critical applications. The challenge is, the percentage of applications deemed critical continues to increase.

    Of course, competition across providers of log management tools that can be accessed as a service is already fierce, so observIQ will have its work cut out establishing another platform. However, if DevOps teams adopt its open source agent software, there’s naturally a much higher chance organizations will wind up employing observIQ Cloud.

  • The Top 5 Challenges to Overcome with Heroku Logging

    The Top 5 Challenges to Overcome with Heroku Logging

    Heroku can be a very powerful tool for monitoring the massive amount of data generated by your applications, systems, APIs and add-ons.

    One thing you may have discovered with Heroku logging is that making sense of data within your log files can be time-consuming. When you’re running large numbers of applications which process tons of data each day, the sheer volume of data that appears in the logs can seem overwhelming.

    Managing Massive Log Output 

    Due to the sheer amount of data that is gathered, it’s important to find ways of making the process a little bit easier, limit information to what is useful and organize what you have into digestible pieces.

    Parsing with Drains

    Using Logplex and log drains can help you filter out large chunks of your logs. Syslog drains will help you move any system messages to another server for archiving purposes.  HTTPS drains can help you better take control of your system messaging for sending it to third-party apps for analysis. 

    By assigning clear indicators that identify the application, system or API that creates a log, these can be streamed into channels that can be better understood in relation to their given purposes. 

    Log Retention Period

    While we may think that more information is always good, there is a limit to the amount that we can process. Some log data becomes meaningless or redundant after a certain length of time. It is wise to set realistic log retention periods on data based on business needs.

    Limit Verbosity

    Don’t log everything. Turning on debugging is appropriate during development and if there is a specific problem that needs investigating, but in most cases, these shouldn’t be stored. 

    Complexity in Stream Patterns

    The challenge with large amounts of data is that there may be subtle differences between successful activity and erratic behavior. The details may be small, and essentially invisible to the naked eye unless examined carefully. 

    Use Regex for Identifying Patterns

    Through the use of log analytics tools, you can set these to pick up specified regex patterns to subtle changes or variations in your logs that can provide meaningful insights. 

    Different Log Data Needs

    You may have people with different needs who wish to make use of the information you gain in your Heroku logs. While you have data that is of interest to developers and QA engineers, there are other tech-savvy users who may wish to gain business intelligence (BI) from the massive output of data, to be able to identify key performance indicators (KPI).

    Analytics Tools

    Using intelligent add-on analytics applications can help by filtering and sorting information into usable chunks that can be understood by users in different roles. By accurately filtering, you can provide intelligent real-time alerts for a specific application or system behavior to those who may wish to make use of it. 

    Application Issue Forecasting

    One of the best potential uses of your detailed Heroku logs involves the opportunities to spot patterns of problems that have occurred in the past and use them to predict problems that may occur in the future.

    As an expert, you may be able to spot patterns in your logs, however, even the smartest and most attentive engineers will not be able to manually define every scenario worth detecting.

    Occasionally patterns will occur that are only detectable through the rote process of comparing and contrasting working behavior with non-working behavior. Often, the subtleties are too small for a human to be able to notice the difference.

    Machine Learning Assistance

    Naturally, utilizing ML-powered techniques can help catch the unknowns. By investing in ML, using some of the better libraries or choosing a Heroku logging add-on with these capabilities, you can monitor your applications and infrastructure with less effort. 

    Securing Sensitive Data

    With the rapid pace of CI/CD, a large amount of activity regularly flows through your pipelines from development into production. Throughout this process, it’s possible for sensitive data to start appearing in logs. While your teams may be diligent about keeping control over OAuth credentials, security keys, authentication tokens and more, nobody is perfect. Sensitive security credentials can accidentally make their way onto production servers. Sensitive customer data can also accidentally find its way into public logs if mistakes are made.

    Credential Detection and Security Alerts

    Logs can serve as a saving point for the identification of sensitive information. Using a parsing engine, these can be immediately redacted for compliant log management. By monitoring your log files for any patterns which could include secret keys or other potential security breaches, you’ll be able to continue ingesting critical log data without increasing business risk.

    Heroku Private Spaces

    With Heroku Enterprise, you can make use of Heroku Private Spaces which are an isolated network of private apps and data services, which will help you keep sensitive data separate from public interference. If you are handling a large amount of sensitive customer data, ensuring that any information gets filtered into these places will help you remain compliant with GDPR and other privacy-related regulations.   

    Conclusion

    Heroku can be a fantastic solution for monitoring the activity which goes on in your cloud clusters.  However, unless you have solid analytical tools in place, you may find yourself spending a lot of time wondering how to make use of this sea of data that has been collected. Consider using an add-on as an analytic layer to help spot patterns, organize data better and create smart alerts to make sure your operations continue to run smoothly.

  • Humio Adds Unlimited Ingest Plan to Log Management Service

    Humio Adds Unlimited Ingest Plan to Log Management Service

    Fresh off raising an additional $20 million in funding, Humio, a provider of a platform for analyzing log data, has added an unlimited ingest plan to a cloud-based service to make it easier for organizations to retain massive amounts of log data.

    The unlimited ingest plan for the company’s cloud service extends a similar option Humio already makes available to customers that deploy its log management platform in an on-premises environment.

    Morten Gram, executive vice president for Humio, said one of the significant limitations of rival log management platforms is they charge customers based on the amount of data ingested. That approach only serves to dissuade organizations from ingesting data to limit their costs. The trouble is that organizations won’t be able to discover outlier issues in data they never see in the first place, he said, noting issue becomes even more problematic as organizations embrace best DevOps practices to deploy more applications both in the cloud and in on-premises IT environments. The Humio Bucket Storage can retain more than a petabyte of log data.

    Given the scale and scope of modern applications, Morten said organizations are now using log data to drive a wide variety of analytics tools to automate processes in real-time. Log data is also playing a critical role when it comes to applying artificial intelligence (AI) to IT management. The more log data made available, the more accurate the AI models being employed become, he noted.

    In addition, Gram said that because Humio doesn’t rely on an index engine to organize data for a search engine, IT teams can launch any type of query they like. In contrast, rival platforms are optimized for specific types of queries, he said, which also substantially reduces the amount of compute and storage required to analyze log data. That capability is why Humio can offer unlimited ingest of data and still remain profitable, as long as there are enough customers to enable Humio to operate at scale, he noted.

    Given the current need for many IT employees to work from home to help combat the COVID-19 pandemic, it’s clear more organizations will be relying on tools hosted in the cloud to manage IT environments. Many of those organizations will also be a lot more sensitive to costs given the impact the COVID-19 pandemic is having on the economy. Of course, it’s probable many organizations will postpone new application development projects until sometime after the COVID-19 pandemic subsides. However, as more organizations start to appreciate the extent to which people may adopt social distancing, many of them will soon be re-engineering business processes to adjust to a new reality. As such, it may now only be a matter of time before there are even more digital business transformation projects being launched than ever before.

    — Mike Vizard

  • Understanding and Implementing the APM Puzzle – Performance and Availability

    Understanding and Implementing the APM Puzzle – Performance and Availability

    While every organization is unique, there’s one universal goal everyone can get behind—creating and delivering an exceptional end-user experience. For both classic IT organizations and companies built in the age of cloud, delivering continuous availability and appropriate application performance is key.

    Although digital transformation has become a buzzword some would say is meaningless, the idea of digitizing a traditional company and building new businesses whose foundations are established upon the latest web technologies is critical in today’s IT and non-IT organizations. Think about the prevalence of cloud migration efforts during the past several years. Traditional organizations typically prioritize on-premises applications with increasing quantities of hybrid applications. But, because they aren’t yet fully transitioned to cloud—whether IaaS, PaaS or SaaS—their IT organizations need to live in both universes.

    Monitoring these environments at both the infrastructure and application tiers and across each stage in this transition requires support of a full stack of tools to cover web uptime, user experience, transaction monitoring, application tracing, log analysis and appropriate infrastructure monitoring. That said, modern organizations that have fully embraced cloud and leverage modern microservice architectures have similar challenges, but the exact same level of monitoring visibility requirement.

    Whether public, private, hybrid or multi-cloud, nearly every organization has moved to the cloud in some capacity. Regardless of what the company produces or the services IT provides, it must maintain uptime, availability and seamless performance to create and continuously deliver a user experience rivaling competitors and exceeding user expectations.

    Because let’s face it, even though every business is different and virtually every market is saturated, consumers and B2B companies have more options than ever. Without delivering a solid end-user experience, there’s an ever-increasing plethora of alternative vendors and providers from which customers can choose.

    Public Cloud Platforms for Classic IT Organizations and the Cloud Generation

    Let’s explore a few differences between how traditional IT organizations and cloud-era companies interact with the cloud. At a high level, Azure is a natural choice for IT companies with significant investments in apps traditionally acquired (not built) by the company and managed by their IT team, that are now tasked with digitizing their business by leveraging public cloud platforms. These types of companies often have Microsoft Office, Microsoft Exchange and other Microsoft products already implemented on-premises, and Infrastructure-as-a-Service (IaaS) or Platform-as-a-Service (PaaS) solutions as well. If they’re now adding a public cloud platform to their mix, staff expertise and solution familiarity make adopting Microsoft Azure a natural next step. Microsoft has long recognized the need to make these types of transitions and mixtures easier, demonstrated by its Office365 suite (as an example).

    On the flip side, companies that were born fully in the cloud, (i.e., relatively newer organizations without a legacy anything on-premises, with respect to IT infrastructure) will likely have a higher propensity to choose a provider such as AWS or Google Cloud even though Microsoft, Oracle and others are certainly competing there as well. So, it’s not a matter of one being intrinsically better or more fully-featured, but about which is the best fit for the organization and its priorities.

    At the end of the day, however—regardless of organization type or public cloud platform implemented—every company needs monitoring tools and solutions that keep applications up, running and performing seamlessly. With an integrated set of simple, easy-to-use, quick to value and powerful solutions, organizations can achieve truly proactive lifecycle assurance of application availability and performance.

    Uptime and Seamless Performance: Putting Together the APM Puzzle Using All the Pieces

    Each and every piece of the APM puzzle must be incorporated to achieve full-stack visibility and ultimately top performance: user experience, metrics, traces and logs. Having a log management solution monitoring availability, enables proactivity and enables IT to react quickly to help identify and remediate problems is paramount—it’s table stakes that everything be available. After all, if a website or page isn’t accessible, business transactions cannot be processed and that business is effectively down.

    Creating and maintaining a healthy application involves not only ensuring it’s functionally available to users; it must also be performing appropriately—continuously delivering both a reasonably responsive user experience and supporting the required volume of transactional work. This means a complete view into all aspects of performance—from the website and webpages all the way into and across all relevant application components and their associated infrastructure—be proactively visible and monitored.

    There is thus a natural and increasingly urgent workflow affinity between logs and APM—across the development lifecycle. When errors occur, it’s critical to understand, precisely and immediately, where are the impacts on service performance, or if there even are any impacts. Conversely, when application performance issues arise, it’s critical to immediately know exactly which errors—across the complex and constantly changing infrastructure and application stack—are directly related to the problem at hand.

    Without this bi-directional workflow integration, not only can application performance and availability not be managed proactively, but any issues with application service availability and performance will take far longer to diagnose and repair—seriously impacting the business bottom line.

    Just because everything is available doesn’t necessarily mean it’s appropriately performing for the end user trying to use the application.

    With all this in mind, it’s paramount to implement powerful, easy-to-use solutions that’ll achieve integrated application performance and availability management for any type of organization operating on-premises and/or cloud-based applications across all cloud environments.

    Conclusion

    While traditional IT organizations and cloud-only companies are different in many ways, providing exceptional end-user experience and achieving seamless availability and performance (no matter what) is a common and increasingly critical business goal. To achieve business success, organizations should choose a complete suite of simple, powerful and integrated solutions to optimize and manage their cloud-hosted applications and platforms. Anything less leaves the APM puzzle unsolved.

    — David Wagner

  • Logging: Turning Good DevOps Teams into Great Ones

    Logging: Turning Good DevOps Teams into Great Ones

    The competition is on for DevOps teams that are expected to rev up production on a multitude of projects, with teams and companies aiming to stay atop the global software product marketplace. The complexity of code creation and the pace of deployment has picked up in recent years, and DevOps managers are starting to face serious challenges of scale and efficiency.

    Constant code generation is the first obstacle. Imagine a team producing millions of lines of code, working for weeks and hoping for a smooth release. But testing time arrives, and there is a total data meltdown.

    Wasting valuable programming hours is not an option, but what if managers had the tool to turn back the time to a version before the mistake happened? Managers or developers may view logging as an incredibly boring activity, but it is vital. It serves like a black box of what went wrong—but also a way to roll back the bad code, and return to a more manageable situation.

    Logging and tracking habits ensure that a DevOps team will not see their code fail in production, and cause expensive breakdowns in service. Logging becomes more than a wishful addition, but a pivotal tool that may save a project.

    Data is proliferating, code is constantly being written to offer innovative products or support existing ones. There is a massive amount of data projected to be generated in 2025, only a few short years away, if the global IT production sector keeps increasing its activity. This amount of data to be kept and logged would be roughly 10 times higher compared to the data generated in 2016. This issue has plagued Silicon Valley, but also worldwide tech centers: how to keep track of what is going on. How do companies such as Instacart, Lime and OpenAI track their changes and ensure viability and awareness of errors?

    There is the new role for DevOps managers: ensure fast, modern and stringent log management. Dedication to logging means generating tight order out of the chaos of code creation. The right tool will be economical, intuitive and fast, ensuring the possibility for control in what could become a runaway data meltdown.

    Logging is one of the pillars in the modern DevOps department, and while now it is important, it will become indispensable, along with metrics and analytics.

    DevOps are already aware of the possibilities of logging, to keep track of multiple avenues in product creation, from databases to server side events, and even the effects and behavior of users.

    Stringent log management means making use of a valuable resource of knowledge and decision making, but also operating with a complex system of data. DevOps managers will need the tools to span the demands of stringent log management, for a multi-step process involving log generation, transmission, analytics, storage, archives and disposal.

    The right logging system can streamline those steps. Inexpensive logging tools and systems can unify log management across teams and simplify the process of logging. More services are appearing each day, either cloud-based or self-hosted, and with varying levels of security. With increasing complexity and the drive to create ahead of the competition, it would be the task of DevOps managers to make the team aware of the tools, and to provide tools intuitive and fast enough for the good habit of logging and log management.

    — Chris Nguyen