Tag: log analysis

  • Understanding and Implementing the APM Puzzle – Performance and Availability

    Understanding and Implementing the APM Puzzle – Performance and Availability

    While every organization is unique, there’s one universal goal everyone can get behind—creating and delivering an exceptional end-user experience. For both classic IT organizations and companies built in the age of cloud, delivering continuous availability and appropriate application performance is key.

    Although digital transformation has become a buzzword some would say is meaningless, the idea of digitizing a traditional company and building new businesses whose foundations are established upon the latest web technologies is critical in today’s IT and non-IT organizations. Think about the prevalence of cloud migration efforts during the past several years. Traditional organizations typically prioritize on-premises applications with increasing quantities of hybrid applications. But, because they aren’t yet fully transitioned to cloud—whether IaaS, PaaS or SaaS—their IT organizations need to live in both universes.

    Monitoring these environments at both the infrastructure and application tiers and across each stage in this transition requires support of a full stack of tools to cover web uptime, user experience, transaction monitoring, application tracing, log analysis and appropriate infrastructure monitoring. That said, modern organizations that have fully embraced cloud and leverage modern microservice architectures have similar challenges, but the exact same level of monitoring visibility requirement.

    Whether public, private, hybrid or multi-cloud, nearly every organization has moved to the cloud in some capacity. Regardless of what the company produces or the services IT provides, it must maintain uptime, availability and seamless performance to create and continuously deliver a user experience rivaling competitors and exceeding user expectations.

    Because let’s face it, even though every business is different and virtually every market is saturated, consumers and B2B companies have more options than ever. Without delivering a solid end-user experience, there’s an ever-increasing plethora of alternative vendors and providers from which customers can choose.

    Public Cloud Platforms for Classic IT Organizations and the Cloud Generation

    Let’s explore a few differences between how traditional IT organizations and cloud-era companies interact with the cloud. At a high level, Azure is a natural choice for IT companies with significant investments in apps traditionally acquired (not built) by the company and managed by their IT team, that are now tasked with digitizing their business by leveraging public cloud platforms. These types of companies often have Microsoft Office, Microsoft Exchange and other Microsoft products already implemented on-premises, and Infrastructure-as-a-Service (IaaS) or Platform-as-a-Service (PaaS) solutions as well. If they’re now adding a public cloud platform to their mix, staff expertise and solution familiarity make adopting Microsoft Azure a natural next step. Microsoft has long recognized the need to make these types of transitions and mixtures easier, demonstrated by its Office365 suite (as an example).

    On the flip side, companies that were born fully in the cloud, (i.e., relatively newer organizations without a legacy anything on-premises, with respect to IT infrastructure) will likely have a higher propensity to choose a provider such as AWS or Google Cloud even though Microsoft, Oracle and others are certainly competing there as well. So, it’s not a matter of one being intrinsically better or more fully-featured, but about which is the best fit for the organization and its priorities.

    At the end of the day, however—regardless of organization type or public cloud platform implemented—every company needs monitoring tools and solutions that keep applications up, running and performing seamlessly. With an integrated set of simple, easy-to-use, quick to value and powerful solutions, organizations can achieve truly proactive lifecycle assurance of application availability and performance.

    Uptime and Seamless Performance: Putting Together the APM Puzzle Using All the Pieces

    Each and every piece of the APM puzzle must be incorporated to achieve full-stack visibility and ultimately top performance: user experience, metrics, traces and logs. Having a log management solution monitoring availability, enables proactivity and enables IT to react quickly to help identify and remediate problems is paramount—it’s table stakes that everything be available. After all, if a website or page isn’t accessible, business transactions cannot be processed and that business is effectively down.

    Creating and maintaining a healthy application involves not only ensuring it’s functionally available to users; it must also be performing appropriately—continuously delivering both a reasonably responsive user experience and supporting the required volume of transactional work. This means a complete view into all aspects of performance—from the website and webpages all the way into and across all relevant application components and their associated infrastructure—be proactively visible and monitored.

    There is thus a natural and increasingly urgent workflow affinity between logs and APM—across the development lifecycle. When errors occur, it’s critical to understand, precisely and immediately, where are the impacts on service performance, or if there even are any impacts. Conversely, when application performance issues arise, it’s critical to immediately know exactly which errors—across the complex and constantly changing infrastructure and application stack—are directly related to the problem at hand.

    Without this bi-directional workflow integration, not only can application performance and availability not be managed proactively, but any issues with application service availability and performance will take far longer to diagnose and repair—seriously impacting the business bottom line.

    Just because everything is available doesn’t necessarily mean it’s appropriately performing for the end user trying to use the application.

    With all this in mind, it’s paramount to implement powerful, easy-to-use solutions that’ll achieve integrated application performance and availability management for any type of organization operating on-premises and/or cloud-based applications across all cloud environments.

    Conclusion

    While traditional IT organizations and cloud-only companies are different in many ways, providing exceptional end-user experience and achieving seamless availability and performance (no matter what) is a common and increasingly critical business goal. To achieve business success, organizations should choose a complete suite of simple, powerful and integrated solutions to optimize and manage their cloud-hosted applications and platforms. Anything less leaves the APM puzzle unsolved.

    — David Wagner

  • Splunk and the ELK Stack: A Side-by-Side Comparison

    Splunk and the ELK Stack: A Side-by-Side Comparison

    This article’s purpose is to compare the “big two” in the log analytics world—Splunk and the ELK Stack. But before we go into details, a short introduction to the competitors is required.

    Splunk is the “Google for log files” heavyset enterprise tool that was the first log analysis software and has been the market leader ever since. The open-source ELK Stack of Elasticsearch, Logstash and Kibana is an up-and-coming rival that is a consolidated data analytics platform. The two compete in terms of features, usability and cost.

    Overview

    Splunk and the ELK Stack use two different approaches to solve the same problem. People typically choose one or the other based on how their organizations are structured and how much time they want to devote to log analytics. Splunk takes a pile of data and allows people to search through the information to extract what they need. ELK requires more work and planning in the beginning, but the value extraction is easier at the end.

    The three key components of Splunk are its forwarder, which pushes data to remote indexers; indexer, which has roles for storing and indexing data and responding to search requests; and search head, which is the front end of the web interface where these three components can be combined or distributed over servers. Splunk also supports the integration of its functionalities in applications via SDKs. Common use cases include operational monitoring, security and user behavior analytics. Splunk is a paid service wherein billing is generated by indexing volume.

    The ELK Stack is a set of three open-source products—Elasticsearch, Logstash and Kibana—all developed and maintained by Elastic. Elasticsearch is NoSQL database that uses the Lucene search engine. Logstash is a data processing and transportation pipeline used to populate Elasticsearch with the data (though also it supports other destinations including Graphite, Kafka, Nagios and RabbitMQ). Kibana is a dashboard that works on top of Elasticsearch and facilitates data analysis using visualizations and dashboards.

    Both Splunk and the ELK Stack can be used to monitor and analyze infrastructure in IT operations as well as for application monitoring, security and business intelligence.

    ELK vs. Splunk

    Loading Data

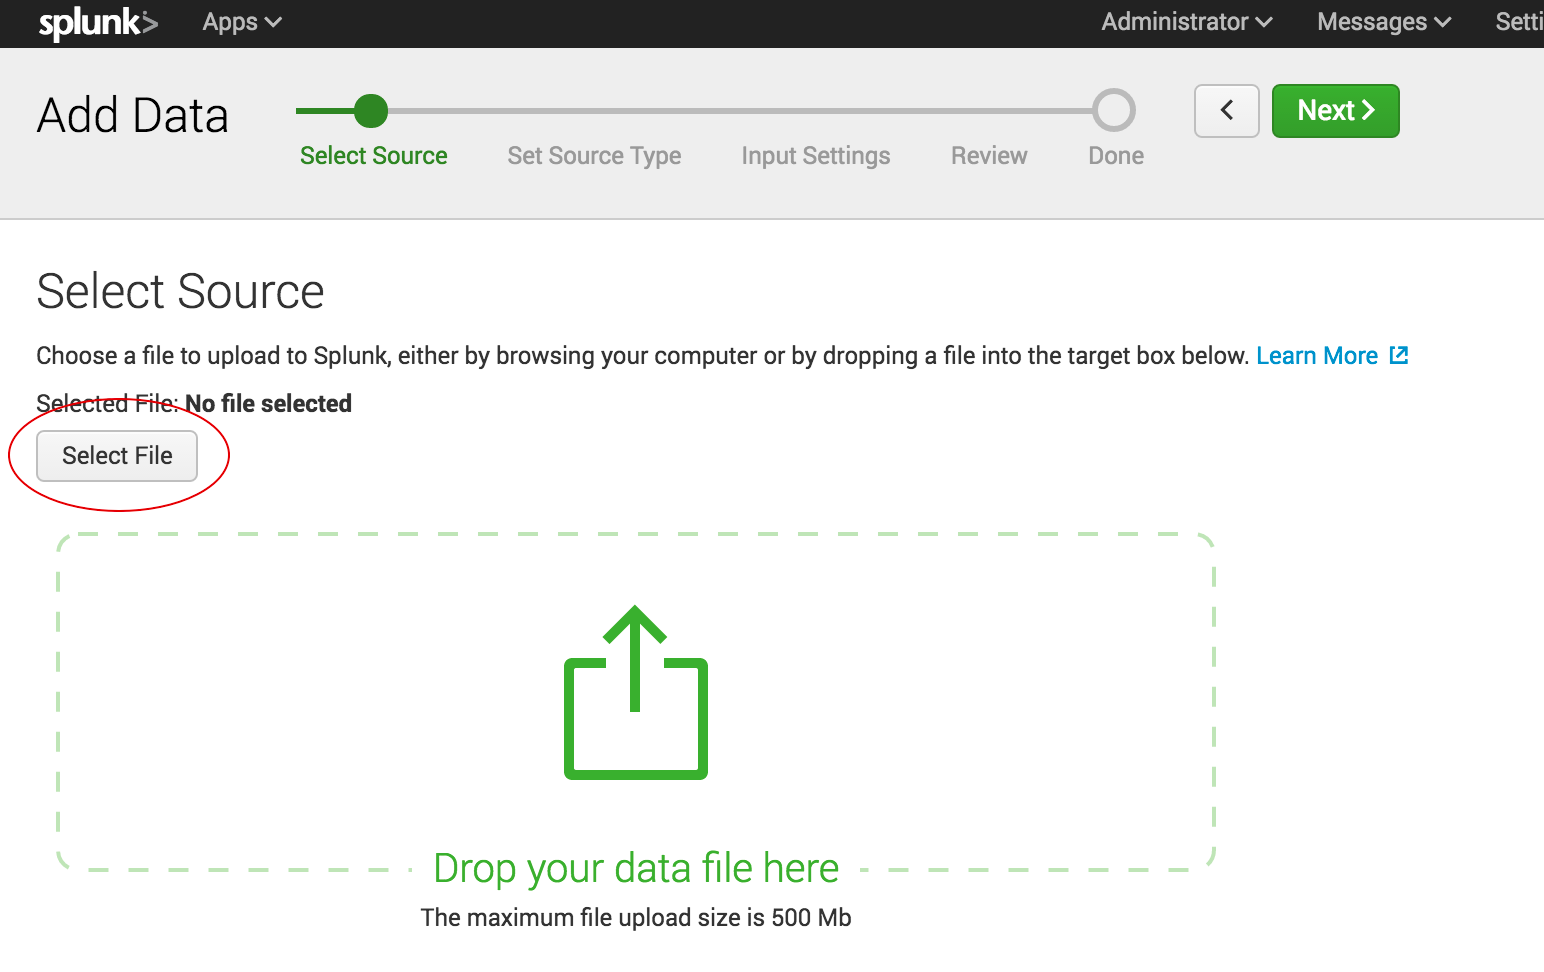
    Shipping data to Splunk is fairly easy. After installation, the forwarders come pre-configured for a wide selection of data sources such as files and directories, network events, windows sources and application logs, and they are used to import data into Splunk as shown:

    import data into splunk

    In the ELK Stack, Logstash is used to ship data from the source to the destination. However, Logstash needs to be configured so that each field is identified before the data is shipped to Elasticsearch. This kind of configuration can be tricky for those who do not work with scripting languages (such as Bash, Python or Ruby), but there is good support online that can be found quite easily.

    Visualizations

    The Splunk web UI includes flexible controls that allow you to edit and add new components to your dashboard. Management and user controls can be configured differently for multiple users, with each having a customized dashboard. Splunk also supports visualizations on mobile devices with application and visualization components that are easy to customize using XML.

    splunk xml customization

    Kibana is the visualization tool in the ELK Stack, and like Splunk, the platform supports the creation of visualizations such as line charts, area arts and tables and the presentation of them in a dashboard. The search filter is always shown above the different views: If a query is used, it is automatically applied on elements of the dashboard. Splunk also has a similar option, but it involves configuration in XML. Still, Kibana does not support user management, but hosted ELK solutions provide it out of the box.

    kibana

    Search Capabilities

    The search function is a key capability of any log management platform. Both the Splunk and ELK Stack’s web UIs support searching using a dedicated search field. The query syntax on Kibana is based on the Lucene query syntax while Splunk uses its own Splunk Search Processing Language (SPL). Those familiar with scripting languages may already be familiar with Lucene while SPL is proprietary and must be learned.

    One other difference is that Splunk offers dynamic data exploration to help users to find and extract everything as a searchable field when formatted in a manner that allows searching for non-configured fields. Elasticsearch fields, on the other hand, need to be defined in advance to use aggregation over the log properties.

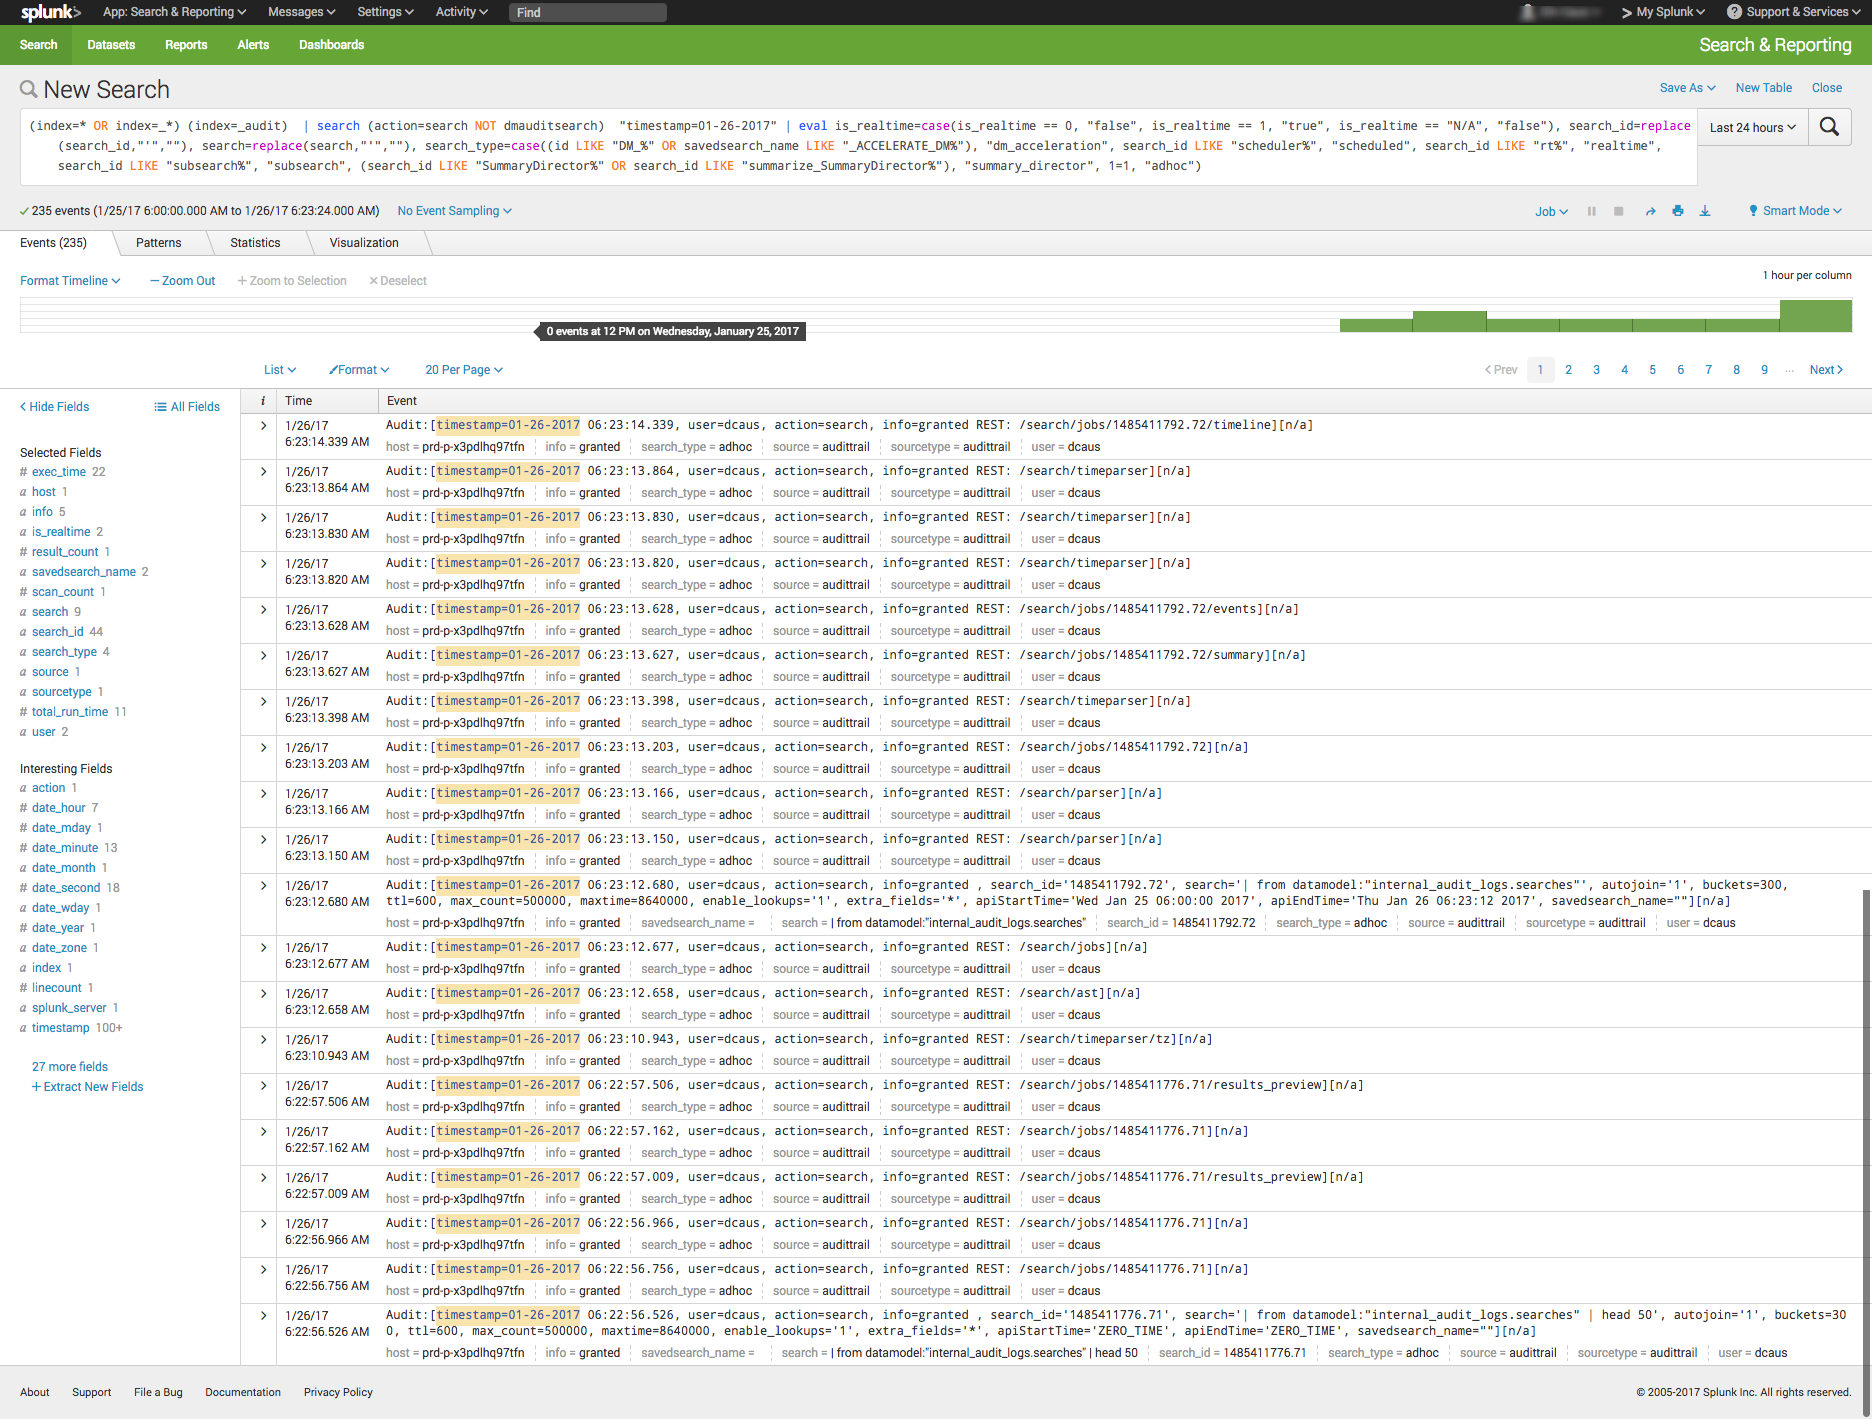
    Here is one example of a query for each platform.

    Kibana:

    (beat.hostname: ES1 AND metricset.name: process) AND (system.process.username: root OR system.process.username: admin)

    Splunk:

    (index=* OR index=_*) (index=_audit)   | search ( action=search NOT dmauditsearch )  "06:54"

    The difference between SPL syntax and Lucene queries is that SPL supports the search pipeline (as in the example above) in which consecutive commands are chained together using a pipe character that allows the output of one command to be used as the input of the next one. Lucene query syntax is more straightforward and can work to generate the output from the query without additional transforming.

    Traction and Community Support

    Both Splunk and ELK Stack have large communities of users and supporters. ELK also has its own clear and extensive documentation for each separate tool, making it easy to get started. In addition, Elastic itself offers educational sessions worldwide.

    In addition to having good documentation and a forum, Splunk, too, has customer and support platforms that offer various professional services. Splunk’s education program and instructors are available virtually or on site.

    The Learning Curve

    The ELK Stack’s learning curve is flat for what it’s meant to do. Elastic offers paid courses, but there is a lot of free material online due to the popularity of the open-source platform.

    For Splunk, the learning curve is moderate in size, especially when carrying out more specialized analyzes. The company offers a trial period with extensive documentation, but the advanced Splunk educational courses are fairly expensive.

    User Management

    The ELK Stack provides role-based security as a separate paid tool. Splunk and managed-ELK services offer user management out of the box with user auditing included.

    Pricing Levels

    As already mentioned, Splunk is proprietary software with a price tag. After one integrates several data sources with the platform, the cost will increase greatly as data is continuously generated.

    The open-source ELK Stack is free, but the true picture is not so black and white. The cost of the platform’s hardware and maintenance also adds up. To lower the cost of using ELK, features, plugins and tools must be developed.

    Vendor Lock-In

    Splunk’s high price tag comes with the benefit of offering an overall, well-rounded product. Users might be locked into a vendor, but that one vendor is all that is needed to do nearly anything. The open-source ELK Stack is seemingly free, but it does not provide many functionalities such as alerting out of the box—and it costs money to develop and maintain them.

    Spunk is Splunk. There are many varieties of ELK:

    One way to look at the Splunk-versus-ELK discussion is to frame it as the old Microsoft-versus-Linux debate. If you like Microsoft, you will probably prefer Splunk. If you like Linux, you will likely want to use the ELK Stack.

    Final Thoughts

    When one decides between these solutions, the ultimate choice should reflect not only on the platform but also on the customer’s specific needs.

    Both Splunk and the ELK Stack are currently popular. But what might the future hold?

    splunk vs elk
    Splunk (Blue) vs. Elasticsearch (Red) on Google Trends

    According to Google Trends, the ELK Stack has now overtaken Splunk in terms of the proportion of Google searches. But ELK’s traction does not stop there. As mentioned earlier, Splunk self-reports 12,000 total users. Elasticsearch is reportedly downloaded 500,000 times every single month. In IT departments, then, it is far more likely to meet people who are familiar with ELK than with Splunk, meaning that the adoption rate of the ELK Stack could “snowball” and increase even more in the future whenever ELK users join new companies or teams. People tend to use whatever software they already know or is already being used.

    It’s clear that many functionalities are being added to the open-source ELK Stack. This, in turn, is shrinking the gap between it and Splunk. hose features currently found only in Splunk are likely to be added to ELK at some point in time.

    So, if a more mature product is what you need, go with Splunk. But if you like a product that is more flexible, ELK is the way. Either way, it’ll be interesting to see how these two continue to compete.

    — Asaf Yigal

  • Sauce Labs Streamlines DevOps with Sumo Logic

    Sauce Labs Streamlines DevOps with Sumo Logic

    Log management and analysis is a crucial element of effective DevOps. In an effort to work more effectively and efficiently at the same time, gathering and analyzing feedback provides essential input that organizations can use to correct issues and enhance performance. There are a variety of log management tools out there, but Sauce Labs solved its log management and analysis challenge with Sumo Logic.

    devopsy.kinsta.cloud recently had a chance to sit down with Joe Alfaro, VP of Products for Sauce Labs, to talk about the decision to go with Sumo Logic’s software-as-a-service (SaaS)-based log management solution.

    Prior to making the switch to Sumo Logic, Sauce Labs was using an ELK stack for log management. Alfaro explained that the ELK stack was tedious to maintain. “Our ELK-based solution required constant care and feeding. We were always having to make sure we had enough disk space and we were always fixing bugs or adding new features. We had a small team dedicated to management of this solution. In addition, it was difficult to bring developers up to speed on the tool, since documentation was not always kept up to date and there were no training materials.”

    The effort required to troubleshoot and maintain the tool itself got in the way of Sauce Labs’ ability to use the tool to debug production issues, and used precious developer resources that were needed elsewhere. Sauce Labs decided it needed a new tool—something that was very flexible and cloud-based, so the company wouldn’t need to worry about maintenance or storage.

    To find this new tool, Sauce Labs did proof-of-concept testing with a handful of well-known vendors: Graylog, Loggly, Splunk and Sumo Logic. Alfaro was emphatic about the Sumo Logic experience. “Implementation was ridiculously easy. We were up and running within a day,” he said, adding, “Sumo won out as it has the combination of: ease of use, includes all of the features we wanted, is cloud-based and within our budget.”

    The switch to Sumo Logic has also helped the company streamline its DevOps practices. Sumo Logic provides a communication tool between the developers and ops engineers, acting as a common language that allows DevOps teams to work together to identify the root of problems quickly and easily.

    Alfaro shared that the bridge between Dev and Ops provided by Sumo Logic has led to improved service, as well as savings in both time and cost. “It also finds patterns in our logs that lead to better analysis in discovering problems. This machine-learning-like pattern discovery is invaluable to getting to the root is issues. These days we spend minutes finding problems rather that the hours or days we used to spend in the past, before Sumo. This leads to more uptime and more developer productivity.”

    Of course, your mileage may vary. Graylog, Splunk and other log management and analysis tools are formidable in their own right. If you’re in the market for a new log management solution, though, Sumo Logic should be on your short list for consideration. If your results are anything like Sauce Labs’ results, it would be a crazy move not to check out Sumo Logic.

    — Tony Bradley

  • 5 Reasons Why Companies Should Analyze Their Logs

    5 Reasons Why Companies Should Analyze Their Logs

    At first thought it might seem as though analyzing logs is something that only affects the IT portion of your business. However, nothing could be further from the truth. In reality, log analysis affects every aspect of your business. This includes finance, legal, human resources, sales and marketing, security and operations. In fact, with log analysis, you’ll discover issues either before or as they happen and avoid both lost time and unnecessary delays.

    There are many benefits to properly analyzing your logs. Your organization can increase revenue, reduce expenses, better manage employees, respond to incidents and even keep yourself out of legal hot water. Read on to learn about the five major business areas impacted by log analysis and why every business needs to analyze its log—and the sooner the better.

    Business Operations

    Probably the most obvious use of log analysis is in supporting business operations. These functions include the following:

    • Detecting critical system errors
    • Identifying key trends
    • Improving operational efficiency
    • Supporting service level agreements (SLA)
    • System troubleshooting

    Early indication of problems can pinpoint money-wasting processes. It also can mitigate risk in support of business continuity. This will help avoid service disruptions that can lead to unhappy customers and lost sales.

    Compliance and Legal

    Every organization has internal policies: security policies, employee policies, legal policies, etc. In fact, most organizations have regulations (such as HIPAA and Sarbanes-Oxley) they must adhere to. Often these regulations are imposed by the government. The only feasible way to ensure policies are followed and regulations are met is through log analysis.

    Log analysis simplifies compliance. It also supports audit requirements, litigation needs, subpoena requests and forensic investigations. In short, log analysis is the only way to ensure an organization stays out of legal trouble.

    Proper Resource Sizing

    One of the worst things any company can do is have the wrong amount of resources to support its business operations. From network bandwidth to storage capacity to CPU cycles, businesses have to get these quantities just right. Not enough resources in any area can lead to poor performance, frustrated customers and, eventually, lost sales.

    Of course, the easy thing to do is just overspec these resources. However, doing that leads to increased expenses, which adversely impact the bottom line. Using logs to determine proper resource sizing is the only way to ensure you have maximized your profits.

    The use of logs can also be used to verify third-party billing. For instance, your company can use your logs to make sure the amount of bandwidth you were charged for by your service provider is actually the amount you used. This, too, can benefit the bottom line.

    Sales and Marketing

    It may not seem as though log analysis can be used to directly impact sales and marketing, but it certainly can. For starters, log analysis can be used to quantify the effectiveness of a sales campaign. Information such as referring sites, pages accessed and conversion rates all can be used to tweak different aspects of the sales effort.

    Log analysis also can be used to optimize website performance in the support of a sales funnel. Information such as customer navigation, traffic loads and conversion errors can be used to improve the sales process. In fact, analyzing logs can be used as a revenue driver in any organization.

    Security

    One of the most important areas in any business today is security. Logs can be used to both proactively protect an organization, as well as forensically investigate security breaches.

    Proactively, logs can be used to accomplish the following:

    • Optimize blocking and filtering of incoming traffic
    • Maximize email virus protection
    • Monitor failed authentication attempts
    • Verify configurations in firewalls

    After the fact, logs can be used to do the following:

    • Assess security policy compliance
    • Initiate incident response
    • Investigate security breaches

    You cannot understand security risks or respond to security incidents without the ability to analyze your logs.

    In short, whether you were aware to it or not, log analysis impacts every department in your organization. It directly and indirectly impacts every company’s bottom line by increasing revenue, decreasing expenses and delighting customers.

    You now know that log analysis is not just a “back office” IT function. Every department in your company needs to use the intelligence contained in your logs to do their jobs better. It is why every business needs to analyze their logs, and now is the time to start.

    About the Author / Ariel Assaraf

    arielassarafAriel Assaraf is a co-founder and CPO at Coralogix. Previously Ariel was a GL at Verint and a Product manager at an elite Israeli intelligence unit.  He is into Software design, UX, growth hacking and basketball. Ariel holds a BEc in Economics and Math from the Open university of Israel. Connect with him on LinkedIn and Twitter

  • Business Value of Log Analysis

    Business Value of Log Analysis

    The modern software delivery pipeline breaks the mold of traditional process and tool acquisition, but doesn’t warrant any less consideration. Measuring the impact of log analysis for your ops and dev teams (and the organization overall) is more of an exercise in measuring process improvement—not hard ROI.

    The soft ROI components of log analysis are:

    1. Wasting Less Time: IT Operations wastes dozens of hours each week hunting down system events that relate to a problem. Log analysis not only eliminates the lost time, but also this reactive approach to addressing problems. Identifying system issues is an arduous task, especially when it’s not clear if the problem is on the application layer or the infrastructure. If the issue is a combination of the two, a delayed release is the likely outcome. With log analysis, you’ll discover issues either before or as they happen and avoid both lost time and unnecessary delays!
    2. Responding and Resolving Issues More Quickly: Developers working with IT provided analytics respond to and resolve bugs more quickly. This helps improve the stability of production and frees up developer time to focus on adding new functionalities that will ultimately increase the value of your application.
    3. Reducing Customer Churn: Modern customers demand stable applications with regular updates. Without this positive user experience, they’ll move on and find a different application to meet their needs. Frequent outages and poor product quality result in churn even in previously entrenched industries. For instance in financial services, a few bottom-up constructed DevOps teams are blowing traditional organizations out of the water. Some of the older institutions have stepped up their game but only by thinking ahead and using better metrics.
    4. Accelerating Releases: You cannot do agile if you are always playing catch up with production. Often organizations delay six or more planned releases a year due to unexpected issues. When a publicized release is delayed, customers are particularly unhappy and prone to jumping ship. In agile, with the expectation of regular bi-weekly or fast sprints, delays are a major let down. If your goal is continuous integration or delivery, delayed releases are not acceptable.
    5. Optimizing Production Infrastructure Costs: Growing infrastructure quickly is easy, but how fast is too fast? Because of its low visibility, bad infrastructure can control your organization without you even realizing. Using log analysis, you can attack server sprawl head-on, track workloads assigned to specific machines and identify underutilized or dead assets. You can also use that data to restructure your on premise or cloud infrastructure spend!
    6. Exploratory Infrastructure: Log analysis builds confidence that server logging is happening automatically, freeing IT resources and providing them the time to consider how and where your system can be improved. From identifying infrastructure configurations that will enhance the environment to auto-scaling initiatives or simply engaging in more productive activities than justifying outages, your IT department will have the time to focus on higher-level thinking and tasks.
    7. Improving Communication: With better reporting, comes better communication to both the team and executives. Presentations are built more quickly, analysis showing what went well and poorly is generated easily and action items for improvement are implemented in more detail and without any additional effort. Consistent presentations means standard dashboards and greater efficiency across the board for the team.

    Forget the ROI

    You may have noticed the absence of any ROI calculation in our benefits analysis. This is intentional, because in the end, the calculations don’t matter. The point of implementing log analysis is to replace your existing procurement model with a system that your team already knows is better. Unfortunately, those who continue to use old ROI calculations to evaluate these tools will miss these benefits.

    Cloud-based log analysis sometimes seems too easy, but it is the future of the modern software delivery pipeline. The processes and tools that drive log analysis are simplified and seamless, adding value to your culture, team and processes that cannot be measured in dollars.

  • Log Analysis, or Log Clog

    Log Analysis, or Log Clog

    Log Analysis has the ability to transform teams. It centralizes communication, increases responsiveness, moves efforts from reactive to proactive, reduces time to resolution TTR,  and allows increasingly complex environments to grow without fear.  But, if log analysis becomes the bottleneck, it reverses all these benefits.

    (more…)

  • Log Analysis, or Log Hoarding

    Log Analysis, or Log Hoarding

    Let’s take a stroll down memory lane to remember the beginning of web application era:  when a client had a problem, it called the support team to complain about the service failure or bug, and a customer support team would have written an incident report and forward it to the operations team, and then the operations team would examine it, mainly by looking at the logs with whatever helpful information they had from the customer.

    (more…)

  • Change your thinking about Change Management

    Change your thinking about Change Management

    Change Management, let’s face it, it’s usually a checklist item and a CYA tool. But in the world of DevOps where change is part of the culture and processes.  Change Management needs to be more than a cost center, and really a way to improve what you are doing. And there is no excuse not to.

    (more…)

  • Key customer verticals adopt XpoLog’s Augmented Search for IT log analysis

    DevOps professionals can unlock the value of log data by combining machine learning with human intelligence

    NEW YORK, March 12, 2014 /PRNewswire/ — XpoLog Ltd, the company that invented Augmented Search for IT log analysis, is pleased to announce its adoption across key customer verticals and a new full featured edition of its platform that delivers the same advanced semantic technologies to DevOps professionals free of charge.
    Augmented Search is a breakthrough that unlocks the hidden value of log data and eliminates time-consuming manual searches. Customers using XpoLog’s Augmented Search have drastically reduced time-to-resolution and gain a wealth of intelligence from their IT environments, including the analysis of proprietary log data.

    XpoLog’s solution uniquely layers intelligence on top of search context using semantic analysis, and pattern and anomaly detection, to uncover insights and trends into application problems, systems, and user behavior.

    “Augmented Search helps us to quickly diagnose problems in multi-tiered application logs within a few minutes, instead of the hours it takes when searching manually. The key benefit is getting instant access to critical information that we simply don’t know existed,” said Omer Haim, Director of IT and Operations Of Conduit Mobile Inc. “We selected XpoLog because of Augmented Search after evaluating several leading log management and search solutions.”

    Companies in finance, government, medical, and IT have adopted XpoLog’s Augmented Search technology. Some leading examples are: the popular online gaming company 888 Holdings, online payment gateway leader BlueSnap, a very large U.S. based medical care IT corporation, and a department of justice for a European Union member country.

    Customers have recognized that visualizing data is a major improvement in log management software. XpoLog enables them to create Web access log statistics, application log error summary, performance charts, and other reports far more efficiently than ever before. Statistical queries instantly visualize log data, which can be used to build charts, dashboards, geomaps, and much more.

    The same powerful features of the XpoLog Log Analysis Platform are now available for free for processing up to 1 gigabyte of log data per day. There has never been a more powerful free software solution that’s capable of meeting any log analysis requirement. The full brochure, online demo and even a free trial of the Log Analysis Platform, can be downloaded through XpoLog’s official website.

    “Vendors like XpoLog and Splunk brought log analysis to the masses by making it possible to surface log data with a simple, Web like search,” said XpoLog CEO Haim Koschitzky. “Now, XpoLog is taking log mining to the next level with Augmented Search, transcending legacy solutions by combining machine and human intelligence to flatten time to results.”

    About XpoLog Ltd
    XpoLog Ltd is an IT operations analytics software company based in the Israel and the U.S. that invented augmented search, a breakthrough which unlocks the hidden value of log data. The platform drastically reduces time to resolution and provides a wealth of intelligence, trends, and insights into enterprise IT environments. XpoLog is a trusted source for DevOps analytics tools with over 10 years of experience in the IT industry. Trial versions of the XpoLog Platform can be downloaded as a standalone server or J2EE application through the company’s official website. [http://www.xpolog.com]

    For more information about XpoLog Log Analysis Platform, please email to sales@xpolog.com.