In modern Kubernetes environments, even small misconfigurations in your CI/CD pipeline can lead to failed or flaky deployments. Jenkins pipelines that build, test and deploy containers to Kubernetes clusters are powerful but complex. When manifests or pipeline settings are wrong, the cluster’s desired state never matches reality, and workloads may crash or never start. Advanced teams know that pipeline errors often hide behind cryptic logs. In this article, we explore common real-world pipeline pitfalls, incorrect manifests, mismatched variables, versioning blunders, rollout mistakes and more and show how to fix them with solid best practices.
Invalid Kubernetes Manifests and YAML Errors
One of the most frequent causes of failed deployments is an incorrect Kubernetes manifest. A typo in the YAML or a wrong API version can mean kubectl apply never succeeds or creates broken resources. For example, using tabs instead of spaces or mis-indenting can silently break a manifest. As one report notes, YAML parsers often give unclear errors for indentation mistakes, so a deployment might fail or behave unexpectedly due to incorrect indentation. Other manifest issues include missing required fields, invalid API versions or mis-specified container images. In practice, these schema and syntax errors cause the kubectl or helm step in Jenkins to error out.
Common manifest mistakes include incorrect indentation, missing fields and wrong API versions. These errors often lead to denied or incomplete resource creation.
YAML linting is a must. Use tools like yamllint or kubeval in your pipeline to catch these issues before deployment. For instance, kubectl apply –dry-run=client can quickly flag an invalid manifest.
By validating every YAML file (via editors or CI steps), you prevent subtle mistakes. Storing manifests in Git under version control is another key practice. Keep all Kubernetes configs in a repo so changes are tracked and reviews catch typos before they hit the cluster. With manifest versioning and linting, Jenkins can fail fast on bad configs rather than rolling out half-broken pods.
Environment Variable and Configuration Mismatches
Kubernetes pods often rely on environment variables or ConfigMaps injected by the pipeline. A mismatch here can break deployments even if the image builds successfully. Common issues include referencing an undefined variable, misspelling a key, or using the wrong value for a given environment. For example, a staging pipeline might pass a development DB URL or omit a required API key, causing the application to crash on startup.
Pipeline vs. runtime config drift: Ensure that the Jenkins pipeline’s environment and the Kubernetes manifest agree on names and values. Using different variable names (e.g. DB_URL vs DATABASE_URL) or forgetting to set a critical secret can bring down a service.
Jenkins environment pitfalls: By default, Jenkins exposes many build parameters and node labels as environment variables, which can accidentally override or leak into your container environment. Misplaced withEnv blocks or global vars can introduce wrong values.
Crucially, avoid exposing sensitive variables carelessly. As Verifa notes, passing secrets as plain environment variables is the easiest approach, but “Jenkins does not know they are secrets and hence handles them as normal environment variables while logging, printing etc., making this approach a less secure one”. In practice, if you stick secret values in env blocks, they might end up in console logs or build caches. Instead, use Jenkins’s credentials store or the Kubernetes Credentials Provider plugin. Store API keys and passwords in Jenkins credentials rather than raw env vars. This way, even if you reference them via withCredentials steps, they’re masked in output and less prone to misconfiguration.
Versioning and Image Tagging Issues
Deployment failures can also stem from version mismatches. A common mistake is using floating tags like :latest for container images. While convenient, latest is unpredictable: the pipeline might pull a different image version each time and bypass testing. Security and reliability experts strongly advise against it: “Avoid using ‘latest’ tags for container images. Instead, pin your images to specific versions”. Pinned tags ensure the pipeline deploys a known artifact, reducing surprises.
Other versioning pitfalls include mismatched Helm chart versions or API deprecations. For instance, if your manifest is written for Kubernetes v1.22 but the cluster is v1.18, resources may fail. Always align your pipelines with the cluster’s supported versions and regularly upgrade the cluster. Komodor recommends updating Kubernetes to the latest supported releases and testing backwards compatibility. Likewise, coordinate application versioning: automating image version bumps or using commit hashes can prevent deploying stale code. In short, ensure that the versions in your pipeline, repo and cluster all match up.
Unsafe Deployment and Rollout Strategies
Even a perfect manifest can cause downtime if your rollout strategy is reckless. By default, a Kubernetes Deployment does a rolling update, but if you don’t configure readiness checks and rollout parameters, pods may start serving traffic prematurely or all at once. Common missteps include deploying without any readiness or liveness probes or using a Recreate strategy on production workloads. Without readiness probes, Kubernetes can mark a pod available before the app inside is fully ready, sending live traffic into a startup gap.
Teams should implement safer deployment patterns. Zero-downtime techniques like Blue/Green or Canary releases let you validate a new version with a subset of traffic before cutting over. If your pipeline simply swaps out every pod with a new version simultaneously, a bad build could take down the service completely. Instead, configure smaller batch sizes (maxSurge, maxUnavailable) and consider using service meshes or ingress canaries. For example, deploy a new pod with a test label and route a fraction of traffic to it while keeping existing pods alive. Similarly, always include rollbacks: have your pipeline monitor initial pod health and abort on failure. Kubernetes supports automatic rollback on failed rollouts. Neglecting these practices, essentially using an unsafe rollout, has caused outages for many teams. In summary, embed health checks and progressive strategies in your pipeline so that bad releases are contained and reversible.
Missing Validation and Testing Gates
A surprisingly common cause of deployment failures is the lack of CI/CD quality gates. Many Jenkins pipelines skip thorough testing or manual approvals, allowing bad code or config to slip into production. A quality gate is an enforced check that code or artifacts must pass before the pipeline proceeds. Without them, even a typo or failed unit test can end up in a deploy step.
Advanced teams include stages like linting, unit tests, integration tests and static analysis. For example, a “lint and build” stage should ensure your code compiles and meets style/security policies. InfoQ explains that pipelines should have an initial setup step with linters and style checks, so that “code is not deployed where it does not meet these appropriate linting standards”. In practice, integrate tools like linters (for both code and YAML), unit test suites and security scanners as Jenkins pipeline stages. Only if all these passes should Jenkins continue to build the Docker image and apply Kubernetes changes.
When teams omit these gates, they often discover problems only in production. Incorporate automated testing (unit, integration, end-to-end) at every commit and use Jenkins to fail early on any error. Optionally, add manual approval stages for high-risk deployments. By enforcing these gates, you catch misconfigurations and bugs long before they reach users. In short, effective validation stops invalid deployments by design.
Secrets and Credentials Misconfiguration
Managing secrets is another area ripe for misconfiguration. A pipeline might reference missing secrets or misapply them, leading to pods that crash trying to access credentials. For example, using an incorrect secret name, wrong key, or failing to create the Kubernetes Secret entirely will cause environment variables to be empty. Likewise, storing secrets insecurely can cause breaches.
To avoid these issues, do not hardcode secrets in your Jenkinsfile or manifest YAML. As we saw, exposing secrets as plain env vars is insecure. Instead, use Kubernetes Secrets and bind them properly in your manifests (e.g. valueFrom: secretKeyRef) and ensure the secret exists beforehand. In Jenkins, take advantage of the credentials plugin. Best practice is to keep secrets in Jenkins’s Credentials Store or an external vault. Inject them into your build or deployment steps via secure bindings so they never appear in logs. For instance, use withCredentials blocks or the Kubernetes Credentials Provider plugin to fetch secrets at runtime. Always audit that your pipeline only passes secrets through encrypted channels. A well-configured pipeline will validate that each needed secret is present and will fail early if not, preventing a blind deployment with missing data.
Best Practices for Jenkins and Kubernetes Pipelines
Avoiding misconfiguration is largely a matter of process and tooling. Here are key recommendations:
Version Control Everything: Store all Jenkinsfiles, scripts and Kubernetes manifests in Git. Review and test changes via pull requests. Tracking config changes enables fast rollback if a deployment starts failing.
Use Immutable Artifacts: Build images once and tag them with immutable versions (for example, the commit SHA or a semantic version). Do not rebuild “on the fly” in production. Pin image tags in the manifest to avoid pulling unpredictable code.
Lint and Validate: Integrate YAML and code linters in the pipeline. Run kubectl apply –dry-run=client, kubeval, or similar tools to catch schema errors before deployment.
Automated Tests: Include unit, integration, and (if possible) smoke tests in your Jenkins pipeline. Fail the build on any test failure. Implement “pipeline as code” so these stages run on every commit.
Secure Secrets: Leverage Jenkins credentials and Kubernetes Secrets correctly. Do not log secret values. Use HashiCorp Vault or cloud KMS for additional security and ensure RBAC so only the pipeline can access them.
Safer Deployments: Configure readiness and liveness probes for your pods. Use deployment strategies that allow gradual rollouts (canary, blue/green). Monitor new pods during rollout and have an automated rollback path.
Keep Tools Updated: Regularly upgrade Jenkins, its Kubernetes plugin and Kubernetes itself. Using deprecated APIs or plugins can cause pipeline steps to break in subtle ways.
Continuous Monitoring: Finally, add post-deployment validations or observability checks. For example, run end-to-end smoke tests after deployment or use monitoring alerts as a gate to halt further rollouts.
By applying these practices, you harden your pipeline against misconfiguration. Remember that pipelines are code too – review them just like application code, write tests for them and treat failure scenarios as first-class cases.
Conclusion
Even for experienced DevOps engineers, pipelined deployments can fail in surprising ways when a detail is misconfigured. In Kubernetes-centric pipelines using Jenkins, common culprits include bad YAML in manifests, mismatched environment settings, version drift, unsafe rollouts, missing tests and sloppy secret handling. By systematically addressing each of these areas, for example, linting manifests, enforcing CI gates and securing credentials, you can drastically reduce deployment failures. The goal is to shift left: catch errors in the Jenkins pipeline before they reach the cluster. With diligent validation and best practices, your teams can make CI/CD pipelines an asset rather than a liability. In the end, robust pipelines mean more reliable deployments, less firefighting and safer, faster delivery of software.
Veracode today updated its risk management tool to provide integration with Kubernetes runtime environments, increased integration with code repositories to make it simpler to identify the origin of vulnerabilities and, available shortly, an ability to add tags and classifications to help streamline remediation efforts.
In addition, Veracode is now providing early access to Veracode Package Firewall, which makes use of Open Policy Agents (OPA) to enforce policies that prevent the usage of open source software dependencies that have known vulnerabilities using technology the company gained with the acquisition of Phylum earlier this year. It is scheduled to become generally available in June.
Derek Maki, VP product and GM at Veracode, said both additions to the company’s portfolio will enable DevSecOps teams to better secure software supply chains at a time when they are increasingly being targeted by cybercriminals who have developed coding expertise.
The latest extensions to Veracode Risk Manager (VRM), for example, now makes it possible to provide more real time context about threats in container applications both before and after they have been deployed in a runtime environment as part of a larger effort to improve application security posture management (ASPM), he noted.
While a lot of progress has been made in terms of adopting best DevSecOps practices, there remains much work to be done, noted Maki. There has been too much emphasis on shifting responsibility for application security solely onto the shoulders of application developers, he added. Instead of shifting that responsibility as far left as possible to application developers, organizations need a more balanced approach that makes it easier to, for example, identify vulnerabilities in production environments that are actually exploitable, Maki said.
Otherwise, cybersecurity teams wind up creating long lists of vulnerabilities for application developers to investigate that, in the final analysis, reduce the amount of time they have available to write additional code, he added.
Unfortunately, many DevSecOps teams are now trying to analyze data being generated by, on average, 45 different tools that are being employed across multiple silos within their organization, said Maki. The end result is an overwhelming amount of telemetry data that is too difficult for DevSecOps teams to analyze in any meaningful way with a tool such as VRM, he added.
Each organization will need to determine how best to apply limited DevSecOps resources as they best see fit, but the one certain thing is the amount of code moving through their pipelines is only going to exponentially increase in the age of generative artificial intelligence (AI). Not all that code will make it into a production environment, but it will need to be tested for vulnerabilities that could be introduced at multiple points of the software development lifecycle (SDLC).
The challenge, as always, is finding a way to eliminate as many issues as early as possible without inundating application developers who are not cybersecurity experts with a stream of alerts that, because they are not likely to comprehend, will simply be ignored.
Writing kernel-level code is hard. It is one of those pieces of software that brings the size-to-complexity ratio to its absolute max, with a relatively compact codebase being the foundation for running any other software on every type of platform. And it is not just understanding how the kernel works which is hard; it is what happens when the code doesn’t work. There isn’t a single kernel developer in the world who hasn’t crashed their system on several occasions during development. And like in any software being written, no matter how good your testing process is, bugs will sometimes slip into production. If you are wondering how bad a kernel bug could be — July 19, 2024 provided a painful example.
The Appeal of Writing Kernel-Level Code
The July 19 IT outage happened because of a kernel bug in Windows, originating in a faulty update by a popular security vendor. You might ask yourself, how is it possible that a security vendor, which is not directly responsible for writing the Windows kernel, has created a code that crashes it? Why are they writing kernel code to begin with, and why hasn’t Microsoft prevented this in some manner?
The short answer is — yes, writing kernel code is hard; yes, you shouldn’t do it in 99.9% of the cases. But there are a lot of things you can only do from the kernel level. Security agents are a good example — high privileges are needed to detect threats and prevent them as they manifest. Observability and networking tools are another example, where routing traffic or observing process memory is not available from outside the kernel.
And so, companies turned to writing kernel modules, aka drivers. These are custom pieces of software that extend the kernel, allowing vendors to insert their own logic into the system, which executes as one with the operating system. And that’s where the trouble begins, as Microsoft — or any other vendor for that matter — can’t be responsible for testing third-party code. Or can they?
Rethinking the Ecosystem
The root issue with kernel modules is the fact that they are given the same amount of trust as the actual kernel, even though they are a non-critical extension of the operating system. Could there be a way to provide all the benefits of extending the kernel, while assuring safety for critical systems?
Enter eBPF — a game changer in writing kernel-level code. eBPF is a way to allow developers to write code that will execute in the kernel in a controlled manner; it has all the benefits of kernel modules, without the risks. It is getting widely adopted by security, networking and observability practitioners.
eBPF is so groundbreaking that it is not even just about kernel modules. User-level tools such as network sniffers or APM libraries are also beginning to be outperformed by eBPF equivalents. It is one of those things that make you question years of previous technologies and solutions. It is mind-blowing.
Are Kernel Panics a Thing of the Past?
eBPF is revolutionary, but it will not solve every kernel-level problem. For example, some security tools require certain actions that the eBPF sandbox can’t provide. And this means we will still be seeing a lot of unsafe kernel code in the foreseeable future. But the word is out there, and every developer writing kernel code should proactively make this change. The landscape is changing and it will be safer and more efficient. Trust me on this one.
Technology is advancing faster than ever before and puts pressure on organizations to quickly update their digital strategies, or else they risk falling behind and becoming irrelevant. By adopting cloud-native technologies, modern infrastructure shifts are enabling organizations to scale beyond premises to take advantage of the enhanced flexibility and capacity of the cloud. It’s a cautionary tale though. This rapid adoption has led to expanded attack surfaces in the estate, making applications more vulnerable to security risks, which could negatively impact an organization’s reputation or revenue. This rapid transformation has left technologists without the necessary tools and insights to achieve full visibility into their new hybrid infrastructure.
As a result, organizations are experiencing an uptick in security threats within their Kubernetes environments. According to Red Hat, 90% of businesses have experienced at least one Kubernetes-related security incident in the last 12 months, which led to revenue or customer loss for 37% of respondents. Additionally, Aqua Security investigated Kubernetes clusters belonging to more than 350 organizations, open-source projects and individuals, and found that all of them were unprotected, with at least 60% breached.
Successful management of modern application infrastructures requires unified visibility, which is limited in traditional approaches to application security and vulnerability monitoring. To address the rising vulnerabilities, developers and security teams must first stop operating in siloes by ensuring they are collaborating throughout the application development process. Teams must also consider adopting new solutions that will provide them with a more unified view of a fragmented application infrastructure. This will enable them to quickly identify vulnerabilities within the IT estate, the likelihood of exploitation and their business risk.
Business Risk Observability is Key
Full visibility into hybrid infrastructures is crucial for supporting the secure development and deployment of modern applications. Technologists need a comprehensive overview of security threats, including their location and insight into how they could affect the application. By spotting and correlating potential security risks across different application entities, such as business transactions, containers, pods, services and workloads, technologists can quickly attend to the issue and reduce mean time to remediation (MTTR).
However, business context expands upon this traditional security data. In addition to providing the visibility required to locate and assess security threats, business context helps technologists prioritize and remediate risks based on potential business impact.
Business risk observability combines application performance data and business context with vulnerability detection and security intelligence, making it possible to identify business risks. With business risk observability, technologists can generate a business risk score for all vulnerabilities to help teams prioritize issues based on the severity of issue that could cause the most damage to the business’s financial or reputational aspects.
Fundamentally, business risk observability unifies applications and security teams around a central repository for comprehensive data on application availability, performance and security. In an age defined by zero-day threats, necessitating cross-functional collaboration for secure deployments of contemporary applications, business risk observability establishes a framework for implementing a DevSecOps approach within the IT department. By integrating security into the application lifecycle from its inception, development teams adhere to the organization’s most critical security priorities and embed robust security measures into every line of code. This culminates in fortified applications and simplified security management, pre-release, during deployment and post-release.
The Adoption of Business Risk Observability is Gaining Momentum
The shift to hybrid and cloud-native infrastructures has led to more vulnerable landscapes, thereby propelling the demand for business risk observability. The shift to a security approach for the full application stack, a Cisco study, found that 93% of technologists now recognize the significance of contextualizing security and prioritizing vulnerability fixes based on potential business impact.
To address the higher threat levels in Kubernetes environments, it is essential for organizations to embrace innovative solutions and ways of working. Gartner projects that 95% of new digital workloads will leverage cloud native platforms by 2025, which means the challenges of fragmented infrastructures are likely to grow. As the fallout from a potential security breach could be detrimental to a business, organizations should strongly consider implementing an observability solution.
The modern IT estate is becoming more vulnerable to security threats and technologists need a key form of defense — unified visibility and business context. Business risk observability serves as a key form of defense for organizations, empowering IT teams with the ability to monitor, prioritize and respond to security issues swiftly, expediting response times and safeguarding their organizations and customers consistently.
If you’re among the DevOps who made that move, you have been rewarded with OpenTofu 1.7.0. The release’s major highlight is the introduction of end-to-end state encryption. This feature ensures that a state file remains shielded from unauthorized access across any storage backend.
While that capability matters to anyone doing DevOps, it notably works hand-in-glove with DevSecOps. With Terraform, you were strongly encouraged to use HashiCorp Vault as a centralized secrets manager. With this OpenTofu release, you can secure encryption passphrases through environment variables or opt for robust key management systems such as AWS Key Management Service (KMS), GCP KMS, or OpenBao, the open-source Vault fork.
OpenTofu lacks a policy-as-code enforcement framework, which HashiCorp Sentinel provides for Terraform. For OpenTofu, it would be best to use third-party, open source programs such as Open Policy Agent (OPA) that can embed security policies directly alongside an OpenTofu configuration. You can then store your OpenTofu and OPA configurations in a version control system like Git. This ensures that infrastructure changes are tracked and auditable and that they can be easily rolled back if necessary.
Another innovative addition in OpenTofu 1.7.0 is dynamic provider-defined functions. This allows providers to supply resources and offer native functions that can be used directly within OpenTofu code. An OpenTofu-exclusive feature lets these providers dynamically create custom functions based on user configurations, fostering a seamless integration of other programming languages. The OpenTofu team encourages users to explore this feature with the experimental Lua and Go providers.
Additional features are also included. Among them is the ability to mark specific resources for removal from the state file while retaining the underlying infrastructure. The new OpenTofu version also introduces loopable import blocks to simplify the bulk import of resources, greatly aiding large-scale migrations.
Building on its legacy as a drop-in replacement for Terraform 1.5, OpenTofu 1.7.0 promises easy migration paths, offers detailed migration guides, and includes comprehensive documentation with examples. That suggests an easy upgrade if you’re using Terraform for DevSecOps.
Since its inception, the OpenTofu community has seen remarkable growth. Despite eschewing user tracking, the registry’s usage has surged to over a million requests daily, with a doubling in just the past month. The release has drawn 65 unique contributors and garnered 20,000 stars on GitHub, underscoring a vibrant community engagement with over 200 new issues and numerous pull requests since January.
In short, OpenTofu appears to be a solid choice for both IaC and DevSecOps deployments, regardless of what happens with Hashicorp, IBM and Terraform.
Things are improving for IT at a rate we haven’t seen since the first wave of container adoption. We have massive automation in the entire SDLC—with AI-based plug-ins for IDEs to help developers write code that is both higher quality and more secure, security deeply integrated into the DevOps toolchain and the unification of testing/security tools across the SDLC. We are once again turning out more code of higher quality faster than we were just a year ago.
And what is finally starting to catch up is data. I love the current iteration of data virtualization technology, where it can be set to move from region to region or cloud to cloud at leisure in the background. At the same time, data that is accessed in the interim can be instantly transferred. I used to cover storage and data, and frankly, this is the dream world.
But it doesn’t change the fact that data location matters. While bulk moving data to its final destination will be useful, separating data from applications that access it is simply adding another weak link in the application infrastructure chain.
This is where the true strength of containers and Kubernetes come in. With Kubernetes, we can put containers with the entirety of our apps into the environment where our data resides. And that means that our application infrastructure is consolidated and that, in a pinch, both application and data can be moved anywhere–because Kubernetes is truly portable (as long as you don’t use customization features of some vendors/platforms anyway).
The environments we currently choose to use for enterprise applications–from mainframe to public cloud and everything in between–all are capable of running containers, and while there are still deployment differences, customizing a bit to move an entire application is far better than rewriting entire apps to target a new host environment. And the amount of retargeting required is constantly going down.
So, decide where you would like to host your solution, use data virtualization to move the datasets there, spin up your apps in Kubernetes at that location and enjoy the fruits of your labors. Mergers, acquisitions, moves from one architecture to another, moving from public cloud vendor A to public cloud vendor B … All made far easier by data and Kubernetes portability.
While people like to call it “cloud,” what we really should be calling it is “portable.” Whichever marketing person decided that cloud included Kubernetes is my sworn enemy, btw. Because the cloud is used without including Kubernetes, so of course, that just confuses the issue. Portable programming is a far better description of data mobility and Kubernetes architecture used in tandem. Doesn’t need a cloud at all.
And we’re headed there for even more productivity. Just pick where to move it and carry on. We do indeed live in pretty cool times, and you all are the ones making it real. Keep up the good work.
It’s that time of year when pundits start to crank out their predictions for the next twelve months! I’ve been asked to contribute to a private group (and occasionally, Techstrong Group asks me to contribute to their annual list), so I won’t thrill you with my predictions just yet; but I will discuss the cycles and trends that previous predictions have shown.
Back when I was testing physical servers, we thought of throughput bottlenecks in terms of where the problem was. The circle would go disk->memory-> CPU, and in the case of things like NAS, insert network in there somewhere, too. When one bottleneck was resolved, another would crop up. And users will always seem to be pushed to the next bottleneck.
We see similar cycles in DevOps. First, Agile made development faster, and that caused us issues throughout the rest of the process. Then, DevOps helped with the build and a little with the testing and deployment steps, but in the early days it was more standardization than speeding up. And since then, we have been in that cycle. We’re seeing GitOps speed up and automate deployment and upgrades—based upon the automation that came before—we’re seeing test and security tools feeding directly into the IDE to speed resolution, we’re seeing container automation cause “cloud-first development” (I hate that name; Kubernetes has cloud-like interfaces, but is not precisely cloud) to be fully automated, and thus faster.
And we’re looking at that cycle continuing. No doubt you will hear a lot of predictions that start with “AI …” For the most part, AI is a tool and/or technique. Listen for what it is improving because it is doing very little that’s actually new. (Delete list of things that sounded alarmingly like those predictions I said I wouldn’t make.)
All in all, we are still living in a very cool technological time. We can have a tool generate code snippets of the dull work for us so we can focus on the important bits. Some shy away from this use of “AI,” but honestly, we already use libraries to do the grunt work—I haven’t written to a screen buffer in forever—because we don’t have to. Same story—use the tools that make you productive. Some of the more obscure bits of Linux command lines are far better dealt with by asking an AI to give me examples than searching through tons of docs across several platforms. Never was much of a fan of man output for complex commands, this makes it easier. The nice bit is that bash and UNIX utilities don’t change much over time, so answers can be a bit dated and perfectly accurate. That’s not true for much of IT.
The environment has consistently gotten more complex, while the building blocks have gotten easier to use. This allows things to keep moving and changing while it offers us better ways to serve the organization’s needs. This does change at some point—infinite change is indeed a thing, but any technology does have its limits—but I honestly can’t see the point at which we are content with our IT tools and stop looking for more. Oh, most organizations go through those cycles—organizationally, once an infrastructure and process works correctly, it is likely to hang around until better is found—but the industry will keep changing.
And you’ll keep learning and changing. That’s one prediction I will make for next year. Teams and IT staff will grow and learn new things, because at its heart, that is what we do. We learn new things and keep the lights on. In good years, we offer sweet new tools and functionality to the company or our customers. But either way, we keep things online. Year after year. You all rock, so that’s an easy prediction.
Observability is becoming a keystone of contemporary DevOps practices. Even departments that weren’t traditionally a part of DevOps are seeing the benefits of being brought under the auspices of observability teams. In 2023, however, organizations are finding that the road to adoption is bumpier than expected. Here are seven of the biggest challenges DevOps teams face with observability and some suggestions for mitigating them.
Increasing MTTR
MTTR, or mean time to recovery, is the time it takes to get a system back up and running after an outage or bug. A longer MTTR means more downtime and poorer service for clients. Worryingly, the DevOps Pulse Report indicates that the average MTTR is increasing. This year, 73% of its respondents reported an MTTR of multiple hours; last year’s figure was only 64%.
MTTR often results from an inability to diagnose incidents due to data siloes impairing observability. This can be improved by an observability platform that allows engineers to see the big picture.
Costs of Telemetry Data
Along with increasing MTTR, many organizations have to deal with costs incurred by high telemetry data volumes. It’s a big problem. An IDC survey of 200 companies found that 53% of respondents highlighted the costs of storing log data.
Much of the problem is due to an outmoded tiered pricing model. Many vendors charge per GB of data, so if your data volumes fluctuate, so will your data costs. They also have obscure pricing models, meaning many organizations find it difficult to know what they’re paying for. At Coralogix, we’ve created a new business model that is one-third of the cost of standard log storage solutions.
Tool Sprawl
To understand why this is a challenge, we need to answer the question: What is observability? Effective observability requires integrating data from every aspect of your application. Because many organizations implement monitoring with multiple tools, they suffer from tool sprawl. This has the effect of siloing telemetry data, making it harder to correlate data and extract insights into system performance.
There are a range of options for mitigating tool sprawl, such as thoroughly evaluating a tool’s costs and benefits before including it in your DevOps strategy. The most effective solution is a “single pane of glass” tool that combines insights synoptically on a single dashboard.
Kubernetes Complexity
Elastic reports that organizations are increasingly turning to cloud-based solutions such as Kubernetes for their DevOps. Kubernetes can supercharge organizations with its ability to dynamically scale infrastructure as needed, eliminating the cost overheads of dedicated servers.
However, Kubernetes is complex and comes with its own set of challenges. Kubernetes’ scalable architecture comes from containerization, a paradigm in which applications are hosted in objects called containers. This means that developing in Kubernetes requires the ability to work with a lot of spinning plates.
A good way to combat this is better training in organizations. Additionally, breaking down silos allows different teams to transfer knowledge.
Security Challenges
Kubernetes’ popularity brings security challenges. These can include privilege escalation, where a user manages to gain privileges such as write access, and security misconfigurations, where developers forget to change the non-secure default configurations.
There are several strategies for mitigating Kubernetes security risks. These include scoping roles to particular namespaces, using service meshes, and enhancing security with Coralogix’s Kubernetes Operator.
Beyond Kubernetes, there’s the larger issue of integrating security into an observability strategy, which is becoming a challenge for an increasing number of IT businesses. To counter this, more and more businesses are starting to incorporate observability and security monitoring under a single umbrella. Solutions such as infrastructure and application metrics can enhance security and monitoring.
Scaling Platforms
To meet the challenges posed by rising data costs and increasing cloud complexity, businesses are turning to open-source solutions. These come with their own challenges, however. According to the DevOps Pulse Report, around 30% of enterprises surveyed had problems with infrastructure management, scaling and upgrading relevant components. Because many open-source platforms require specialized knowledge to maintain, businesses have trouble sourcing the skills and expertise for them.
Tools such as OpenTelemetry can make scaling easier by integrating with platforms such as Coralogix.
Troubleshooting Data Pipeline Performance
Implementing observability requires having a reliable and high-performance pipeline for telemetry data. However, organizations using open-source platforms often have trouble monitoring and troubleshooting the performance of their data pipeline. This can impair observability as telemetry data is of lower quality.
Data engineer Abraham Alcantara suggests ten key steps to troubleshoot data pipelines successfully. These include identifying data pipeline software and infrastructure, reproducing and isolating issues and automating issue scenarios. Another strategy is to apply machine learning, such as Coralogix uses.
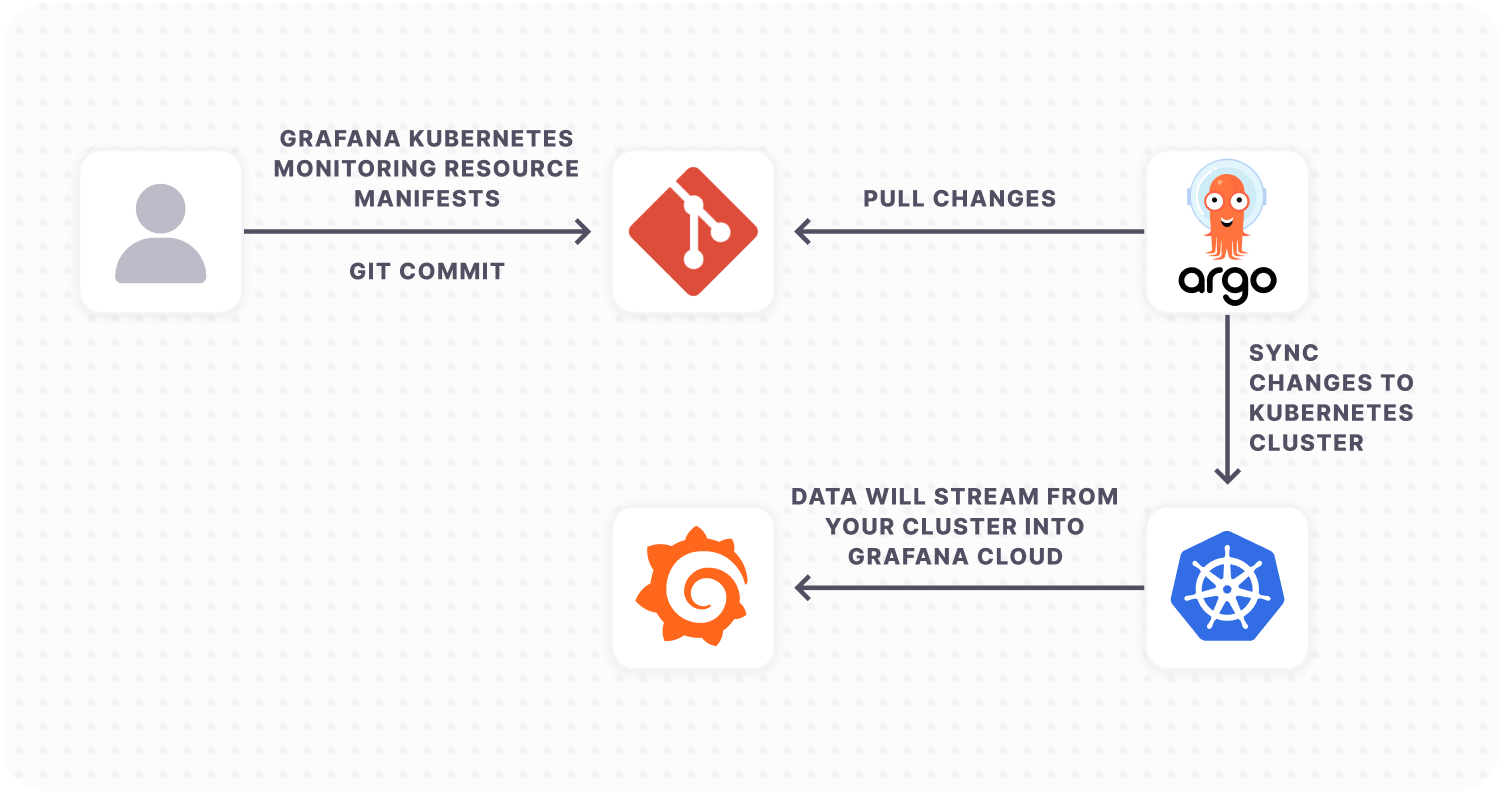
But what’s an easy way to add resources to your cluster while using Kubernetes Monitoring? ArgoCD has become the established tool for implementing GitOps workflows, simplifying the process of deploying and managing Kubernetes resources. If you are using Argo CD to manage your Kubernetes deployments, you can easily configure Grafana Cloud’s Kubernetes Monitoring solution to work with your cluster.
In this blog post, we’ll walk you through how to use Argo CD to configure Kubernetes Monitoring in Grafana Cloud.
What is Argo CD?
Argo CD is a declarative, open source GitOps continuous delivery tool that helps to automate the deployment of applications to Kubernetes clusters. It provides a centralized and standardized way of managing Kubernetes resources in large and complex environments. By using Argo CD, users can easily manage their Kubernetes resources and applications using Git repositories, allowing for version control and auditability.
Argo CD’s key features and capabilities include the ability to manually or automatically deploy applications to a Kubernetes cluster; automatic synchronization of application state to the current version of declarative configuration; a web user interface and command-line interface; and the ability to detect and remediate configuration drift. It also has role-based access control (RBAC), which allows for multi-cluster management, single sign-on (SSO) with various providers, and support for webhooks that trigger actions.
Why pair Argo CD with Kubernetes Monitoring in Grafana Cloud?
Kubernetes Monitoring in Grafana Cloud simplifies monitoring your Kubernetes fleet by:
Deploying Grafana Agent with useful defaults for collecting metrics that aid in cardinality management.
Providing custom queries to collect useful logs.
Offering preconfigured dashboards, alert rules, and recording rules for users to plug into their existing infrastructure.
But there is some manual effort required to deploy the necessary resources for Kubernetes Monitoring in Grafana Cloud. Users have to copy the configurations and run the commands, which are outlined in Grafana Cloud. While easy enough to do, this process can quickly become error-prone, especially in larger, more complex environments where multiple teams may be deploying resources across multiple clusters. Plus each change must be verified and deployed to each cluster by hand.
As a result, GitOps tools like Argo CD can help to automate Kubernetes resource deployment. Argo CD takes a declarative, GitOps approach to Kubernetes resource management, allowing for automated and standardized deployments across multiple clusters. This method not only saves time, but also reduces the risk of deployment errors and inconsistencies.
There are three key advantages to deploying Kubernetes Monitoring with Argo CD:
You’ll use a GitOps-based approach to manage resources required by Grafana Cloud’s Kubernetes Monitoring solution.
It’s easier to make changes in a controlled environment to Grafana Agent configuration and resources.
The Git repository would be maintained as a single source of truth for your Kubernetes resources.
Prerequisites for configuring Argo CD with Grafana Cloud
Before you begin, make sure you have the following available:
Argo CD installed and running in your Kubernetes cluster
Metrics and events: Deploy Grafana Agent ConfigMap and StatefulSet
Create Grafana Agent ConfigMap
Note: The default scrape interval is set to 60s. Scrape intervals lower than 60s may result in increased costs (DPM > 1). To learn more, see our documentation on active series and DPM.
Replace
${NAMESPACE} with your namespace
${METRICS_USERNAME} with Prometheus Instance ID
${PROMETHEUS_URL} with the push endpoint URL of the Prometheus Instance
${LOGS_USERNAME} with Loki Username ${LOKI_URL} with the push endpoint URL of the Loki Instance
${GRAFANA_CLOUD_API_KEY} with your Grafana Cloud API Key
Paste the following script into your shell and run it to create the metrics Agent ConfigMap configuration file.
This ConfigMap configures the Grafana Agent StatefulSet to scrape the cadvisor, kubelet, and kube-state-metrics endpoints in your cluster. It also configures Grafana Agent to collect Kubernetes events from your cluster’s control plane and ship these to your Grafana Cloud Loki instance. To learn more about configuring Grafana Agent, see our Grafana Agent configuration reference docs.
Create Grafana Agent StatefulSet
Replace ${NAMESPACE} with your namespace and paste the following script into your shell and run it to create the configuration file for metrics Grafana Agent StatefulSet.
kube-state-metrics watches Kubernetes resources in your cluster and emits Prometheus metrics that can be scraped by Grafana Agent. To learn more, see the kube-state-metrics docs.
Replace ${Argo CD_NAMESPACE} with your namespace in which Argo CD is deployed and ${NAMESPACE} with the namespace where you want to deploy Kubernetes Monitoring resources. Then paste the following script into your shell and run it to create the configuration file for kube-state-metrics Argo CD application.
Node_exporter
Node_exporter is used to collect host metrics from each node in your cluster, and emits them as Prometheus metrics.
Replace ${Argo CD_NAMESPACE} with your namespace in which Argo CD is deployed and ${NAMESPACE} with the namespace where you want to deploy Kubernetes Monitoring resources. Then paste the following script into your shell and run it to create the configuration file for node_exporter Argo CD application.
Logs: Deploy Grafana Agent ConfigMap and DaemonSet
Create Grafana Agent ConfigMap
Replace
${NAMESPACE} with your namespace
${METRICS_USERNAME} with Prometheus Instance ID
${PROMETHEUS_URL} with the push endpoint URL of the Prometheus Instance
${LOGS_USERNAME} with Loki Username
${LOKI_URL} with the push endpoint URL of the Loki Instance
${GRAFANA_CLOUD_API_KEY}
Paste the following script into your shell and run it to create the logs Agent ConfigMap configuration file.
Replace ${NAMESPACE} with your namespace and paste the following script into your shell and run it to create the configuration file for Logs Grafana Agent DaemonSet.
The ideal setup is to have changes that are made to the main branch of your Git repository automatically synced within Kubernetes. To achieve this, follow the steps below:
Create a folder in your Git repository (For this post, let’s create a folder named kubernetes-monitoring).
Push all the manifest files for earlier steps (metrics.yaml, metrics-agent.yaml, kube-state-metrics.yaml, node-exporter.yaml, logs.yaml and logs-agent.yaml) into the newly created folder.
Argo CD application setup
ArgoCD New App web interface.
In the Argo CD web interface, click on the New App button. Enter a name for the application, such as grafana-kubernetes-monitoring, and select the your desired project name (if there is none, select default) and sync policy as automatic. Select Prune Resources and Self Heal options to ensure configuration in Git Repository is always maintained within the Kubernetes cluster. Also tick the Auto-Create Namespace option and the Retry options.
Under Source, enter the URL for your Git repository along with the revision (by default it is HEAD). Set the path to the folder (kubernetes-monitoring).
Under Destination, enter your cluster URL. If it’s the same cluster where Argo CD is deployed, use https://kubernetes.default.svc and the namespace for creating the application resource. The namespace should be the same as the one where Argo CD is deployed.
Select Directory Recurse as its useful when having configuration files within nested folders
Finally, click on the Create button to create the application.
You can also run the below command to create the Argo CD application that monitors your Git Repository folder for changes. Make sure to replace ${GIT_REPO_URL} with your Git Repository URL; ${Argo CD_NAMESPACE} with your namespace in which Argo CD is deployed; and ${NAMESPACE} with the namespace where you want to deploy Kubernetes Monitoring resources.
Once the application has been created, the Kubernetes manifest defined in the Git repository will be automatically deployed.
Install prebuilt Grafana dashboards and alerts
Note: You must have the Admin role to install dashboards and alerts in Grafana Cloud.
Navigate to your Grafana Cloud instance and in the navigation menu, select Kubernetes under the Monitoring section.
Go to the configuration and click on Install dashboards and alert rules.
The configuration has been already completed, so you can now start viewing dashboards.
Once the metrics and logs from your Kubernetes cluster are being ingested into Grafana Cloud, you can:
Easily navigate around your Kubernetes setup using a single UI. Begin with a cluster view and drill down to specific Kubernetes pods with the preconfigured Grafana dashboards.
Use node observability. Find out more about node health along with pod density and node logs.
Use the cluster efficiency dashboard. Understand your resource usage and use the information for capacity planning and optimizing costs and efficiency.
Stay on top of your cluster. Use the preconfigured Grafana alerts to monitor your fleet.
Next steps for monitoring Kubernetes clusters with Grafana Cloud
Once you have settled into your new Argo CD configuration, you can continue to expand on your observability strategy with Kubernetes Monitoring in Grafana Cloud.
You can leverage the latest integrations available within the Kubernetes Monitoring solution such as Cert Manager, CockroachDB and more. To configure scraping application pod metrics, you can refer to our detailed documentation. And while Kubernetes Monitoring currently covers metrics and logs, to get a complete timeline into data transactions, request durations, and bottlenecks, it is also important to use traces. You can configure your applications to send traces to Grafana Agent, which can then be configured to send that tracing data to Grafana Cloud’s hosted tracing instance.
The easiest way to get started with Kubernetes Monitoring is with Grafana Cloud. We have a generous free forever tier and plans for every use case. Sign up for free today!
devopsy.kinsta.cloud is now providing a weekly DevOps jobs report through which opportunities for DevOps professionals will be highlighted to better serve our audience.
Our goal in these challenging economic times is to make it easier for DevOps professionals to advance their careers.
Of course, the pool of available DevOps talent is still relatively constrained, so when one DevOps professional takes on a new role it tends to create an opportunity for others.
The five job postings shared this week are selected based on the company looking to hire, the vertical industry segment and, naturally, the pay scale being offered.
We’re also committed to providing additional insights into the state of the DevOps job market. In the meantime, for your consideration:
LinkedIn
Harris Allied
New York, New York DevOps Engineer
$160,000 to $175,000