Tag: KubeCon

  • Making SBOMs Actionable

    Making SBOMs Actionable

    A software bill of materials (SBOM) is a list of all the software components found in a given codebase or used in a given software build. Great. So, now what? Why do we even care about SBOMs?

    Those are great questions—because in and of itself, the SBOM doesn’t really do anything; it is simply a means to an end. That end being greater software security and a more secure software supply chain.

    Let’s take one step back to understand why there is such a sudden and urgent demand for SBOMs. The most recent ‘big bang’ attack on the software supply chain was the Apache Log4j flaw, discovered in December 2021. That vulnerability opened the doors to countless breaches and caused billions of dollars in damage. Before that, the high-profile hacking of SolarWinds caused similar damage.

    Now, will the SBOM prevent that from happening (again)? No. However, what an SBOM can do is tell you exactly where these kinds of vulnerabilities exist in software and enable you to quickly patch your systems or block exploits. Having a software bill of materials enables you to quickly assess the risks in your codebase and mitigate them as needed.

    It’s strongly recommended that you use dynamic SBOMs (versus static) that are automatically updated to the latest SBOM information and provide extensive search capabilities as part of an SBOM database. That allows for immediate identification of a specific dependency version, like the Log4j case. Some solutions also update the SBOM information based on the runtime (like Docker or Kubernetes). That way, you know not only if some component is used, but also where.

    SBOMs are an invaluable tool as they allow an audit of licenses, libraries, modules, applied patches and other components to look for weaknesses. However, for such an audit to reliably trace the components used to build the software, the SBOM must have certain attributes.

    • Unique identities for each software component
    • Separate identities (independent of those used internally in the organization) to identify each machine and user involved in the development process
    • Timestamps to facilitate traceability of each change or component incorporation

    Additionally, from a security point of view, a key element necessary for the reliability of the SBOM is to prevent unauthorized changes to it. And the most effective way to do this is by using an immutable ledger that records a history of when each change was made.

    Once the reliability of an SBOM is assured, DevSecOps teams can use it as part of their threat scanning toolbox and, therefore, improve software security.

    There is no doubt that SBOMs should be requested from your software vendors and that you should consider creating SBOMs along with your own developed software. It’s all about the proper storage of the SBOMs so you can be sure they’re recent, searchable and trustworthy and tamper-proof.

    The benefits and use cases for SBOMs are numerous; they vary across stakeholders who produce, choose and operate software and are amplified when combined. Use cases for SBOMs include better software development, supply chain management, vulnerability management, asset management and high assurance processes. The benefits include reducing cost, mitigating security risk, license risk and compliance risk.

    But the key is making the SBOM actionable.

    No developer, no software maintainer or DevOps engineer wants to manually collect the dependencies and produce SBOM documents. It needs to be fully automated within the software build and deployment pipeline and there needs to be a proactive check of where it’s currently running.

    The most efficient approach to work with a pervasive SBOM policy is to have them generated as a byproduct of a modern development CI/CD process.

    In today’s complex development environments, it is imperative that SBOMs can be shared frictionlessly between teams and organizations as a fundamental part of software management transparency. This transparency model is supported by the ISO association through its OpenChain Specification, and it is part of an effort to improve security in the digital industry.

    There are two SBOM specifications: The Software Package Data Exchange (SPDX) backed by the Linux Foundation and the CycloneDX specification managed by the CycloneDX Core working group. For more details, have a look here.

    Make sure to choose the SBOM standard that makes the most sense for you and stick to that for all of the software developed or used in your infrastructure. The test of whether your SBOM is actionable will come when the next Log4j moment arrives. You should be able to pinpoint the existence and the location of the component in question to mitigate risk effectively.


    To hear more about cloud-native topics, join the Cloud Native Computing Foundation and the cloud-native community at KubeCon+CloudNativeCon North America 2022 – October 24-28, 2022

  • Sysdig Introduces Sysdig Advisor to Drastically Simplify Kubernetes Troubleshooting

    Single view of performance and events accelerates Kubernetes troubleshooting by up to 10x

    VALENCIA, SPAIN, (KubeCon + CloudNativeCon Europe), May 16, 2022 — Sysdig, the unified container and cloud security leader, announced the availability of Sysdig Advisor, a Kubernetes troubleshooting feature that consolidates and prioritizes relevant performance details in Sysdig Monitor. By providing a single view of performance and event information, Sysdig Advisor enables operations, developers, and site reliability engineering (SRE) teams to troubleshoot issues faster while decreasing the number of tools needed.

    Video: In real-time, watch troubleshooting of the same issue with and without Sysdig Advisor.

    The complexity of Kubernetes – with countless components and variables – makes it extremely difficult to debug problems and prioritize actions. Knowing how to debug, where to begin, or what to look for can be a challenge. Operations teams and SREs are often forced to pull up the command line interface and run tools like kubectl to inspect the situation and search for the root cause. With so many moving parts in Kubernetes-based applications, remediation can take hours or more, decreasing availability and impacting the end-user experience.

    With a click of a button, Sysdig Advisor presents all relevant capacity, event, alerts, and troubleshooting information. Since this information is presented in the context of Kubernetes objects, users can quickly drill down when looking for the source of a performance problem. Sysdig Advisor displays a prioritized list of issues and related live logs to surface the biggest problem areas and accelerate time to resolution.

    Key Benefits of Sysdig Advisor 

    • Accelerates troubleshooting by up to 10x: Sysdig Advisor produces a prioritized list of issues, giving administrators visibility into what problems to address first. When compared to traditional methodologies, teams can resolve Kubernetes issues up to 10x faster with Sysdig Advisor by reducing the time it takes to find critical information, including capacity, utilization, event, and alert data for clusters, namespaces, workloads, and pods. 
    • Reduces troubleshooting resource count: Sysdig Advisor reduces the dependence on a side-by-side comparison of blogs, dashboards, logs, and command line output needed to troubleshoot Kubernetes environments. The simple user interface surfaces all the important details in a single unified tool with a curated, actionable set of steps for remediation.
    • Increases troubleshooting access without increasing security risk: Security teams are often concerned about providing broad access to command-line tools, such as kubectl. Sysdig Advisor provides quick access to the same level of information to users across the organization, without being overly permissive.

    “Kubernetes is complex, with countless components and variables that make it difficult to understand how, why, and when something goes wrong. Any SRE knows the pain of wading through multiple tools and getting multiple teams involved when troubleshooting an alert,” said Loris Degioanni, founder and CTO at Sysdig. “Now with Sysdig Advisor, they can efficiently debug issues and get back to work on deploying new releases.”

    The Sysdig Approach 

    Sysdig is driving the standard for unified cloud and container security so DevOps and security teams can confidently secure containers, Kubernetes, and cloud services. Sysdig offers two products, Sysdig Secure and Sysdig Monitor, and the Sysdig platform architecture underpins both products. Sysdig Monitor provides cloud and Kubernetes monitoring that is fully open source Prometheus compatible. With Sysdig Secure, teams find and prioritize software vulnerabilities, detect and respond to threats, and manage cloud configurations, permissions, and compliance. Sysdig provides a single view of risk from source to run, with no blind spots, no guesswork, no black boxes.

    Availability 

    Sysdig Advisor is available now to Sysdig Monitor users at no additional cost. Additional troubleshooting features will be introduced over the coming weeks.

    Resources

    About Sysdig
    Sysdig is driving the standard for cloud and container security. The company pioneered cloud-native runtime threat detection and response by creating Falco and Sysdig as open source standards and key building blocks of the Sysdig platform. With the platform, teams can find and prioritize software vulnerabilities, detect and respond to threats, and manage cloud configurations, permissions, and compliance. From containers and Kubernetes to cloud services, teams get a single view of risk from source to run, with no blind spots, no guesswork, no black boxes. The largest and most innovative companies around the world rely on Sysdig.

    Media Contact
    Amanda McKinney Smith
    amanda.smith@sysdig.com
    703-473-4051

  • Sysdig Open Source is Extended to Secure Cloud Services

    New integration enables any Falco plugin to be used for Sysdig OSS

    VALENCIA, SPAIN, (KubeCon + CloudNativeCon Europe), May 16, 2022 — Sysdig, the unified container and cloud security leader, announced that Sysdig open source, the incident response standard for containers, has been extended to the cloud. Using system calls, Sysdig open source (Sysdig OSS) traditionally offers deep observability into running applications, as well as file system access and network activity, which speeds incident response and troubleshooting. Teams can quickly filter information from Sysdig OSS and take action. With the announcement of this new integration, these capabilities have been extended beyond containers to any cloud environment.

    The complexity of cloud-native applications – with countless components and variables – makes it extremely difficult for security analysts and system administrators to quickly triage alerts and debug problems. Sysdig OSS captures process, file system, and network activity in real time and with a high degree of granularity. The tool, which has nearly two million downloads and 6,850 GitHub stars, surfaces everything from executed commands and file system activity to network activity. Sysdig OSS then offers advanced filtering and troubleshooting capabilities, supporting root cause analysis for security and performance issues.

    Using a new plugin framework – originally developed by the open source community for the CNCF project Falco – Sysdig extends the number of sources Sysdig OSS can be connected with to anything that generates logs or events, including Azure, Google, and AWS CloudTrail logs. Going forward, every plugin developed for Falco can also be leveraged by Sysdig OSS. Using one tool, like Sysdig OSS, to observe events from the entire cloud-native environment streamlines investigations. Using a different tool for each environment adds complexity, which makes it massively harder to troubleshoot.

    Learn more about this framework in the Sysdig OSS 0.29 new release blog

    Sysdig’s Commitment to Open Source

    Sysdig was founded as an open source company and Sysdig Secure and Sysdig Monitor were both built on an open source foundation to address the security challenges of modern cloud applications. Both projects were created by Sysdig to leverage deep visibility as a foundation for security, and they have become standards for container and cloud threat detection and incident response. Falco, which was contributed to the CNCF in 2018, is now an incubation-level hosted project with more than 45 million downloads.

    Sysdig OSS and Falco can be used together as a powerful open source solution to reduce risk at runtime. Sysdig OSS acts as a flight recorder, capturing a detailed record for inspection. Falco acts as a security camera, continuously detecting unexpected behavior, configuration changes, intrusions, and data theft in real time. Teams can use Sysdig OSS and Falco together to detect and respond to threats.

    “If you want to see what is going on inside an application, Sysdig OSS gives you that record,” said Loris Degioanni, Founder and CTO of Sysdig. “Sysdig open source was the inspiration for Falco. While Falco will monitor and alert based on your policies, Sysdig open source will tell you what happened at a particular time, before and after the event. Having the ability to use both open source tools in the cloud is extremely powerful.”

    Resources

    ●  Read the New Release of Sysdig Open Source Leverages Falco Plugins.

    ●  Find Sysdig OSS on GitHub.

    ●  Join the Sysdig OSS Slack community.

    About Sysdig
    Sysdig is driving the standard for cloud and container security. The company pioneered cloud-native runtime threat detection and response by creating Falco and Sysdig as open source standards and key building blocks of the Sysdig platform. With the platform, teams can find and prioritize software vulnerabilities, detect and respond to threats, and manage cloud configurations, permissions and compliance. From containers and Kubernetes to cloud services, teams get a single view of risk from source to run, with no blind spots, no guesswork, no black boxes. The largest and most innovative companies around the world rely on Sysdig.

    Media Contact
    Amanda McKinney Smith
    amanda.smith@sysdig.com
    703-473-4051

  • How to Secure CI/CD Pipelines With DevSecOps

    How to Secure CI/CD Pipelines With DevSecOps

    Many companies are adopting a DevOps approach in their workflows as IT moves toward a more automated and cloud-native world—but for some industries, this migration isn’t easy. Many of these companies—in finance, health care, government—are obligated to meet compliance requirements. For these organizations, DevSecOps adds necessary security focus to the DevOps methodology.

    Compliance means adhering to certain standards and controls to ensure that applications are secure. But compliance only goes so far. How many applications contain third-party dependencies inside? How expensive would it be for a company in the financial industry, for example, to fail to meet compliance standards?

    Initially, containerizing an application while complying with requirements of whichever framework or standards apply to your organization could seem close to impossible. Within the cloud-native landscape, however, technologies are also rapidly evolving to enable healthy migration and ensure that applications can meet compliance standards without being rewritten from scratch.

    First, let’s look at the standards organizations must adhere to in terms of compliance.

    CIS Benchmarks for Kubernetes and Docker

    The Center for Internet Security (CIS) benchmarks offer guidelines for the correct use of containers in applications. The CIS benchmarks specifically discuss Docker and Kubernetes.

    NIST SP 800-190

    The U.S. government’s National Institute of Standards and Technology (NIST) defines containers as a form of virtualized operating systems within its application container security guide.

    PCI

    The payment card industry (PCI) standards are a framework that helps protect data in the e-commerce and retail areas.

    HIPAA

    The Health Insurance Portability and Accountability Act (HIPAA) sets the compliance standard for patient data protection in health care.

    Securing Infrastructure via CI/CD Pipelines

    All these standards guide organizations to keep their infrastructure secure and compliant with their specific industry best practices, but security doesn’t end (or even start) there.

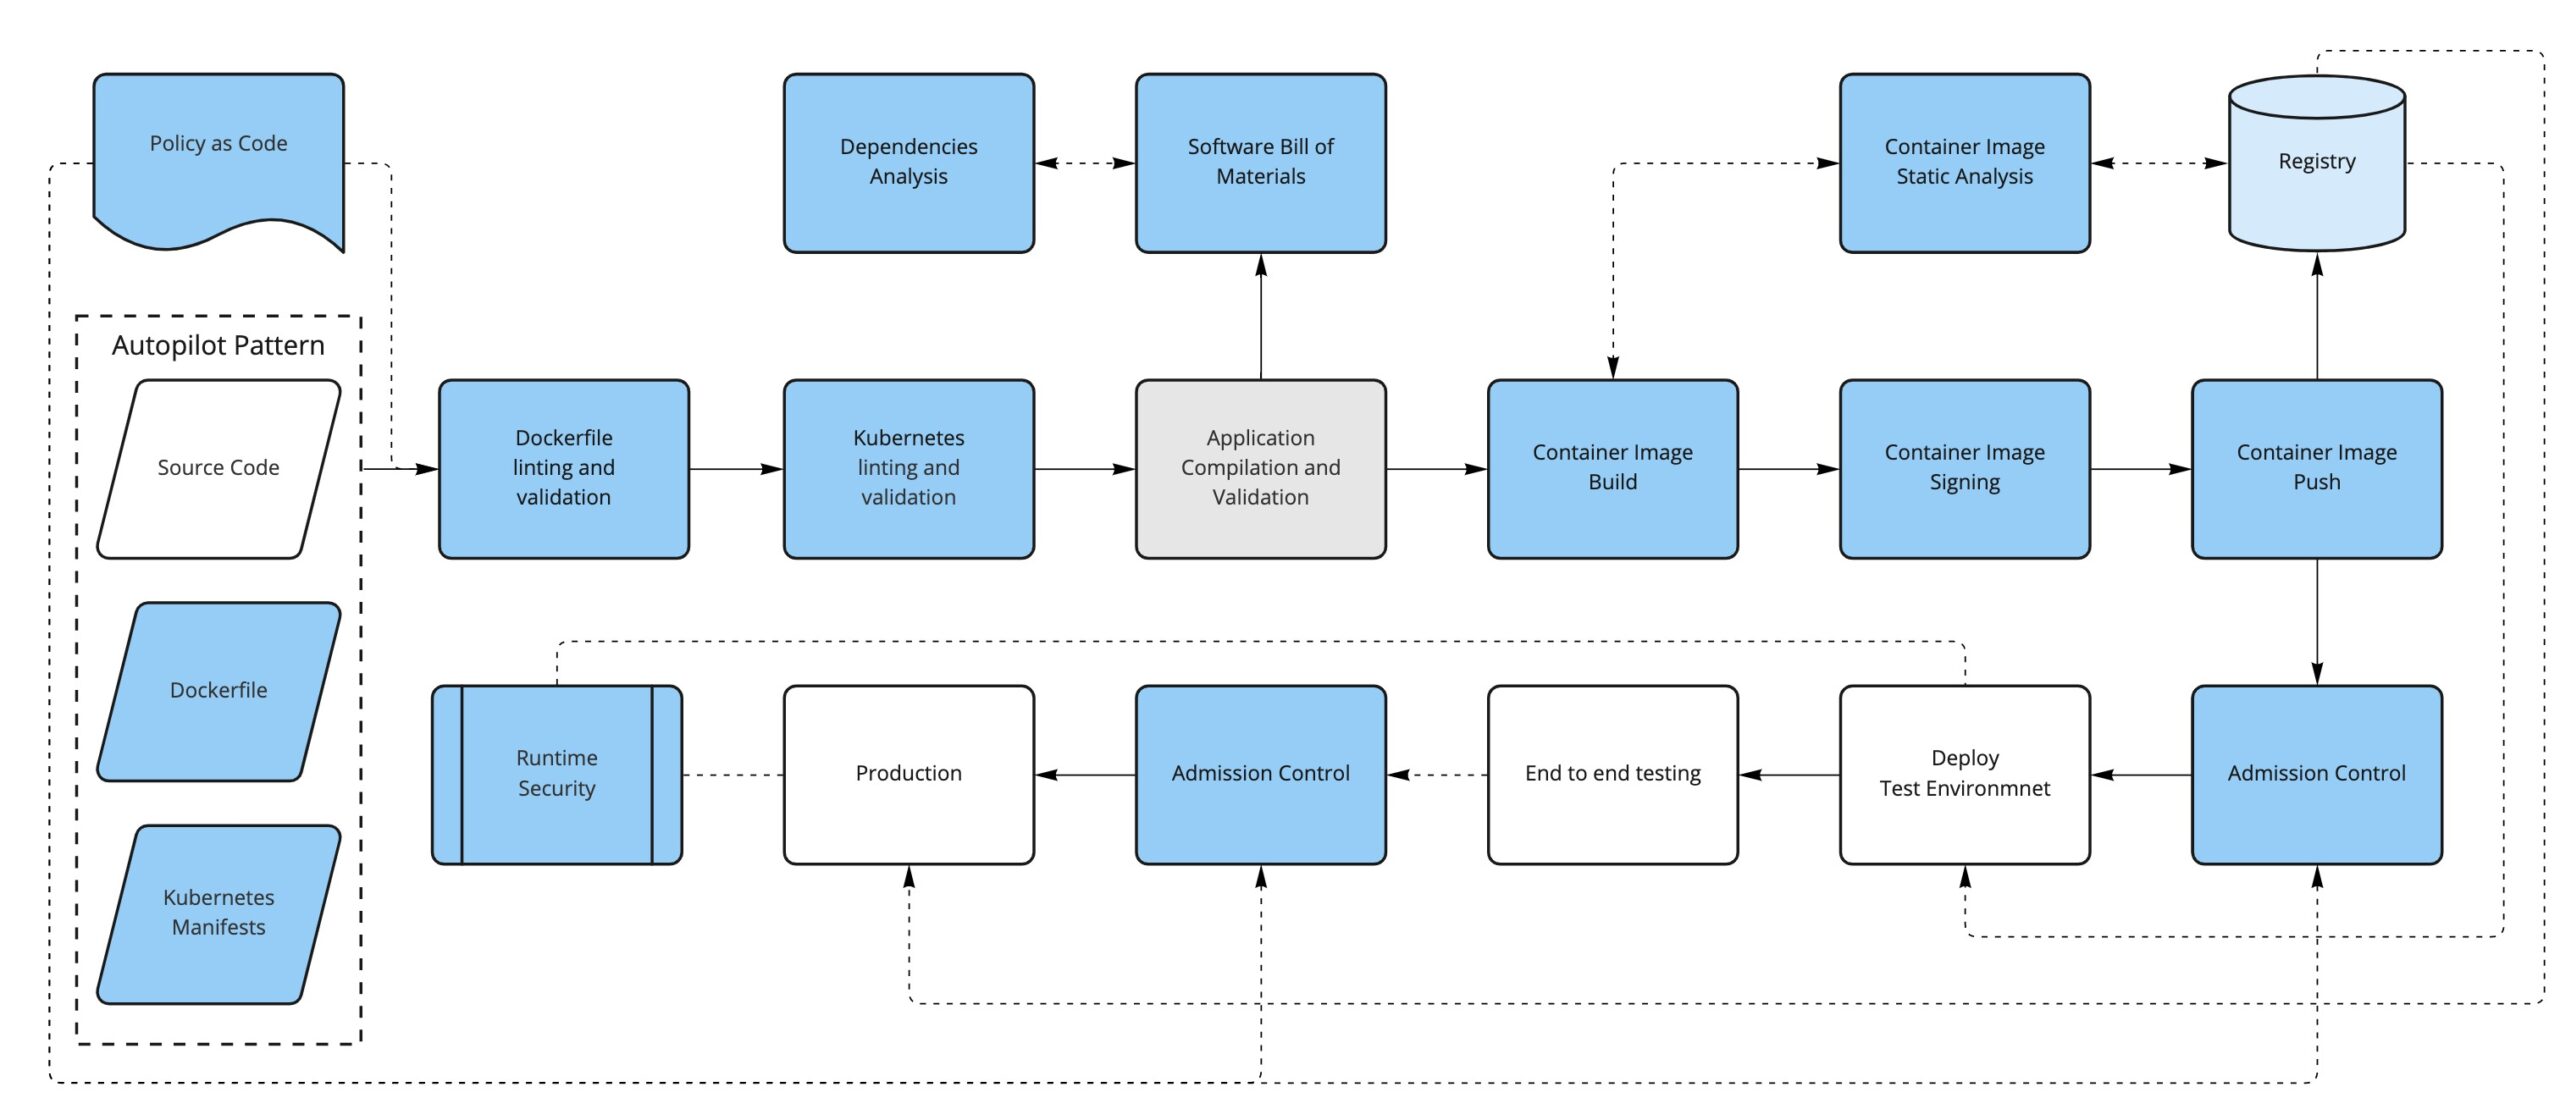
    Secure systems start from the design stage and from the code itself; you should aim to have security controls and enforcement built in as early as possible in the development life cycle. The practice of moving security checks earlier in the development pipeline (and, thus, nearer the source code) is known as shift left.

    You likely already have CI/CD pipelines in place for your application(s), and this is a great place to shift left your security checks. There are some great tools in the CNCF portfolio to help you achieve this.

    Enter Containers

    In the cloud-native world, containers are first-class citizens. From the DevSecOps point of view, containers represent a new attack surface to consider, starting with how the container image is defined and what ends up inside the container (the Dockerfile) to how the container evolves over time in response to new vulnerabilities that might be found.

    The first thing we can do is to convert our written policies to something that we can automate (such as code); for example, using a tool like OPA/conftest and a Dockerfile linter like hadolint, we can validate that the Dockerfile is compliant with our security policies.

    For instance, we could have a policy in place to limit the base images used to build new containers (limiting the FROM directive in the Dockerfile, for example).

    The second thing to consider is that, depending on how it has been built, a container image can have not only our application but also additional software included, like dependencies and operating system binaries.

    This additional software could have new vulnerabilities discovered in the future, so we should monitor the images that we have already built and pushed to our registry by periodically scanning them to find if they are open to any vulnerabilities that weren’t known at the time of building the container image.

    Just as before, we could sign our application artifacts. Now, our deliverable artifact is a container image, so it is preferable to be able to sign container images. In this way, we can trust that the container image we run comes from us and that it has been through our security process. There are projects like Notary, Grafeas and sigstore/cosign that can help with the container signature process.

    Running Containers in Kubernetes

    If we are running containers, the next logical step is to consider how we run them. Kubernetes use is on the rise as a solution to orchestrating containers across several machines. Introducing Kubernetes into the equation requires considering yet another attack surface in our DevSecOps workflow.

    Manifests

    Alongside our application’s source code, we will have the Kubernetes manifests that define how to deploy our application into a Kubernetes cluster.

    We can take the same approach as the container definition: Define some policies-as-code to enforce early in the process so our manifests are aligned with our security policies (not running untagged images, running images only from our trusted sources, ingress must have TLS, not using node port services, for example) and lint the YAML files to fail early if there are syntax problems, for example.

    We could also enforce most of the same policies and some additional ones at runtime when the manifests get applied to the cluster via a Kubernetes Admission Controller.

    Some tools that can help us with these enforcements are OPA/conftest, kubeval or kubelinter for linting and validation and, for the admission controls, we can use OPA/Gatekeeper or Kyverno, in addition to the API server admission plugins.

    Secrets

    Secrets require special attention since they contain sensitive information.

    If you’re using a GitOps approach, application secrets are often stored in repositories. Here are some resources that discuss sealed secrets in GitOps and Kubernetes secrets. 

    RBAC

    Do not use default service accounts: Define explicit service accounts associated with their permissions so you know exactly who can do what.

    Avoid the use of wildcards in roles and cluster roles; with RBAC you can define fine-grained permissions for users and for service accounts, as well.

    Know Your Dependencies

    Another attack surface that we need to consider is the application’s dependencies. It is important to first know what they are and if they have any known vulnerabilities. To help us with that, we can create a software bill of materials for the application and run an analysis on it.

    Finally, just like we periodically check for the images stored in the registry, we can continuously analyze what’s running in our Kubernetes cluster. This will ensure that there is no suspicious activity like abnormal network requests, images with critical CVEs running, etc.

    Conclusion

    By now, you should have a better idea of what it takes to secure your pipeline. Keep in mind, however, that this is mostly about process and cultural change.

    First of all, you need to know your attack surface—that is not only a technological choice, it’s also about what you think is important.

    These concepts are hard to apply from the beginning, so a better approach is to introduce changes, get used to them and think about how to improve the existing process step by step.


    Join us for KubeCon + CloudNativeCon Europe 2022 in Valencia, Spain (and virtual) from May 16-20—the first in-person European event in three years!

  • Trust in Cloud Providers is a Developer Issue

    Trust in Cloud Providers is a Developer Issue

    Earlier this summer, we worked with ClearPath Strategies to ask developers about the level of trust they have in their various cloud service providers. What we learned spoke volumes: While developers’ familiarity and comfort with Amazon, Microsoft and Google position these well-known cloud providers as market frontrunners, developers often do not agree with the companies’ values.

    The research project gathered insights from more than 800 developers at small and mid-sized businesses, those with less than 500 full-time employees, across a wide variety of industries and geographies worldwide. You can download the summary report here (no signup required).

    In ClearPath Strategies’ report, senior analyst Stephanie Fairchild said that “approximately 20% of developers believe that the big three hyperscalers will engage in behaviors that include leveraging their brands to stifle competition, focusing on shareholders more than customer needs, hosting or working with customers that developers find morally objectionable, monetizing user data for their own use and locking them in with proprietary tools. Criteria such as security and performance clearly take priority over these trust issues for developers, but it’s interesting to note that a sizable portion of developers are thinking about how their values align with those of their service providers.”

    • Trust plays an important role in developers’ choice of a cloud hosting provider, but needs take precedence; when prioritizing needs or values, developers report they prioritize needs over their values 73% of the time.
    • The top three reasons cited for developers’ preference of their chosen third-party cloud provider: Security, trust and quality of service.
    • Survey respondents indicated that both hyperscale and alternative cloud providers deliver equally effective performance and security.

    The report cited three top criteria for choosing a third-party cloud provider: Security, trust and quality of service. Survey respondents felt that hyperscale and alternative cloud providers deliver equally effective performance and security. Interestingly, although 73% of respondents said they prioritize needs over values when making a purchasing decision, approximately 20% said they don’t trust the big three providers (AWS, GCP and Azure) in what could be considered key moral areas.

    It’s no secret that the extensive functionality and brand awareness of hyperscalers make them popular choices for developers, but an alternative cloud provider like Linode, DigitalOcean, OVHcloud or Hetzner can be a more trustworthy partner for innovative upstarts—one that likely offers better pricing and doesn’t threaten or compete with their business. And when an alternative cloud provider meets a developer’s functional needs—which is nearly always the case—developers can have the best of both worlds: A provider they can trust to meet their needs and one that shares their values. 


    To hear more about cloud-native topics, join the Cloud Native Computing Foundation and the cloud-native community at KubeCon+CloudNativeCon North America 2021 – October 11-15, 2021

  • Energy Efficiency and the Data Center

    Energy Efficiency and the Data Center

    The IT industry has historically been a leader in the ongoing race to reduce CO2 emissions. Reducing emissions is good for the environment and for the corporate bottom line. The data center is well-known as a voracious data consumer. But the data center consumption findings keep pace with the trend. Even in the face of remarkable growth in data center capacity and performance, their energy consumption has increased only a few percentage points since the 2010s. This almost-flat rate of energy consumption is primarily the result of the shift to cloud computing as well as the shift to solar and wind energy, where it makes sense.

    Investments in renewable energy sources have helped tamp down criticism over the overall IT carbon footprint. Knowing that it takes a tremendous amount of energy to power a data center, owners and operators are always looking for ways to improve efficiency and reduce carbon expenditure. Today, there are newer and better ways for organizations to deliver the performance to properly power modern applications while keeping in mind the energy efficiency and carbon reduction the world requires.

    Minimizing Energy Use and CO2 Production

    How did we get here? Decades of semiconductor process miniaturization in concurrence with living out Moore’s Law has culminated in ongoing improvements in performance, storage capacity and device density. Today’s mobile phones are a great example of that ongoing progress. A secondary factor in the mobile phone revolution is a processor architecture optimized for efficiency and flexibility. This ARM architecture has been used to power almost all devices since the first iPhone. Over the years, ARM has also become a realistic platform for servers; often a better choice than an x86 system.

    Energy efficiency is one area where ARM systems win out over conventional server architecture. But it was not until recently that ARM processors could deliver the required performance for the data center. Today’s systems, based on Armv8 designs, have brought into play x86-class capabilities in a more energy-efficient way. The advent of the ARM-based AWS Graviton processors, which by some estimates have already captured 20% of the instance share on AWS, demonstrates that ARM can run production workloads while delivering what AWS calls “up to 40% better price performance over comparable current-generation x86-based instances for a wide variety of workloads.”

    To illustrate the impact on carbon production when a data center shifts from x86-based architecture to ARM servers, an analysis of the top elements contributing to data center energy use was undertaken. The energy savings was calculated and translated to reduced CO2 emissions based on the fuel mix used to power the electric grid in various locations. The results prove that an ARM-powered data center reduces CO2 production by 74%, equivalent to almost half a million barrels of oil.

    Power Consumption Reduced by Efficient Servers

    The premise is simple—innovative server design significantly reduces data center energy use. In this model, a server’s power draw and physical size are key factors. The energy needed for other data center subsystems was extrapolated by using ratios derived from experience and validated by estimates from other data center operators.

    Data center energy use can be divided into five categories of equipment and infrastructure: Servers, network communications, power supplies, conversion and UPS, cooling systems and storage. Servers and cooling comprise about 75% of the total.
    The calculations were based on the energy used by a medium-sized data center with 750 racks of conventional 1U servers (42 servers/rack; around 31,500 in total). Assumptions used included servers comprising two-thirds of the floor space and that the equipment space accounts for 65% of the total, translating to a 62,000 square-foot data center. For comparison, facilities operated by the major cloud vendors can be a million square feet or more. Knowing server power consumption and the ratios for the equipment categories, algebra can be used to calculate the energy consumption for each.

    The data center in this hypothetical example has, as we said, 31,500 servers. Using the 912.5W power draw of a Dell R640 as typical of 1U x86 servers, the total server usage in the ARM data center would be 251,795 MWh/year. Using this formula, the amount of energy saved by using ARM servers can be calculated. Each server requires about one-quarter the electricity of a standard server. In the formula, the assumption is that the ARM server installation would require half the equipment racks (375 instead of 750) and 52% of the power-per-system, comprising a data center using only 26% as much electricity (152,409 MWh/year) as one based on x86 systems.

    The math shows that switching one medium-sized data center to ARM servers can produce annual savings equivalent to 45,459 fewer cars on the road or 486,749 fewer barrels of oil used.

    The value in CO2 reduction is widely understood for preserving the environment. It is also advantageous from an economic standpoint. In fact, there are many technical and economic reasons to adopt energy-efficient ARM-powered servers in the next-generation cloud data center.


    To hear more about cloud-native topics, join the Cloud Native Computing Foundation and the cloud-native community at KubeCon+CloudNativeCon North America 2021 – October 11-15, 2021

  • Top 5 Must-Haves for IaC Automation Tools

    Top 5 Must-Haves for IaC Automation Tools

    These days, there are a lot of different DevOps tools to accomplish a lot of different jobs. Almost daily another startup comes out with a new and innovative product or a newer (maybe even better) version of existing tools. One of the biggest innovations has been infrastructure-as-code (IaC). Giving infrastructure admins and developers alike the ability to create, manipulate and destroy infrastructure using code files changes the way we administer our environments. Though these tools are revolutionary and can solve many problems, sometimes they come with a whole new set of issues—as can any type of tooling, really. 

    Generally, IaC tools are run locally at first. When an infrastructure admin or developer is just starting out with it, they store the files locally; maybe in a repository, then clone the files to execute locally. This is perfectly acceptable and a very common practice. The issues arise when it comes to scaling this practice to a team; for example, with regard to visibility and governance. If everyone is running their deployments locally, the team doesn’t have clear visibility into who is deploying what, when and with what variables. This is where IaC automation tools come into play.

    There are many different types of tools to solve these problems. Some are better than others. CI/CD pipeline tools, custom-built automation platforms, purpose-built IaC automation platforms—each has their pros and cons. Getting into all of that can be overwhelming and we could go on for hours about each option. But, we’re here to talk a bit more generically today. So, we’ll save all of that for another time. For now, let’s take a step back and talk about the top five must-haves for any infrastructure-as-code automation platform you’re considering. Because each company and use case is different, we’ll talk about these considerations in no particular order. 

    Role-Based Access Control (RBAC)

    This first factor is pretty important. I know I said I wasn’t discussing these in any real order, but this one should really be close to the top of the list for anyone looking into IaC automation. We talked about how automating IaC can cause visibility issues when you scale across a team. You may want to know who deployed what, when, where and why, for example. Usually, the reason you want that kind of visibility is that you would like to control all of these aspects. That way you can help limit waste, budget problems, security concerns and the like. You may want to provide self-service deployment access, but only within certain parameters; maybe only to certain people or teams. Having granular RBAC can help you design a security policy that makes the most sense for your organization and its needs. Some tools have this baked in, some take a bit of work to make it work. The point is that you should have some form of control over your deployment process. 

    Self-Hosted Agents/Runners

    Following the security thread: A lot of these IaC automation tools are SaaS platforms. SaaS can be very secure. But sometimes, for compliance or regulatory reasons, you may want to retain a bit more control over your deployments. This is where self-hosted agents or runners come in. This type of design allows you to keep your “secrets”—such as your cloud credentials and other sensitive variable information—secure in your own way. You can use whatever secrets management solution you want, be it something from your cloud provider or another third-party solution. It also allows you to keep your code secure. All of these tools, when deploying your code, have to get a copy of that code to deploy. So, they’ll do a ‘Git clone’ or some kind of file copy process to get your files from where they are stored, to execute them. If this is a SaaS solution, then they will essentially have access to your code. Again, this may not be a huge issue for some, but it very much is for others. If you don’t want to give a third party this level of access to your code and secrets, a self-hosted agent or runner can help keep it all secure and under your control. 

    Plan on Pull Request

    This feature is a big one when it comes to workflow. Some may not even know how important plan on pull request (PR) is until they realize how easy it can make their life. This feature may be called something different depending on the platform. Plan on PR, PR plan, speculative plan, etc. Essentially, this means that whenever you open a pull request against a branch, your automation platform will complete a deployment just up to the “plan” phase so that you can see exactly what this code change will do. For example, if you accidentally add an extra 0 to a variable or code file, you may end up with 100 instances instead of 10. Ideally, you’d like to know what was going to happen with a change before it is deployed, giving you the option to quickly fix a potential mistake before it actually goes through. In DevOps, you always want to ‘fail faster’ and close the loop so that big mistakes are caught before they happen. That is why this feature is so important. And if the automation platform you choose is doing this correctly, when it runs this plan phase it’ll automatically update the pull request directly with the possible changes as a comment. This way, your developers can see what is going to happen before they try to merge the deployment back to the main branch for deployment to production. And if they take it a step further by adding service checks to the pull request, you can even configure it so that if the deployment plan fails for any reason, developers are actually blocked entirely from merging the PR back until it is resolved. All of these features help to enable the ability to work in a GitOps methodology. Don’t get me started on the wildl misuse of the term GitOps—it is very specific. While one of the central pillars of GitOps is using your repository as your “single source of truth” for what should be deployed, it’s not just using Git to store your Terraform files; it is an infrastructure administration via pull request methodology. If you want more information about GitOps, you can read more here. 

    Continuous Deployment

    This feature is essential for most folks. But, depending on the workflow, it can be less important. Even if it isn’t a must-have now, it may be down the road when you evolve and grow into new workflows. Continuous deployment is the ability for your automation platform to have a webhook or other connection to your source code repository so that it can automatically trigger a deployment process whenever you commit or push to the repository. This feature goes hand-in-hand with the plan pull request feature we just spoke about. To make that feature function properly, a CD feature would be needed, as well. Now, I want to make sure I clarify. Just because you have continuous deployment enabled doesn’t mean it is just going to push to production in the middle of the day every time a commit or push is done. You should still be given the ability to pause the deployment process after the plan phase. This way you can validate that the plan looks acceptable before you approve the deployment. For some use cases, like developer sandboxes, you may “auto-approve” the deployments because you don’t care about having to get validation first. It all depends on your workflow and processes. A good platform will give you the ability to control all of this. 

    Shift Left Extensibility

    This one is a bit of a wild card. It can mean a lot of different things depending on the situation. Essentially, what I am talking about here is the ability to integrate—or at least be interoperable—with a multitude of other tools during the deployment process. There is a concept called continuous verification which means to shift some tools and processes left into the deployment process so that you can stay on top of problems before they start. In the PR plan feature section earlier, we talked about catching issues before deploying. This isn’t just for resource configuration issues. What about security issues? Compliance issues? Performance issues? Or even budget issues? If your IaC automation tool gives you the ability to integrate the processes and tools you are using to validate these things into the deployment process, they no longer have to be an afterthought. You never have to worry about going over budget if you are constantly validating the budget each time you deploy. You don’t have to worry about a security issue if you’re validating security during every deployment. This type of functionality can look and be named very differently between tools. But as long as you have the ability to get all of these other groups (security, finance, etc.) involved sooner, everyone will be better off. Like we talked about before, in DevOps, it’s always better to fail faster. And integrating these checks into your deployments can help you achieve this. 

    Conclusion

    We’ve made it through all five! We’ve talked about some basic security features. We talked about some automation workflow must-haves to make your life easier. And we even scratched the surface on some next-step-type things to look into such as continuous verification. That was a lot—hopefully this has been helpful for anyone looking into IaC automation platforms and you now have an idea what to look for. Some features may be named differently, but the ideas behind them are the same. If your platform can’t do these, it may not be the right one for you. Or, maybe it is and that feature just isn’t that important to you. As I mentioned, your mileage may vary. Every organization is different.


    To hear more about cloud-native topics, join the Cloud Native Computing Foundation and the cloud-native community at KubeCon+CloudNativeCon North America 2021 – October 11-15, 2021

  • Rethinking Your Approach to Ops Governance

    Rethinking Your Approach to Ops Governance

    The “You build it, you run it” approach has changed the mindset of modern organizations that are increasingly adopting DevOps practices. No longer completely beholden to the requirements of operations, engineering teams are continually acquiring more autonomy to deliver rapid innovation. At the same time, more organizations are adopting platform teams to accelerate development, empowering teams with easier access to services without requiring them to understand the underlying complexity. While this approach is helping teams build, scale and ship software faster, it’s also resurfacing previous areas of tension around operational governance. 

    Organizations are generally choosing between two governance approaches: Mandated or paved path. Each has a different perspective on the appropriate level of autonomy to grant development teams and where governance should sit within the development life cycle. But there’s a third approach—the “trust and verify” approach—that can provide both high levels of autonomy for development teams and the sophisticated governance that operations teams need to ensure compliance and security.

    What is a Platform Team and Why are Organizations Adopting the Model?

    A platform team provides a foundation of self-service APIs, tools, services, workflows and support that accelerates the delivery of digital services and products. Platform teams operate similarly to any R&D team; employing customer support, operations, development, SRE, product managers and other personnel. They use research, customer feedback and usage data to iteratively improve their services.

    Rather than each development team reinventing the wheel, the platform team builds shared services that shield developers from the underlying complexity of infrastructure and enable self-serve access to services. As engineering resources become even more in-demand and scarce, organizations are using platform teams to optimize resources and share outputs.

    Two Platform Governance Approaches: Mandated Vs. Paved Path

    Organizations today typically are using one of two approaches to platform governance: Mandated or paved path.

    A mandated approach solves the governance problem by mandating that all engineering teams use the platform. However, this approach puts the onus on the platform team to keep up with the changing demands of engineering. Organizations must invest in a platform team that can keep up with engineering requirements so they still feel like they can innovate and use the best tools.

    The second approach is a paved path, popularized by Jeff Lawson of Twilio. This allows for engineers to go outside the platform if they are willing to take on the SLAs the platform provides and are responsible for all the costs of maintaining their own alternatives. Lawson said in this McKinsey interview, “What you do is you create the incentive structure for teams to take the paved path. But if they really have to go a different route, you make it possible for them to do that.”  

    While the paved path approach offers more autonomy for engineering teams, it requires teams that veer off the path to maintain the integrity of their software. Without guardrails, operations must put full trust in teams to keep their services secure and compliant. It can often be difficult for operations teams to maintain visibility into the services and infrastructure that fall outside the core platform.

    So, given that a mandated approach restricts autonomy and a paved path can make compliance more difficult, what is the middle ground?

    Bridging the Gap Between Mandated and Paved Path

    First, it’s important to understand that governance is not synonymous with command and control. Instead, operations teams should think of governance as the practice of maintaining visibility and providing best practices. Rather than a mandated platform approach, organizations can choose an approach that offers more autonomy to engineering teams (similar to paved path) while also maintaining operational governance. This is a trust and verify approach. 

    Using the trust and verify approach, organizations should focus their efforts on technology, not people, to maintain compliance. The goal would be to have a platform that could easily connect to the entire toolchain any product team uses for complete visibility and context. In this way, operations can gain governance without adding friction for product teams. This requires a top-down approach within organizations: I&O leaders investing in engineering resources or an off-the-shelf platform that can enable this technology. Both engineering and operations can flourish in this modern environment. Approaching governance from a trust and verify perspective will expand access to innovation while ensuring compliance and security standards. 

    Governance Should be Over Technology, not People

    Creating a bridge to a trust and verify approach means placing the responsibility for governance on technology rather than people to maintain detailed audit trails of human and machine actions tied to identity and reduce the potential for human error through automation. This approach provides autonomy for engineering teams while also ensuring governance through visibility and process controls embedded into workflows and tooling. 

    Shellie Miller, senior manager, technology governance and compliance at Hulu, believes technology can support DevOps practices. “To have a successful DevOps organization, we don’t need to have command and control or have this clear line of separation between dev and operations. It’s putting the responsibility on the infrastructure, the platform and the tooling and the policies and the processes that you have to enable those self-serve capabilities,” Miller said. 

    Mitigating Human Error Through Automation

    This investment in technology should focus on automation and process controls that fit within teams’ current processes. “What auditors are really trying to do is mitigate human error,” said Miller. “Teams should really focus on automating controls, building those security practices and those best practices into the platform. That way, dev teams are just subscribing to that offering.” 

    Changes to applications, systems, data and code—one of the biggest culprits with regard to risk—is where automation and process controls embedded into platform offerings can make a huge impact. “From an engineering perspective, constant change is needed to support rapidly changing consumer demands,” Miller added. “However, from an audit perspective, these activities increase risk of material impact to viewer experience, revenue and/or financial reporting.”

    Investment in Governance Comes From the Top

    While technology holds the key to better governance and compliance standards, there’s an investment that must be made, whether that’s investing engineering resources in building automation or investing in an off-the-shelf platform that can enable automation.

    “Leadership and organizational backing is absolutely key,” said Miller. “You can’t get to compliance or governance or any kind of operational maturity, for that matter, when you’re doing a bottom-up approach.”

    Building a compliance and security program around technology and not people means having the proper skills and mindsets. A bottom-up approach could create friction, especially due to a lack of education and understanding of the why and how. A top-down approach ensures there are resources to both implement the technology and to foster a culture of understanding and education. 

    The most common question I get asked is, ‘Why can’t we trust our people?’” Miller said. “Compliance requirements don’t generally start with the thought that our people are being malicious. We should run an organization of trust, and through automated monitoring and governance, we can verify and govern without being intrusive and disruptive. Lack of training and the demand on teams is what drives the perception that there’s no trust. Security and compliance is intended to mitigate risk and prevent threats to the systems that enable the business.”

    Building on a “Trust and Verify” Platform Approach

    When it comes to governance, technology is our greatest asset. Of course, this investment can be substantial for many organizations that don’t have the engineering resources to build in-house. Today, new open source or off-the-shelf platforms enable operations teams to build self-service capabilities that provide guardrails against human error, an audit trail of human and machine actions and visibility across disparate tools and services. 

    No-code solutions that also provide a developer platform for deeper customization enable teams to build out these core requirements of governance without consuming considerable engineering resources. The door to a future where operations teams can provide more autonomy to development teams while maintaining governance is now open. Every organization has the ability to attain a “trust and verify” approach and meet the needs of both dev and ops.


    To hear more about cloud-native topics, join the Cloud Native Computing Foundation and the cloud-native community at KubeCon+CloudNativeCon North America 2021 – October 11-15, 2021

  • New Relic I/O Aims to Simplify Instrumentation

    New Relic I/O Aims to Simplify Instrumentation

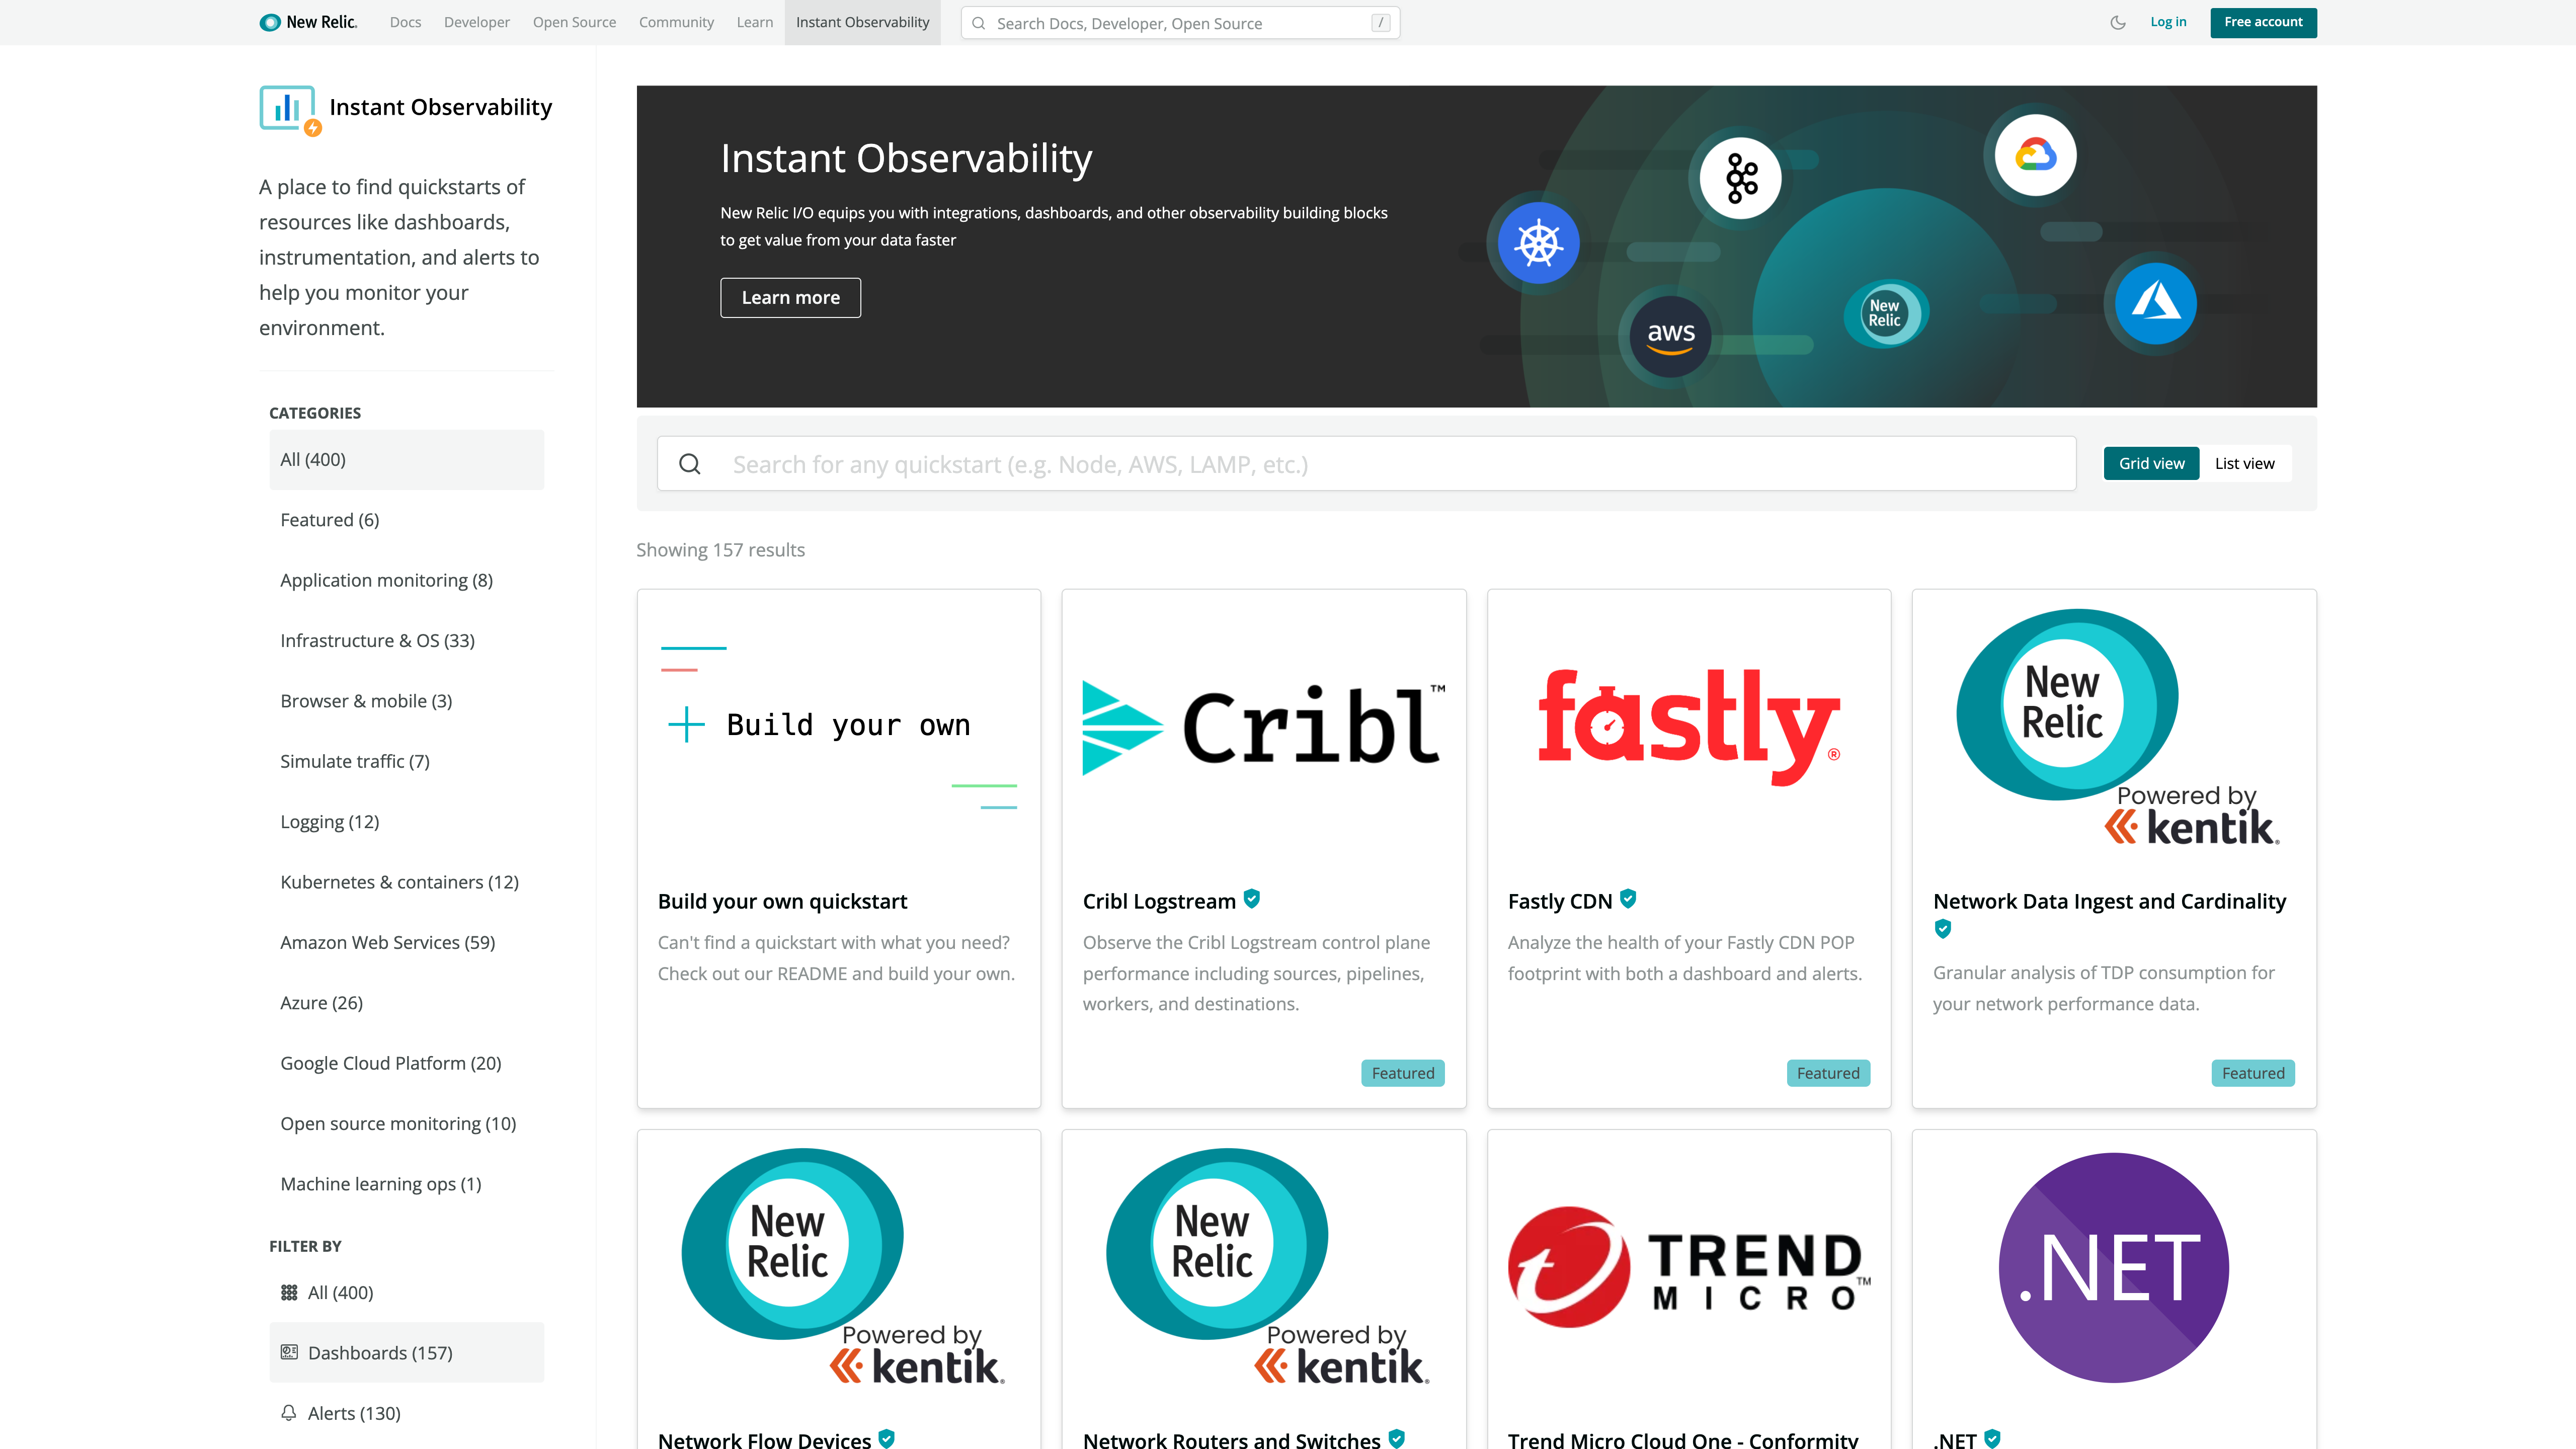
    New Relic today at the KubeCon + CloudNativeCon North America conference launched a New Relic Instant Observability (I/O) initiative through which it is making available open source tools to simplify application instrumentation.

    Marck Robinson, senior vice president for engineering at New Relic, said the catalog of tools will help DevOps teams instrument a much wider range of applications. New Relic will make those tools available as part of the free tier of its observability platform delivered via the cloud. DevOps teams will be able to use more than 400 pre-configured quickstarts to both instrument applications and create dashboards, Robinson said.

    New Relic itself is contributing quickstarts for cloud services, open source tools and platforms such as Kubernetes, Istio and Cassandra. Third-party vendors that have already contributed to the catalog include Cribl, Fastly, Gigamon, Kentik, Lacework and Trend Micro. Each contribution is being vetted by New Relic as part of an effort to foster the development of a larger open source observability ecosystem, noted Robinson.

    Robinson said overall, New Relic is trying to make it easier for DevOps teams to close an instrumentation gap that is impeding IT organizations from moving beyond monitoring to embrace true observability of their IT environments. The recent New Relic 2021 Observability Forecast report notes only a quarter of respondents (26%) have a mature observability practice, with the most commonly cited barriers to observability being a lack of resources (38%) and skills gaps (29%).

    As a result, DevOps teams often encounter a last-mile observability challenge when it comes to both instrumenting applications and then building their dashboards, said Robinson.

    As part of a larger effort to make it easier to instrument applications, New Relic has open sourced agent software, standardized on the OpenTelemetry tools being advanced under the auspices of the Cloud Native Computing Foundation (CNCF) and contributed the Pixie observability platform for Kubernetes environments to the CNCF.

    Observability in one some or another has always been a core tenet of any DevOps best practice. Initially, DevOps teams focused on continuous monitoring as the most effective way to proactively manage application environments. However, it can still take days, sometimes weeks, to discover the root cause of an issue. However, observability platforms are emerging that correlate events in a way that makes it easier for analytics tools to identify anomalous behavior indicative of a root cause of an IT issue. Armed with these insights, it becomes a lot simpler for IT teams to resolve issues faster.

    In contrast, monitoring focuses on predefined metrics to identify when a specific platform or application is performing within expectations. The metrics tracked generally focus on, for example, resource utilization. Observability, on the other hand, combines metrics, logs and traces—a specialized form of logging—to instrument applications in a way that makes it simpler to troubleshot issues without having to rely solely on a limited set of metrics that have been pre-defined to monitor a specific process.

    With the rise of microservices-based applications, the shift to the cloud and more end users than ever working remotely, the need for observability has never been more critical. The issue now is finding a way to make it much simpler to achieve.

  • Why You Need a Value Stream Delivery Platform

    Why You Need a Value Stream Delivery Platform

    While the pandemic was significantly challenging for businesses, it exposed the need to quickly adapt and change. Software products for internal or client use continue to provide an opportunity for a competitive edge in nearly any industry. Businesses will immerse themselves and compete in the digital economy by consistently producing better software products at an ever-increasing pace.

    In the past year, two new solutions with similar names have been gaining attention: value stream management platforms and value stream delivery platforms. Both are designed to help firms improve their software development process. The end goal for both is also similar—speed up development—but how each accomplishes this goal is important to differentiate the two.

    So which one should you use? We’ll cut to the chase—the value stream delivery platform provides more strategic long-term value. Here’s why.

    First: Value Stream Mapping

    To understand the need, you first need to understand value stream mapping. This involves visualizing the value stream processes and events from conception and creation to testing, production and, finally, release. By mapping the value stream, you can get a better understanding of the workflow and identify dependencies between the different activities, which will help you identify any blockages or impediments to delay delivering customer value.

    Staying abreast of your value stream is essential to delivering value to the customer as it connects all the multiple teams, tools and applications along the way. By gaining clearer visibility into the entire software delivery process, you can then scale your enterprise by bringing other teams on board for greater collaboration. Additionally, tracking your value streams can help reduce any risks to performance, as you can easily see the throughput and stability of your products.

    Value Stream Management Platforms (VSMP) Explained

    Simply put, value stream management helps solve poor visibility across the software delivery life cycle. You can measure and manage the performance of your software delivery team, identify any areas for improvement and leverage best practices that support collaboration through teams. Additionally, a value stream management platform helps connect applications, teams and tools through the collection of static data used to improve ongoing delivery performance.

    One benefit to using a value stream management platform is that existing toolchains remain undisturbed. The VSMP simply integrates with the different datasets across the existing process and provides the desired visibility and analytics to the different product value stream(s) across the organization.

    An Underlying Problem: Toolchains

    The lure of easy visibility that a value stream management platform provides is somewhat deceptive. The constant pressure to create and deliver better software faster using multiple tools and manually built toolchains has reached its breaking point:

    • Poor interoperability, manual handoffs and disparate data have created DevOps automation silos
    • The multiple test environments used through the process and the need for multi-cloud and hybrid deployments add tons of unnecessary complexity
    • Increased policy and security requirements simply cannot scale and remain manual

    Developers are caught in the middle—they must understand both a complex development and deployment process plus build a complex product for their customers—but being an expert in both is nearly impossible.

    The use of internal platform teams has been recognized as a way to solve this problem. The platform team is responsible for providing an easy-to-use solution; essentially treating developers as customers. In turn, the developers can focus their efforts on the software products they’re responsible for and on satisfying client needs.

    How is a Value Stream Delivery Platform Different?

    Many firms have learned the hard way that building an internal platform is risky, time-consuming and expensive. A value stream delivery platform replaces the traditional, manually built toolchains used today and sidesteps the risk, cost and development time involved in building a platform in-house.

    A VSDP should:

    • Cover the entire process of planning and creation, integration and verification, deployment and operations and, finally, monitoring and improvement
    •  Have both security and compliance capabilities built into the platform foundation
    •  Integrate DevOps point solutions, plus easily add or change tools over time
    •  Provide a centralized data model that creates one source of truth for the development process
    • Provide metrics and reports to accelerate process and value stream improvements
    • Improve software quality through continued enhancements based on best practices

    A value stream delivery platform cuts the administrative burden on DevOps teams, allowing them to refocus their efforts on providing significantly higher value. Instead of maintaining toolchains, they can now help identify process bottlenecks, expand automation and work directly with application teams to drive standards.

    Value stream management platforms provide value in understanding the process and where it can be improved. But they don’t fix the underlying toolchain problem. Instead, the improved visibility may tempt some to squeeze more productivity from developers over the short term without addressing the underlying toolchain problem. However, replacing toolchains with a value stream delivery platform can help address all these issues, and may prompt you to retire your value stream management platform.


    To hear more about cloud-native topics, join the Cloud Native Computing Foundation and the cloud-native community at KubeCon+CloudNativeCon North America 2021 – October 11-15, 2021