Tag: KPI

  • Why and How to Collect KPIs for Z DevOps

    Why and How to Collect KPIs for Z DevOps

    It can sometimes feel frustrating to try to figure out how to do DevOps. That’s because DevOps is not about tools—there are lots of different tools that can help you succeed at DevOps. Nor is it about any really specific set of practices; although DevOps prioritizes things like automation and communication, it does not prescribe specific processes for enabling them.

    Instead, DevOps is really just about cultural values, which is a rather vague guideline for people who want to do DevOps. In this sense, DevOps can make practitioners feel a little lost, because they’re unsure how to measure whether they are succeeding on their journey toward DevOps.

    The fact that DevOps ultimately boils down to culture does not mean there are not specific points of information you can track and analyze to help assess progress on your DevOps journey. The specific metrics you’ll analyze will vary depending on your circumstances and the systems you use, of course. But to provide an example of how you can evaluate DevOps progress in the real world, let’s take a look at which types of key performance indicators (KPIs) you might focus on when doing Z DevOps.

    What Is Z DevOps?

    Z DevOps refers to a DevOps practice within the IBM Z ecosystem. Although Z is not typically the first technological niche to come to most people’s minds when they think of DevOps, the fact is more than half of enterprise transactions continue to run on IBM mainframes. The vast majority of structured business data also resides on these systems.

    Thus, bringing mainframe software delivery up-to-speed with DevOps culture is an important priority for many organizations. That’s what Z DevOps is all about.

    KPIs for Z DevOps

    Whether you’re just starting on your Z DevOps journey, or have been doing DevOps-based software delivery on the mainframe for a long time already, there are a variety of KPIs you can track to help assess how effectively your DevOps strategy is working, and find ways to make it even better. Remember, DevOps is all about continuous improvement and never settling for the current state of affairs.

    Deployment Speed: DevOps prioritizes faster software delivery. For that reason, being able to track how quickly you push out new software releases or updates is critical for measuring your DevOps success. In DevOps circles, this KPI is sometimes called Mean Time to Delivery, or MTTD.

    Keep in mind that truly continuous releases (meaning releases that are literally constant) are an unachievable goal. But by tracking your current deployments per week or month, you can measure how your deployment speed changes over time.

    Deployment Success Rate: Software deployments can fail for a variety of reasons, and achieving 100% success is not practical for most organizations. But you still want to strive to maximize your deployment rate. Anything around 90% is impressive in many cases. So, track how many deployments succeed and fail.

    Deployment Scale: Deployments vary greatly in size. One deployment might contain a few minor performance tweaks. Another might involve major interface or feature overhauls. In order to contextualize other deployment-related KPIs, it’s important to measure deployment scale by collecting information about the scale of your typical deployment.

    Scale in this context can be difficult to measure precisely, but basic metrics to track include information like how much new code is a part of each deployment, or which percentage of a deployment entails new features as opposed to bug fixes for existing features.

    Test Failure Rates: In most DevOps delivery pipelines, you will rely heavily on tests (especially automated tests) to verify that software is ready for delivery before it is deployed. When tests fail more often than expected, it can be a sign that developers are working too quickly or need more feedback about code quality. Tracking test failure rates can help you assess these issues and take action in order to minimize failures and keep deployments running on schedule.

    Team Performance: In addition to tracking overall speed and performance, it’s important to be able to track these KPIs on a per-team basis. Again, DevOps is all about culture, and some teams might need more help than others in embracing DevOps culture. By tracking deployment performance on a per-team basis, you are in a better position to identify teams that need more help, as well as those doing well and can serve as an example for others.

    Inter-Team Communication: Since DevOps is all about transparency and efficient communication across the entire IT organization, communication activity between different teams is another useful KPI to track. The data you collect on this front could include things such as emails or Slack messages exchanged between teams, or even meetings or phone calls. This data is not a perfect reflection of how effectively different teams engage with each other, but it provides some useful insight.

    Collecting DevOps KPIs for Z

    If you are doing Z DevOps, one challenge you’ll face is  many generic DevOps tools weren’t initially designed to work in the Z ecosystem. They were designed for other types of infrastructure and environments.

    That doesn’t mean the tools you need to do Z DevOps don’t exist, however. You just need to look beyond generic DevOps guides to find them.

    When it comes to collecting KPIs for Z DevOps, the go-to tool is UrbanCode Velocity. In addition to helping to automate and standardize the software delivery process for the Z ecosystem by providing release automation templates and tooling, UrbanCode Velocity lets you collect and track the various metrics that are important for taking stock of your Z DevOps operation.

    Because UrbanCode Velocity supports KPIs based on data gathered from Z DevOps pipelines, it can help to standardize your entire DevOps workflow, not just your Z DevOps effort.

    — Chris Tozzi

  • Focusing on the True DevOps North Star: Continuous Improvement

    Focusing on the True DevOps North Star: Continuous Improvement

    When we look beyond the fundamentals of tearing down silos and establishing greater collaboration, communication and transparency, DevOps is a label assigned to a framework of best practices and technologies that organizations leverage to deliver systems faster, more efficiently and without sacrificing quality. The best practice within that framework is continuous improvement, which provides stakeholders with data and feedback to constantly improve their ability to deliver products that advance strategic business objectives. This is done through key performance indicators (KPIs) that align with the goals of the business.

    Continuous improvement thrives on a robust program of KPIs that measure key attributes of a successful development team in the context of what is important to your organization. These KPIs provide you with the opportunity to continuously evaluate your system delivery processes and supporting technologies, and identify opportunities to make changes that produce better outcomes. In general, all organizations should be continuously improving their system development and delivery against three primary KPIs:

    • Quality: The value and performance of software you deliver to customers.
    • Velocity: The speed at which you develop and deliver software to customers.
    • Efficiency: The ease (low resource consumption, minimal latency) with which you develop and deliver software to customers.

    For now, let’s focus on what’s required to continuously measure and improve against them.

    Continuous Improvement KPIs vs. Metrics

    KPIs provide baselines for minimally acceptable performance levels across critical areas that impact the success of your business. Metrics measured against these KPIs help development teams improve what they’re doing to support the performance of the business in light of its goals.

    There are hundreds of metrics available (escaped versus trapped defects, features deployed and mean time to X, to name a few). The problem is most organizations focus too much on non-business-related metrics and data points and end up measuring the wrong things, such as how many lines of code have been written. This data may be interesting, but it tells you nothing of how well or within what time frame the code was written, or how that affects the delivery of value to customers.

    Your metrics should align with the goal-oriented KPIs of your business. For example, if a goal is to increase the quality of software after an influx of customer support issues related to defects, you should measure how many defects are escaping and how many are being trapped in testing. However, the remaining challenge for most organizations is actually capturing this metrics data to accurately measure progress and continuous improvement against, for example, a quality baseline.

    Collecting Data for Continuous Improvement

    A large reason organizations struggle to capture the right metrics data is they rely on outdated project management tools and manual effort. Developers and other team members painstakingly capture and contribute metrics data through status reports and meetings. Project managers then spend the bulk of their time analyzing and producing even more reports to provide the necessary feedback to support continuous improvement.

    In a digital economy where fast beats slow, this slow approach of manual data collection constrains and negates the business objectives of increasing quality, velocity and efficiency simultaneously. Core to Agile is the production of working software and minimizing the amount of work not directly related to that endeavor. If you want to move to an agile, iterative world, you want to minimize activity or any work that’s not directly related to the software delivery effort.

    That’s why, for true continuous improvement, you want your tools to automatically produce the right metrics data to measure and continuously improve upon KPIs, rather than relying on developers to attend status meetings and feed project managers information used to manually build reports.

    Once you’re able to visualize this data with a modern dashboard-driven analytics tool, you can use that information to constantly assess and evaluate system development and delivery productivity, and help developers make behavioral changes. You will have the necessary information to tweak processes and tooling and better educate team members.

    For example, if your software quality drops below its KPI-defined baseline and your metrics show increased efforts utilized to resolve break/fix issues, you can make a valuable correlation leading to smarter actions to improve quality, such as tweaking or changing testing methods and possibly using more effective testing tools.

    In this way, continuous improvement becomes embedded in your software delivery architecture, as you’re no longer making gut-based decisions that require you to wait for an outcome and guess again. Instead, you’re using data to drive strategic, fact-based shifts in behavior as you develop software, with the knowledge that these changes will have a real impact on the business.

    Making Continuous Improvement Across Platforms

    Ultimately, continuous improvement must reach across platforms in your organization—from the cloud to the mainframe. Development teams should work to continuously improve system delivery across all development platforms.

    The KPIs mentioned must apply to the entire development team and business, not just developers on one particular platform or skill set. You want to identify KPIs that are critical to the successful delivery of systems that support your customers, employees and business partners.

    Now that we have covered the importance of continuous improvement through the use of system delivery KPIs, stay tuned as we explore the individual topics of quality, velocity and efficiency at a deeper level in subsequent articles.

    — Rick Slade

  • Incidence Avoidance in Action

    Incidence Avoidance in Action

    Today, CIOs are faced with the challenge of making enterprise technologies perform on par with offerings from consumer-facing technology leaders, such as Facebook or Netflix, meaning technology or services being seamlessly available with no performance lag. Of course, these expectations are not always aligned with the realities of managing complex hybrid enterprise systems that were not necessarily designed to deliver this type of performance.

    On the other hand, IT operations supporting new-age “digital” business services are dealing with on-demand resources that are supported by software-defined data centers extending into the public cloud by using serverless computing platforms. This is resulting in a “new generation hybrid enterprise” that must deliver the functionality of, and operate as, real-time infrastructure.

    Lexmark, a U.S.-headquartered global company that manufactures laser printers and imaging products, wanted to achieve zero latency operational performance and enhance its business processes to achieve incidence or error avoidance.

    This article details Lexmark’s IT objective and the solution implemented by Wipro Ltd., a global information technology, consulting and business process services company.

    Problem: Lexmark required a technology solution that would provide visibility into its core business process—managed print services. The solution would also need to factor in other supporting systems and functional processes. The objective was to achieve operational excellence by minimizing errors and risks.

    Solution: To address this critical IT operations problem, Wipro was able to incorporate unique design principles to create an operationally simple, scalable and focused solution that brings IT and business process owners to a common understanding regarding achieving incident avoidance.

    Wipro built a new way of visualizing operations management, based on the fundamentals laid out by IT operational analytics (or AI operations, as it is called now).

    Working only with the tools and data that Lexmark already owned, Wipro and Lexmark created a system that measured the heartbeat of Lexmark’s managed print services business. That heartbeat was synchronized to the printer data collection systems, with the thresholds determined entirely by machine learning techniques. Every underlying system was arranged in a “server room.”  Only out-of-variance conditions are displayed in the main visualization panel, with the root cause just a single click away. This paper provides insights into the challenges faced by IT enterprises to deliver an on-demand solution to clients, similar to the ones offered by digitally evolved B2C companies.

    Digital enterprises that use hybrid environments must respond in real-time and need to achieve incident avoidance, rather than incident management.

    If we look behind the scenes at operation command centers today, we see operations that struggle to keep up the pace. Very few operations have been built from the ground up. In the enterprise world, Severity 1 (incidents that are categorized as high impact by business users) incident resolution times, still run for a couple of hours if IT support is not in a position to find the root cause of the problem. The culprit is often the lack of a proper configuration management database (CMDB), insufficient logging or lack of application discovery and dependency mapping. Every IT professional can recognize these failings, yet projects to correct these flaws never seem to get the necessary capital appropriation. Clearly, a new approach is needed to fix this.

    Identify the Business Process

    The process should start by identifying the key driving force or the heartbeat of the core business operation. Depending on the industry, this heartbeat might be customer orders, service requests or vendor purchase orders. All other systems are connected to this heartbeat. To select the right attribute to monitor as the heartbeat, start with business analysts who have a good feel for the day-to-day struggles of the operation. These analysts often have a series of scripted reports they run to track system health. More advanced analysts might even have automated these with alerts. By leveraging this information and using data discovery techniques, we found that the values can be configured as business KPIs.

    In the case of Lexmark, Wipro streamed the KPI values in real time and used machine and wire data to broadcast the underlying monitoring components by using an existing streaming analytics platform that is supported by AI and machine learning techniques. We found that the amount of data needed to assess process health is time sensitive, and normally less than 24 hours of data is displayed during that time.

    The platform visualization shown above, tracks the creation of sales orders for a business unit. The green line represents the flow of orders through the system. Any anomaly in an underlying system is reflected directly on this flow. This is achieved by streaming analytics and AI techniques that use the business KPIs.

    Apply the Architecture Overlay

    The next step is to subordinate the supporting infrastructure to the business process heartbeat. This feat is accomplished without complex business rules and sophisticated orchestration engines. We call this the “server room” and it is a view of the entire infrastructure on one web page, leveraging a lattice chart format that allows for easy comparison. Each of these underlying components will have a direct impact on the business process.

    Applying the same streaming analytics and AI/ML techniques that identified the anomaly in business process, we identify what is causing that anomaly and can quickly see the problem areas.

    Color coding helps the technician quickly understand the severity of the event. Blue indicates the system performance has not yet violated the set threshold, but an underlying infrastructure issue exists and needs to be proactively addressed. Amber indicates the system has violated the warning threshold. Red indicates the system has violated the critical threshold, a condition that by design we will never allow to happen.

    The user can scroll over any given point and a callout box will display the actual level, as well as a brief note on what has gone wrong and the timestamp.

    Analysts can now instantly focus their efforts on the specific systems that are in an error state, even if an event has not yet created an incident.

    Machine Learning to Define the Thresholds for an Anomaly

    What is normal behavior? This is often the most difficult question to answer because common monitoring and management processes rely on a single data value that was set during implementation. But thresholds must be extremely flexible to capture the ever-changing nature of the business process. Batch jobs that run at midnight, end-of-month closing activities, shift changes and a host of other potential variables must be considered when determining the right thresholds.

    For any component supporting the business process, we need to understand what is normal for right now. To determine that at Lexmark, we applied machine learning to dynamically set the thresholds for each sub-system at the month, day and hour level based on the healthy business KPIs we established.

    Incident Avoidance, Not Incident Management

    To fully understand the potential of this approach, it is necessary to change the way system analysts interact with the system. IT professionals who have been doing system support for several years, may be conditioned to react to the work in their queue. A well-honed incident management process is the enemy of proactive action that can prevent emergencies.

    By aligning the underlying system activity and thresholds with the business process, the IT professional can truly understand the whole environment, not just their individual technical component. The most effective analysts will extend their knowledge into other business areas. At Lexmark, we discovered that we were able to solve “intractable” performance issues by simply adding hardware or capacity.

    Integrated IT operations is not a goal, it is the means by which digital enterprises can be managed in real time. The path to real time management is through service capacity guarantees, performance and availability management and using anomaly detection in the context of the business process to identify issues well before an incident occurs. We advise starting small and building an anomaly detection system for the heartbeat of the process that enables you to see both the forests and the trees.


    This article was co-authored by Murthy Malapaka, general manager, Transformation Services Cloud and Infrastructure Services at Wipro Ltd. He helps enterprises digitally rearchitect their operations to run on hybrid IT environments to achieve incident avoidance instead of incident management. He has assumed various technology leadership roles across application and infrastructure architecture domains, specializing in availability and reliability. Murthy has been providing consulting services to CIOs and CTOs in their journey from client server to on demand infrastructure services.

    — Brad Clay

  • Can DevSecOps Prevent a Zombie Apocalypse?

    Can DevSecOps Prevent a Zombie Apocalypse?

    Making consistent progress within any DevSecOps initiative often can be an overwhelming undertaking. Developers tend to outnumber operations dramatically, with little to no security accountability. This leaves DevSecOps doomed to work with the same network security stack that was originally designed decades ago for on-premises environments. Still, the expectation is to support shrinking deployment cycles on cloud-native and hybrid environments without compromising on security standards.

    To deliver on such a tall order, DevSecOps teams are armed with security groups and access lists (which are more of the same distributed firewall technologies) to secure a perimeter that essentially no longer exists. This article will help you figure out how much time you have left before your CI/CD pipeline is overrun by zombies (quite literally) and what you can do about it.

    Why Cloud-Native Environments Choke on Rule-Based Network Management

    Rule-based management of network infrastructure has worked for decades—and no doubt will continue to support many enterprises well into the future, unless your production environment includes a public cloud footprint that supports continuously deployed release cycles. That’s when things start to get a little weird. Instead of letting go of the binary perimeter premise (inside versus outside) and redefining it completely, security practitioners have essentially re-created multiple virtualized perimeters in the public cloud. In theory, you could spin up at least as many perimeters as you have running instances. Unfortunately, the same network rules that worked well for the one perimeter break down in a virtualized environment that has hundreds of instances supporting dynamically changing requirements. In fact, the very nature of the cloud is driven by business logic at the application layer, which is decoupled from network infrastructure by design. This creates a Catch-22 situation for cloud-native security pros, forcing DevSecOps teams to manually map network rules to highly agile and virtualized business logic. No human can realistically deliver results over time (and stay sane). The reality is, rule-based network management can never keep up with the requirements of cloud-native business logic.

    With Great Agility Comes Security by Bureaucracy

    Regardless of how skilled DevSecOps teams are, or how motivated they are to lead the brave new world of continuously secure deployment, the harsh truth tends to be disappointing. While DevSecOps presumably aspires to deliver agility without compromising on security, practitioners spend much of their time doing just that. Trapped by a security culture that has favored bureaucracy over automation for decades, DevSecOps tends to perpetuate the very dichotomy that triggered the emerging practice. In a cloud-native culture driven by innovation and automation, agility comes first. This inevitably becomes an exercise in futility—the more agile your deployment, the more vulnerable you become. That means giving up on the very idea that rule-based network management is a viable security methodology. The complexity of managing several dedicated security groups (up to five) for every instance rapidly spins out of control. Given the imperative to maintain the cloud’s agile environment, many teams consciously sacrifice security on the altar of agility, leaving a gaping attack surface vulnerable to unrestricted access.

    Welcome to Cloud-Native Multi-Perimeter Security

    The challenge is to prevent any unauthorized code (benign or otherwise) from infiltrating cloud deployments before any sensitive data or workloads are compromised. In the absence of robust automation to support this process, the challenge is often ignored. When that doesn’t work, the solutions often remain in the realm of bureaucracy, focusing on anecdotal symptoms without addressing the root cause.

    The inevitably grim question is not if your deployment is at risk, but how vulnerable you are and how soon is likely too late. The results are measurable and often disturbing. Below is the standard KPI checklist most DevSecOps are familiar with:

    1. Rogue workloads unauthorized by CI/CD pipeline. These are typically addressed by discovery tools and ad-hoc network scans but are all too often accepted as a necessary evil.
    2. Faulty network rules. Microsegmentation initiatives often lead to unexpected inter-workload communication.
      Workloads deployed via the CI/CD pipeline could fail to communicate effectively—or worse, communicate to support counterproductive or even malicious activity.
    3. Unexpected workload communication to Third-Party PaaS. A case in point is workload communication to a database such as S3, which could lead to a data breach. Well-documented cases include leaders, such as Accenture and Time Warner, that unwittingly enabled public access to S3 buckets storing sensitive customer data and access credentials.
    4. Network Security Configuration Mistakes. Vulnerabilities introduced by network security configuration often go unchecked for months. Such unrestricted access is commonly cited as the attack vector that enabled unauthorized actors to infiltrate a gaping cloud-native attack surface.
    5. Zombie Workloads Consuming Resources. At best, you’re just wasting resources. All too often, one of those zombie workloads is busy cryptojacking, mining cryptocurrency on your company’s buck unnoticed. Cryptojacking is so rampant, it has overtaken ransomware in 2018 as the most popular attack vector.

    The bad news is, no cloud deployment can eradicate the above issues entirely, using familiar technologies. However, you can mitigate some of the damage: Scan your network more regularly using your favorite open source tool (check out a great example implemented on Netflix Security Monkey presented by Ryan Hodgin). Never leave an entire network flat granting anyone unrestricted access. Ideally, take the time to evaluate new technologies designed to secure cloud-native deployments.

    DevSecOps teams are gradually accepting that cloud-native deployments require a fundamental paradigm shift to sustain a defensible security posture without sacrificing agility. Many believe (this author included) that we are witnessing a cloud-native security revolution, much like the one triggered by the internet in the 1990s. DevSecOps can certainly address the symptoms described above, but security policies will continue to fail miserably if they both remain entrenched at the network layer and rely on bureaucracy.

    — Ran Ilany

  • DevOps Storytime: The Line, The Loop and The Cube

    DevOps Storytime: The Line, The Loop and The Cube

    In a time not so long ago, but long enough to be before the mainstreaming of magical ideas such as “configuration as code” or “platform as a service (PaaS),” in a period where the enterprise IT shops were ruled by the one-two punch of Six Sigma and ITIL, there were three magical artifacts sought by the people who spent their working days lubricating the gears of the consulting, development and operations factories throughout the lands of corporatedom.

    The three mystical objects consisted of The Line, The Loop and The Cube. Each were first envisioned as possibilities by “automation zealots” as they roamed the corporate cubicle farms in vain attempts to provide enlightenment to their enterprise brethren. As the quest to drive evermore efficacy out of technology shops of all shapes and sizes has progressed, strategists, designers, architects and developers have been slowly creating these possibilities into being. Much like the legend of the Deathly Hallows, if these once-mythical objects come fully into being, the enterprise that can behold all three of the artifacts can create the nigh invincible product/technology factory as it becomes the master of time.

    Continuous Integration – The Line

    In conceptual land, The Line was just what it sounds like: a singular line, never bending and never deviating from its course. It connected the space from development to production. The idea of The Line has been around a long time—long enough for many shops to now have working implementations running as standard operating procedure. But it wasn’t always this way.

    circlesquareIn reality land, The Line was a patchwork of open-source frameworks, glue code, xml files and a few engineers unlucky enough to be tagged with role of “Build Master.” Woven together by the Build Master, these transformative robots and would take coders’ output, compile it into a workable build that merges all of the developed functionality, run and validate test harnesses against it. Once validated, the newly minted build then would be promoted to the higher-level environment, ultimately moving from dev to test, test to stage and, lastly, from stage to prod.
    The tools to build and manage The Line have been through many iterations since it first came into use and many shops have progressed far enough into the advanced territories of The Line to call themselves masters of the once-mythical Line. The shops exploiting The Line are now so prolific and the tools have advanced enough that it’s no longer an onerous task to get change-resistant enterprises to try it out.

    The Line has transformed from mythical artifact to concrete reality so much so that the believers now outnumber the holdouts. The end result is that shops not embracing the basics of continuous integration risk losing credibility in the eyes of their staff and any potential recruits.

    OODA is a Way of Being – The Loop

    When someone starts talking about “getting the right information to the right person at the right time,” that person is talking in fairly vague terms about the the long sought-after grail of The Loop. The Line is a good start, but the robot watching the line is only as smart as the humans who created and configured it. This is one of the many reasons to chase The Loop.

    What is the use in “shifting left” if you can’t get the alerts and metrics to the people who care? How can the metrics from “shifting left” be acted upon if they can’t be pushed into the view of those who can act upon them? The Loop is the answer, because it is the mechanism to determine many things beyond “the right person.” The Loop knows how to get messages to all interested and responsible parties. The Loop has mechanisms to account for an ever-fluid organizational structure and backup delivery methods for backup delivery methods.

    All enterprises have feedback loops. The key differentiator for moving toward mastery of The Loop is the degree to which you have automated the and abstracted the mechanisms inside the feedback loops.

    Many people and enterprises are resigned to life without The Loop. The signs are easy to see if you know where and how to look. Are mail distribution lists and org charts always a pain in your organization? Are executive-led fire drills the norm when systems are down? Are system alerts dropping on the floor rather than getting to the first responders and application owners?

    If you answered yes to any of the above, your enterprise has not committed to developing and leveraging The Loop. Basic “loop-like” alerting functionality is commonly available from alerting vendors, but true mastery of The Loop cannot be achieved without robust identity management and synchronization technology. Without this critical integration point, alerts and information flow can only be as effective as your manual processes that update the myriad data islands in each and every alerting system within your enterprise.

    When enterprises grow, being able to have the enterprise robot army seamlessly drive information flow without requiring sieve-like manual processes is also the key to tightening the enterprise OODA (observe, orient, decide and act) loop. Done with full mastery, one could imagine the possibility of acquiring the last of the three magical grails and maybe the most sought after: The Cube.

    Perceiving the Matrix – The Cube

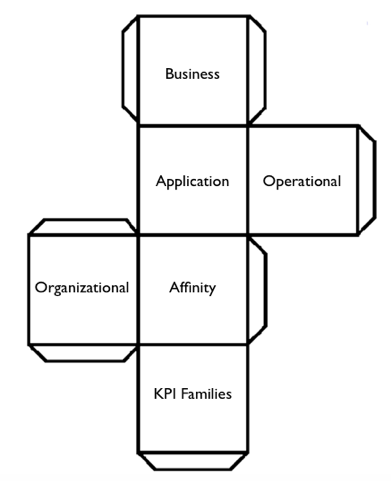
    The story of The Cube begins with a question: “What defines the so-called ‘right’ information?” When enterprise technology and design evangelists talk of The Cube they often wax poetic and describe it as all things to all enterprise people at every level within the organization. It provides not only the integrated matrix of the fully faceted enterprise from an organization perspective, but also extends beyond operational information rights into decision rights, affinity groupings and cross-functional teams.

    cubeWe have begun to see promising beginnings of The Cube pop up within medium and large enterprises through popularizing algorithms and outfitting teams with ubiquitous mission control-style dashboards and screens in team areas. But it is only when these dashboards can integrate and harmonize wide varieties of development, operational and business KPI data that we will be able to claim that we have delivered full and timely context (i.e., “the Right Information”) to the staff sailing the enterprise ship.

    The hard part of creating The Cube is not so much the technology required to achieve its development and integration. The really difficult part is coaxing the organizational will to define and maintain the KPI taxonomies for each organizational unit and the integration points between them. Given that a fully mastered Loop doesn’t necessarily understand how KPIs, infrastructure and applications interrelate and affect each other, the Loop will forever be but a required stepping stone to The Cube.

    Will a Unicorn be Required for Unification?

    The current landscape of open-source and vendor tools to wield and tie together these ungainly enterprise models may not, as of yet, be sophisticated enough to both integrate and simplify the provisioning and cultivation of The Lines, The Loops and The Cubes. The sultry, siren-like call of the Unicorns, however, will likely beckon the cloud builders of today and tomorrow to create not just development to deployment pipelines, but also fully integrated feedback loops with intelligent understanding for how the data connects to form perspective.

    It is odd to think about, because with the idealized future state so close to actual possibility, it begs a new set of questions. Hordes of IT professionals around the world have been working to find faster and more fool-proof ways to deliver meaningful perspective into the hands of decision makers and first responders. We are so close now to that mission being accomplished that there are a few instances of the perspective itself not only being generated by “the robot” but also being handed to “the robot” to take the necessary remediation steps.

    The ending we are approaching, much like the beginning, circles around a question: “If we truly automate all the things, will there be any more work to do?”