Tag: key performance indicators

  • Maintaining Exceptional Quality Despite Shrinking Delivery Deadlines

    Maintaining Exceptional Quality Despite Shrinking Delivery Deadlines

    My first article in this series focused on the need for continuous improvement across three key dimensions of software development–velocity, quality and efficiency. While these are all equally important, in this piece we’re going to focus more specifically on quality.

    The past few months—what you might call the summer of outages—have been troublesome for many of the internet’s biggest players. Google, Apple and Cloudflare, as well as Facebook, Twitter and LinkedIn, have all experienced bouts of unplanned downtime, sometimes even multiple bouts in quick succession. Is this all just a matter of coincidence and bad luck? Perhaps, but peeling back the layers reveals an increasingly painful reality of modern DevOps life.

    While the root causes of these outages were varied, several were blamed on software glitches. This suggests software rollouts may be happening before they are comprehensively battle-tested and ready for production-level systems. This is never a good idea, especially when you’re dealing with high-profile services supporting millions of users worldwide. In these cases, software-related stumbles are that much more damaging.

    When software is rolled out prematurely, a cardinal rule of development is broken in that we, the end-users, become the unwilling guinea pig for poor-quality applications. No matter the pace of rollouts, an unwavering focus on quality needs to be maintained, and automation, integration and measurement can be the keys to ensuring this.

    Automation

    Automation refers to a pre-programmed process that executes tasks with minimal human intervention. The more you automate, the higher your quality should be. Avoiding manual intervention decreases the likelihood of less optimal techniques or human mistakes, both of which can lead to poorer application quality and customer satisfaction. Essentially, automation enables the best techniques and practices to be quickly and easily replicated.

    Consider the example of automated unit and functional testing. If you can automate the execution of the best testing scripts incrementally across code units and functions, you can test more accurately, not to mention more quickly. The benefits will increase exponentially with the additional layers of testing you can automate. We recently worked with a customer who realized an overall ROI of 467% from their investment in automated unit testing.

    Integration

    Modern applications are increasingly componentized, spanning multiple platforms. Consider an e-commerce application, where the front-end may reside on a system of engagement (such as a web server) while the back-end transaction ultimately occurs on a system of record, such as a mainframe.

    High-quality, end-to-end digital services ultimately depend on all critical components being universally and automatically included and prioritized in DevOps pipelines. Similar to automation, this is because any time manual effort is introduced into the integration process, you increase the chances for error and consequently, the risk of a particular code segment lagging behind others.

    The end result? More defects making it into production in the sprint to the finish line. It’s like the famous I Love Lucy chocolate assembly line episode, which offers a humorous visual interpretation of the chaos that erupts once human intervention is introduced into a process.  Ideally, seamless toolchain integrations, across multiple application-leveraged platforms, can be utilized to maximize quality outputs leveraging DevOps technologies you’re already using, such as JIRA, Jenkins and SonarQube.

    Measurement

    Improving quality depends on development teams constantly improving their methods. This can be achieved through ongoing measurement against key performance indicators (KPIs).

    The challenge is establishing relevant KPIs, and we have seen many development teams fail at this. The most effective KPIs are those that translate to real business impact. For example, “number of bugs released into production” is a commonly used metric, but it does nothing to convey the bottom-line cost of those bugs. A more effective metric would be the cost of resolving defects, with success being declared when the organization reduces the amount of money spent on fixing bugs.

    The cost of fixing a bug is much less when it takes place earlier in the software development lifecycle (for example, in the coding and unit testing phases) than when the software is near or already in a production state. When a development team can consistently show it is reducing costs through earlier identification of bugs, this puts them in a stronger position to justify investments in better testing and analysis tools.

    Conclusion

    We’ve long known about the challenges DevOps teams face to balance velocity and efficiency with a high degree of software quality. It’s like asking a circus performer to sprint across a tight rope. It may seem unfair, but the need to release high quality software faster and faster, while staying within budget, is not going to abate any time soon.

    The recent spate of outages has taught us that even the biggest and the strongest in the industry are not immune to immense speed pressures, and the quality stumbles that often result. Automation, integration and measurement can help development teams in their ongoing quest to meet the seemingly conflicting requirements of improving quality, velocity and efficiency—at the same time.
    — Rick Slade

  • Measuring Success in DevOps: Top Four DevOps KPIs

    Measuring Success in DevOps: Top Four DevOps KPIs

    There is no news in DevOps concept. Many companies have integrated DevOps to improve and accelerate software development and help drive their digital transformation, and that number continues to grow exponentially. There are now entire tool ecosystems, methodologies and transformation models—as well as endless resources—available to guide companies along the DevOps journey.

    But DevOps success can be difficult to measure. DevOps isn’t a formal framework; it’s more of a culture and a set of practices, and there is limited guidance available to ensure you’re doing it properly or accurately measuring your successes and failures. DevOps also looks different in every organization—no two DevOps shops will be the same.

    However, despite the nebulous definition of what a DevOps organization looks like, there are some core key performance indicators (KPIs) that should be common to all DevOps environments: asset management, monitoring, continuous integration/continuous deployment and continuous security.

    Asset Management

    In this context, asset management means measuring what is automated and how effectively it is controlled. It doesn’t matter if you are using tools such as Puppet, Chef, Ansible or Terraform; what matters is how effectively you use them. These tools allow you to automatically provision bare-metal or cloud assets, as well as join a load balancer and receive traffic. However, you can achieve similar results from Kubernetes or chaining lambda functions. Automation is really about controlling assets to achieve your business goals.

    Whether you’re using on-premises virtualization or cloud workloads, taking the time to streamline your processing cycles down to the minimum hardware required can significantly reduce monthly costs. The higher the percent of your servers, containers, services, etc. are automated, the less time you’ll spend fixing and maintaining your infrastructure. Some of your applications may be uniquely configured to your particular organization, and therefore cannot be automated. However, if applications cannot be automated, it might be time to retire them and build next-generation applications.

    Monitoring

    Should you be monitoring all of your resources? Yes. Should you also filter out the noise? Absolutely. Monitoring agents should be deployed to all of your servers, and if your PaaS tools and other providers have integrations, you should be using them and parsing out unneeded data. The only thing worse than not monitoring anything is monitoring everything without proper filtering.

    Good monitoring should always be coupled with utilizing the information acquired. Capturing logs, parsing them and using tools such as ELK, Datadog or Sumo Logic, for example, give you a large kit that can not only capture and glean useful information from a tremendous amount of data, but can also make decisions and perform predictive analyses. You might learn your stack is operating inefficiently, or not scaling fast enough during peak utilization periods.

    Disparate systems should be aggregated into a common tool, lest you spend valuable time combining information across systems or pulling information from data warehouses to get your insight. Let the tools do that work for you. You should also be using tools such as Logstash to pull and understand application, database and other logs in your stack for meaningful data. If not, you’re limiting your insight into the service’s health.

    Continuous Integration/Continuous Deployment

    Continuous integration and continuous deployment (CI/CD) is the difference between releasing software once a quarter (or year) and performing dozens of releases to production within a day.

    But it’s one of the most difficult indicators to measure, since every environment is different. It is important to understand how many code commits don’t make it past your integration environment. These blockages could be the result of poor programming practices, poor code quality or poor testing. However, if features stay in dev or integration for too long, there is surely an underlying issue. In most cases, it centers around automated testing.

    So, how do you measure good testing? This is one of the most difficult questions enterprises face, especially when automated testing is added after monolithic applications are already written. Essentially, good testing is about creating good business logic and integrating testing that meets most use cases, while covering each function and class. Immediate feedback on failed or successful tests expedites the automation process. The less automated testing is built, the more QA has to test by hand. Failing to integrate good business and integration testing slows down the entire CD part of the pipeline significantly. Also remember shooting for 100% test coverage is unrealistic—over 80% should be sufficient.

    It’s also important to remember applications that are not in a pipeline and must be manually tested will never keep up with the pace of cloud-born innovation. If you are dealing with a giant, monolithic legacy app, it’s time to design its replacement (starting with testing). Pipelines should also have notifications built into them, with chaining logic to react to failures. Tools such as Jenkins, CircleCI, TravisCI and most code repository solutions, such as GitLab, offer rich feature sets to aid in pipeline creation and management.

    Continuous Security

    The easiest way to ensure security compliance is to shift left and resolve security issues in the development stage. Too often, security is applied at production, which means it’s not part of the environment’s end-to-end process. Securing applications and networks at the development level will give you more confidence that applications will interoperate properly at the production level.

    After shifting left, make sure you continuously deploy and monitor your clusters, nodes and pods in a secure manner. Ideally, you have a tool that provides a real-time summary of your cluster’s compliance and security status by looking at workload security and governance checks, cluster worker node CIS Kubernetes Benchmark checks, cluster Ingress controller security best practices and istio security checks.

    DevOps Success Never Ends

    Success in measuring your core DevOps KPIs is not about getting to full automation immediately—it’s about understanding your biggest issues, continuously securing them and improving them over time. DevOps has no end; success requires continuously measuring your progress and improving your environment with the most effective and up-to-date tools. Take control, implement thorough and meaningful monitoring, deliver with confidence and do it securely.

    — Gadi Naor

  • Focusing on the True DevOps North Star: Continuous Improvement

    Focusing on the True DevOps North Star: Continuous Improvement

    When we look beyond the fundamentals of tearing down silos and establishing greater collaboration, communication and transparency, DevOps is a label assigned to a framework of best practices and technologies that organizations leverage to deliver systems faster, more efficiently and without sacrificing quality. The best practice within that framework is continuous improvement, which provides stakeholders with data and feedback to constantly improve their ability to deliver products that advance strategic business objectives. This is done through key performance indicators (KPIs) that align with the goals of the business.

    Continuous improvement thrives on a robust program of KPIs that measure key attributes of a successful development team in the context of what is important to your organization. These KPIs provide you with the opportunity to continuously evaluate your system delivery processes and supporting technologies, and identify opportunities to make changes that produce better outcomes. In general, all organizations should be continuously improving their system development and delivery against three primary KPIs:

    • Quality: The value and performance of software you deliver to customers.
    • Velocity: The speed at which you develop and deliver software to customers.
    • Efficiency: The ease (low resource consumption, minimal latency) with which you develop and deliver software to customers.

    For now, let’s focus on what’s required to continuously measure and improve against them.

    Continuous Improvement KPIs vs. Metrics

    KPIs provide baselines for minimally acceptable performance levels across critical areas that impact the success of your business. Metrics measured against these KPIs help development teams improve what they’re doing to support the performance of the business in light of its goals.

    There are hundreds of metrics available (escaped versus trapped defects, features deployed and mean time to X, to name a few). The problem is most organizations focus too much on non-business-related metrics and data points and end up measuring the wrong things, such as how many lines of code have been written. This data may be interesting, but it tells you nothing of how well or within what time frame the code was written, or how that affects the delivery of value to customers.

    Your metrics should align with the goal-oriented KPIs of your business. For example, if a goal is to increase the quality of software after an influx of customer support issues related to defects, you should measure how many defects are escaping and how many are being trapped in testing. However, the remaining challenge for most organizations is actually capturing this metrics data to accurately measure progress and continuous improvement against, for example, a quality baseline.

    Collecting Data for Continuous Improvement

    A large reason organizations struggle to capture the right metrics data is they rely on outdated project management tools and manual effort. Developers and other team members painstakingly capture and contribute metrics data through status reports and meetings. Project managers then spend the bulk of their time analyzing and producing even more reports to provide the necessary feedback to support continuous improvement.

    In a digital economy where fast beats slow, this slow approach of manual data collection constrains and negates the business objectives of increasing quality, velocity and efficiency simultaneously. Core to Agile is the production of working software and minimizing the amount of work not directly related to that endeavor. If you want to move to an agile, iterative world, you want to minimize activity or any work that’s not directly related to the software delivery effort.

    That’s why, for true continuous improvement, you want your tools to automatically produce the right metrics data to measure and continuously improve upon KPIs, rather than relying on developers to attend status meetings and feed project managers information used to manually build reports.

    Once you’re able to visualize this data with a modern dashboard-driven analytics tool, you can use that information to constantly assess and evaluate system development and delivery productivity, and help developers make behavioral changes. You will have the necessary information to tweak processes and tooling and better educate team members.

    For example, if your software quality drops below its KPI-defined baseline and your metrics show increased efforts utilized to resolve break/fix issues, you can make a valuable correlation leading to smarter actions to improve quality, such as tweaking or changing testing methods and possibly using more effective testing tools.

    In this way, continuous improvement becomes embedded in your software delivery architecture, as you’re no longer making gut-based decisions that require you to wait for an outcome and guess again. Instead, you’re using data to drive strategic, fact-based shifts in behavior as you develop software, with the knowledge that these changes will have a real impact on the business.

    Making Continuous Improvement Across Platforms

    Ultimately, continuous improvement must reach across platforms in your organization—from the cloud to the mainframe. Development teams should work to continuously improve system delivery across all development platforms.

    The KPIs mentioned must apply to the entire development team and business, not just developers on one particular platform or skill set. You want to identify KPIs that are critical to the successful delivery of systems that support your customers, employees and business partners.

    Now that we have covered the importance of continuous improvement through the use of system delivery KPIs, stay tuned as we explore the individual topics of quality, velocity and efficiency at a deeper level in subsequent articles.

    — Rick Slade

  • ‘DevOoops’ Moves: Poorly Defined KPIs

    ‘DevOoops’ Moves: Poorly Defined KPIs

    DevOps’ ultimate aim is to create efficiencies in the software delivery process. But, it doesn’t always work out that way. Sometimes DevOps initiatives lead to mistakes—something we lovingly call a “DevOoops.” CloudBees recently polled some colleagues and came up with five examples of a DevOoops in action. The following is a discussion submitted by product marketer Juni Mukherjee about poorly defined key performance indicators (KPIs).

    Scenario:

    How we define KPIs can change the game. For example, one quality engineering team defined the number of tests executed per sprint as a success metric. Humans are driven by incentives and the natural tendency of the team was to add more and more tests without even considering archival of outdated ones. Think of this: We could have a larger impact with fewer tests and, more importantly, fewer tests lower the test cycle time. So, instead of sheer quantity, we should focus on the coverage and effectiveness of tests. Similarly, a release engineering team defined the number of releases per sprint as a success metric. The number of releases reflects on velocity for sure. However, releases move bits from point A to point B without assessing the value added to business. It is critical to tie a business KPI (such as the number of new customers acquired, percentage of revenue increase, etc.) to velocity, such that we know we are investing in valuable speed and not suicidal speed.

    Management consultant Peter Drucker boiled his whole philosophy down to the following few words: “If you can’t measure it, you can’t improve it.”

    Successful DevOps leaders take this saying to heart. To understand where they’re going, how to get there and ultimately how far they’ve come, these leaders know how critical it is to establish KPIs that fit the overall objectives of their DevOps transformations. KPIs provide appropriate and continuous insight—and they plot a route to help you get to your destination.

    The big question is: Are you measuring the right things? If not, you could be spinning their wheels.

    To avoid this “DevOoops” scenario, you need to start by establishing KPIs that not only align to your objectives but can also be established so that they create a continuous feedback loop. As the project progresses, as you mature and learn more, you will likely need to maintain, monitor and possibly adjust and update these KPIs.

    What would be an appropriate test coverage goal? Teams all want to improve quality. But by how much? Seventy percent? Eighty percent? One hundred percent? This is an example of a KPI that needs to be considered in the context of your application as well as measured against your real objective.

    You can have 70 percent test or code coverage, but if that’s just treated as a measure to test as much code as possible, you may miss the mark. If you are covering 70 percent of the wrong code and the 30 percent that’s missing is critical code, you’ve put in significant effort with the risk of little or no return on quality level.

    In terms of your goals, increasing and monitoring test coverage may be an indicator of quality, but it may not measure your actual quality of work. In this case you want a KPI that’s measuring the outcome rather than the activity. Look at what is severity 1 and severity 2 defect rate in production. You can see code coverage get to 90 percent, but if you’re not seeing a decrease in severity 2 defects, you won’t really be seeing an improvement in our code coverage metric.

    Takeaways: 

    • You’re not implementing DevOps just to say you’re doing it; you need to develop goals and objectives for your initiative and align to them.
    • Once goals are defined, you need to align KPIs and success metrics to those objectives. Properly defining these success metrics and KPIs will dictate what gets prioritized when building pipelines.

    — Brian Dawson

  • How Nailing Predictability Can Double the Size of Your Business

    How Nailing Predictability Can Double the Size of Your Business

    In a rapidly changing world, predictability has never been more powerful. It’s also never been so underrated. While it is easy to think about predictability in terms of repetition or even monotony, predictability in business means being able to correctly estimate how long it will take to complete a project and how risky it is. But maintaining predictability means a few other crucial things: better allocation of resources, less overspend on projects and a deeper understanding across teams on what’s happening with a project. All of this leads to one thing every business ultimately has their eye on: profit.

    One of the biggest pain points in business is delivering projects on time and on budget. Your latest project might be innovative and essential to the future success of your firm, but the truth is, there’s every chance it will cost more than you think—despite your best budgeting efforts—and take longer to complete. In fact, a study found 66 percent of projects in the software industry were not completed on time, 33 percent were blowing their budgets, and 17 percent were not returning the value stakeholders expected. When we’re looking at 17 percent of projects having the potential to take the entire company down with them, it’s not something to be taken lightly.

    This continues to be a massive problem for the software industry. What is needed is more transparency and higher levels of predictability built into processes, which can eliminate obstacles such as project overspend, delays and unhappy customers. I know this from personal experience. We managed to increase the predictability of our core processes by 102 percent in nine months, and as a result, half of our new contracts have been from referrals made by satisfied customers, that in turn received more accurate quotes and time frames for their projects with us.

    To achieve this, you will need to establish KPIs that define predictability and then design tools which consolidate and capitalize on this data. It won’t be easy, but you will have more control than ever before—which is the perfect foundation for innovation. It had always been one of our goals to become more predictable and put the necessary tools, processes and metrics in place when COO Marek Talarczyk made it a priority in January 2017. When you can accurately measure how long something will take, and how risky it is, you can plan costs and revenue, and thus become a valuable partner for other business entities. There will also be fewer problems for key stakeholders, which leads to increased customer happiness and trust. Once your predictability data is consolidated on a single platform, you will also be able to use it to make better hiring decisions in the future, or—as we did—develop a traffic light system which uses a machine learning algorithm to identify which projects are likely to have issues, and then isolates the potential cause. Tools such as this helped us almost double in size in 18 months. Before we made this effort, we were often wasting time and money dealing with project crises.

    Most importantly, companies who can help other companies become more predictable will lead the way in software, design and digital transformation. It means they can develop a precise plan for their business and marketing strategy in advance of the product launch—which is not based on a best-case-scenario guess, but reliable data. There will also be fewer awkward, dissatisfying meetings about cost blow-outs; your key stakeholders can prepare for the costs of development and won’t be surprised by the sudden need for extra budgeting.

    Just remember, the goal is to make accurate predictions on how your projects will play out—and not judge team members based on the KPIs generated by these new tools. Overcoming this concern was one of the first hurdles we faced, but it’s simply a matter of explaining your true intentions. It’s all about solving problems, while predicting challenges and obstacles.

    — Wiktor Schmidt

  • DevOps: Metrics Do Matter

    DevOps: Metrics Do Matter

    One of my favorite quotes about metrics or KPIs is from Jim Fowler, CIO of GE Capital: “Don’t measure me on cost or traditional IT metrics, but on the metrics of the business.”

    It’s a perfect tee-up for me to talk about metrics in the context of DevOps.

    DevOps is the movement of enabling a business via technology or the ability to look at business processes and issues to mitigate them or achieve a goal.

    The Importance of Metrics

    DevOps has as one if its five major principles the concept of measuring (CLAMS: culture, lean, automation, measurement and sharing). DevOps helps the business understand how it uses and benefits from its second major resource after people: technology. This is where key performance indicators (KPIs) come in, though hopefully not KPIs such as this:

    a

    This specific KPI was created to show the productivity of developers, using lines of code written as the measure. Could you use or explain this? It’s a great example of metrics or KPIs that are based on bygone times of being complicated, disconnected from business goals, or driving the wrong behaviors by placing quantity ahead of quality.

    Catch the Ball

    DevOps enables everyone to work together toward a common goal. The DevOps lifecycle approach of creating a strategy, figuring out how to do it, introducing those steps, checking the results and, via feedback (people or tools), improving that strategy or product aids in improving the use and proving the benefit of IT.

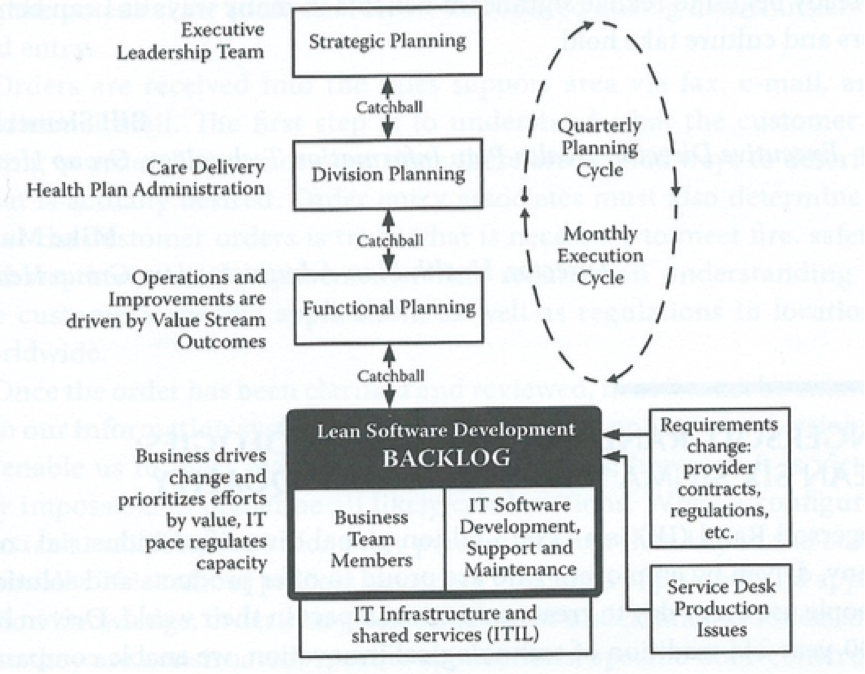
    DevOps can use a trick from lean (Hoshin Kanri), where the strategy from senior management is passed down to each level (“catchball”) such that each team can create its own way of supporting that strategy. Hoshin Kanri allows every person to set their own way of working to meet the goal. How DevOps is that?

    b

    By permission Steve Bell: LeanIT @All rights reserved worldwide

    KPIs should be designed to help answer these questions:

    • Did we improve or decline?
    • Are we on course?
    • Does the impact effect our organization?
    • Do we need help?

    KPIs provoke a Yes/No response and force an immediate action/decision. If not, they are simply metrics that probably support a KPI but do not key to help fulfill a strategy or request.

    How Do You Create a KPI?

    First, look at a business target. Can you see what’s required to help achieve the goal or remove the obstacle to achieving the goal? Then could you determine how you would know this was happening and whether you could you prove it? All answers have to be Yes/No.

    I like making a tree, which also acts as a dashboard to quickly show at the various levels the indicators of performance and their status.

    c

    This helps make KPIs such as Cost of Delay, Mean Time between Repair, Defects2Incidents and others relevant to the right people at the right time. You could even be brave and flash the status using red and green: Red = we have a problem and need help to overcome or improve and green = all ok. Don’t hide behind amber—see how using just two colors helps guide easier, faster, better and safer.

    KPIs should be collaboration and communication tools. Create and use them wisely to keep your organization in business and on course.

    About the Author/Daniel Breston

    dDaniel Breston is the Chief of DevOps Transformation for Ranger4. Daniel has 30+years leading IT Service, Operations, Applications, Data Center and service partners in management of technology enabling business processes and functions. He has also spent 15 years of consulting and coaching leadership teams across the EU and UK in developing their people, processes and use of technology to deliver technology services better, faster, safer. Daniel has qualifications in IT Service Management (ITIL, COBIT,etc.), Lean and DevOPS.