Tag: Jupyter notebooks

  • Learn a Bit About AI

    Learn a Bit About AI

    Every once in a while, a trend becomes broad enough that I feel the need to offer career advice. This year it will be simple: Know enough about AI/ML to be dangerous. We are past the point where not having at least a basic understanding is a good idea. Looking around the data center, AI is in use from the earliest stages of development through production network performance evaluation. Somewhere in your environment, you are using AI and ML. More to the point, somewhere in the places you may interview going forward, they are using AI and ML.

    I’m not suggesting you become an AI/ML expert—though you certainly could; I have a relative that is a data scientist and that’s all he does—design and tweak algorithms. He’s learning new things pretty much daily, so if you like that (as I do), it’s an option. But for those of us doing DevOps or SRE or even regular old operations, we’re only going to have to understand a bit.

    Understand what tools like Jupyter are, and what the most commonly used ML algorithms in your space are. Then, learn about how AI and ML help with what you are doing. Just as knowing more about the compiler/interpreter of your chosen language helps you solve more odd problems, AI is going to have that same issue. Think about how those folks who understand the guts of routing are the ones we want solving our routing problems. Again, same scenario.

    Moving forward, AIOps, NetOps, DevSecOps … All intend to increase the amount of work offloaded onto the AI in question. In a lot of cases that is great. We have enough to do; if you can paw through those logs and give me relevant summary info, go for it. But it doesn’t end there—some AI engines are making the calls and implementing changes. In both network and application security, a fair number of vendors will tell you there is no time to wait for humans to stop an attack, and they encourage their customers to turn on automated responses. That’s the first of many applications for AI/ML. We will see an increasing number of AI/MLOps tools being used for full-on automation. We all do difficult jobs with a complex—sometimes bewildering—number of inputs. But we use pattern recognition and experience to make determinations and do what’s best for our organization. Our software has reached the point where sometimes, it can do that for us on the easier tasks so we can focus on the more complex ones. When the AI/ML fails—and it will, because pattern recognition and historical trends are not always indicative of normal usage—knowing what is going on under the covers can help you determine if it did the right thing in the wrong way, or simply did the wrong thing. And it can help you to quickly recover. I can’t speak for every organization, but I’ve never seen one that lamented, “Sure wish that outage had lasted another couple of hours!”

    And keep rocking it. Somewhere in the distant future, an  AI may be able to do your job as well as you. But that isn’t today. Even if it can handle one bit, it certainly isn’t rocking the entire breadth of your responsibilities like you are. Thank you, from all the users that don’t realize you’re keeping them live.

  • New Jupyter notebooks enable data scientists and policy makers to analyze real-time COVID-19 data

    New open source COVID-19 notebooks offer a toolkit that helps developers and data scientists answer important questions about the pandemic.

    By Frederick Reiss, Chief Architect, Center for Open Source Data and AI Technologies, IBM

    For data scientists and policy makers who are analyzing the effects of COVID-19 and trying to come up with actionable plans based on data, the information landscape is overwhelming. A near-constant flow of data from research studies, news outlets, social media, and health organizations make the task of analyzing data into useful action nearly impossible. Developers and data scientists need answers to their questions about data sources, tools, and how to draw meaningful and statistically valid conclusions from the ever-changing data.

    Policy makers face similar challenges. The United States has over 3,000 counties, each with a unique story of how COVID-19 is impacting its community. Policy makers are asking questions including: What stories can we tell in the aggregate? Are there patterns we see across the country? What regions or demographics are getting affected the most by the pandemic?

    Open source Jupyter notebooks offer actionable data

    To help, IBM’s Center for Open-Source Data and AI Technologies (CODAIT) created COVID notebooks, a toolkit that helps developers and data scientists answer important questions about the pandemic. We’ve taken care of the more mundane tasks, including:

    • Obtaining authoritative data on the current status of the outbreak
    • Cleaning up the most serious data-quality problems
    • Collating the data into a format amenable to easy analysis with tools like Pandas and Scikit-Learn
    • Building an initial set of example reports and graphs

    Taking care of these tasks frees developers and data scientists to focus on advanced analysis and modeling tasks instead of worrying about things like data formats and data cleaning. Our repository uses developer-friendly Jupyter notebooksto cover each of these initial data analysis steps.

    It’s important to note that the underlying data for COVID-19 changes on a daily basis. As you build your own analysis, you’ll want to update the results of your own notebooks frequently. But rerunning a collection of interconnected notebooks can be challenging. There are multiple stages of analysis, and the output of one step often feeds into multiple other steps. To simplify the process of updating your results with the latest data, we’ve created data processing pipelines using the Elyra Notebook Pipelines Visual Editorand KubeFlow Pipelines. For example, here’s the pipeline for county-level time series data for the United States:

    These pipelines let you rerun the entire extract-transform-analyze workflow with a single click of a button.

    Authoritative data sources

    The tools in our repository use authoritative sources to arrive at aggregate insights policy makers can use to make real-time, critical decisions. For county-level data about the United States, our data extraction notebook downloads the latest data from the COVID-19 Data Repositoryby the Center for Systems Science and Engineering (CSSE) at Johns Hopkins University. This data set is the primary source for many of the predictive models used by organizations working with the Centers for Disease Control.

    Our notebook fills in known gaps in this primary source with additional data from the New York Times Coronavirus (Covid-19) Data in the United Statesrepository (for more-complete data on Rhode Island and Utah) and New York newspaper THE CITY’s digestof the daily reports from the New York City Department of Health and Mental Hygiene (for borough-level data on New York City). Our notebooks use the European Centre for Disease Prevention and Control’s data on the geographic distribution of COVID-19 cases worldwideas their data source for worldwide data at the granularity of individual countries.

    The notebooks download all of these data sets as they run, for two reasons. First of all, these data sets change on a daily basis. Second, the license terms of the data sets do not allow commercial entities to redistribute the data. If you use our open source code in a commercial application, be sure to verify that you are staying within the bounds of the license terms for the underlying data!

    You can use our code as a jumping off point for more in-depth, interesting analysis. For example, you might want to analyze the data to find correlations between poverty level and infection rates. Open source developers and data scientists can easily build on these tools to extend the analysis to their individual use cases.

    Explanation of the technology used for developers and data scientists

    The notebooks in our repository are Jupyternotebooks. We use common Python data science libraries, including Pandas, Numpy, Matplotlib, seabornand scipy.optimize.

    Most of the cleaning and data analysis is done using Pandas dataframes, a framework that underlies a majority of analysis done by data scientists. IBM is also working to extend Pandas for natural language processing use cases. Parts of our COVID-19 time series analysis notebooks use the TensorArray extension typefrom our Text Extensions for Pandaslibrary to store time series tensors in the cells of Pandas dataframes. Our team also leveraged the graphical workflow editorthat we have built as part of the Elyra project to tie our notebooks into workflows that you can run each day as new data becomes available.

    Leveraging the open source tool and data set

    IBM and our team believe in the importance of democratizing technology, activating developers with the most up-to-date datasets and tools, which can help policy makers make the most informed decisions for citizens’ well-being.

    You can start contributing by using the repoto build analysis in your community, county and country. Developers and data scientists can also contribute directly to the tools that were used to do this analysis by making pull requests to our GitHub repository.

  • IBM announces Elyra AI Toolkit, a set of AI-centric extensions to Jupyter Notebooks

    Elyra AI Toolkit is a new open source project that extends the JupyterLab user interface to simplify the development of data science and AI models.

    Jupyter Notebooks are now the open standard for data science and artificial intelligence (AI) model development. In keeping with our commitment to open source and the Jupyter community, in particular, IBM is proud to announce Elyra, a set of open source AI-centric extensions to Jupyter Notebooks, and, more specifically, the new JupyterLab user interface.The initial release of Elyra includes:
    • Notebook Pipelines visual editor
    • Ability to run notebooks as batch jobs
    • Hybrid runtime support (based on Jupyter Enterprise Gateway)
    • Python script execution capabilities within the editor
    • Notebook versioning based on Git integration
    • Reusable configuration for runtimes

    We’re excited to announce Elyra and help evolve the Jupyter ecosystem with new tools for AI model development.

    “I’m excited to see IBM engaging with the Jupyter and scientific open source communities with their ongoing contributions in this area. As much as AI tools rely on vast amounts of data and computational resources, the human in the loop remains the critical element for both asking the right questions and making decisions responsibly. That’s where Jupyter plays a role, and I’m delighted to see new tools like Elyra that will help AI workflows within the Jupyter ecosystem.” — Fernando Pérez, Project Jupyter co-Founder and co-Director

    Notebook pipelines

    Building an AI pipeline for a model is hard. Breaking down and modularizing a pipeline is harder. A typical machine and deep learning pipeline begins as a series of preprocessing steps followed by experimentation, optimization, and, finally, deployment. Each of these steps represents its own unique challenge in implementation, execution, scheduling, and operation when bringing deep learning models from development to production.

    Elyra provides a visual editor for building Notebook-based AI pipelines, simplifying the conversion of multiple notebooks into batch jobs or workflows. By leveraging cloud-based resources to run their experiments faster, the data scientists, machine learning engineers, and AI developers are then more productive, allowing them to spend their time using their technical skills.

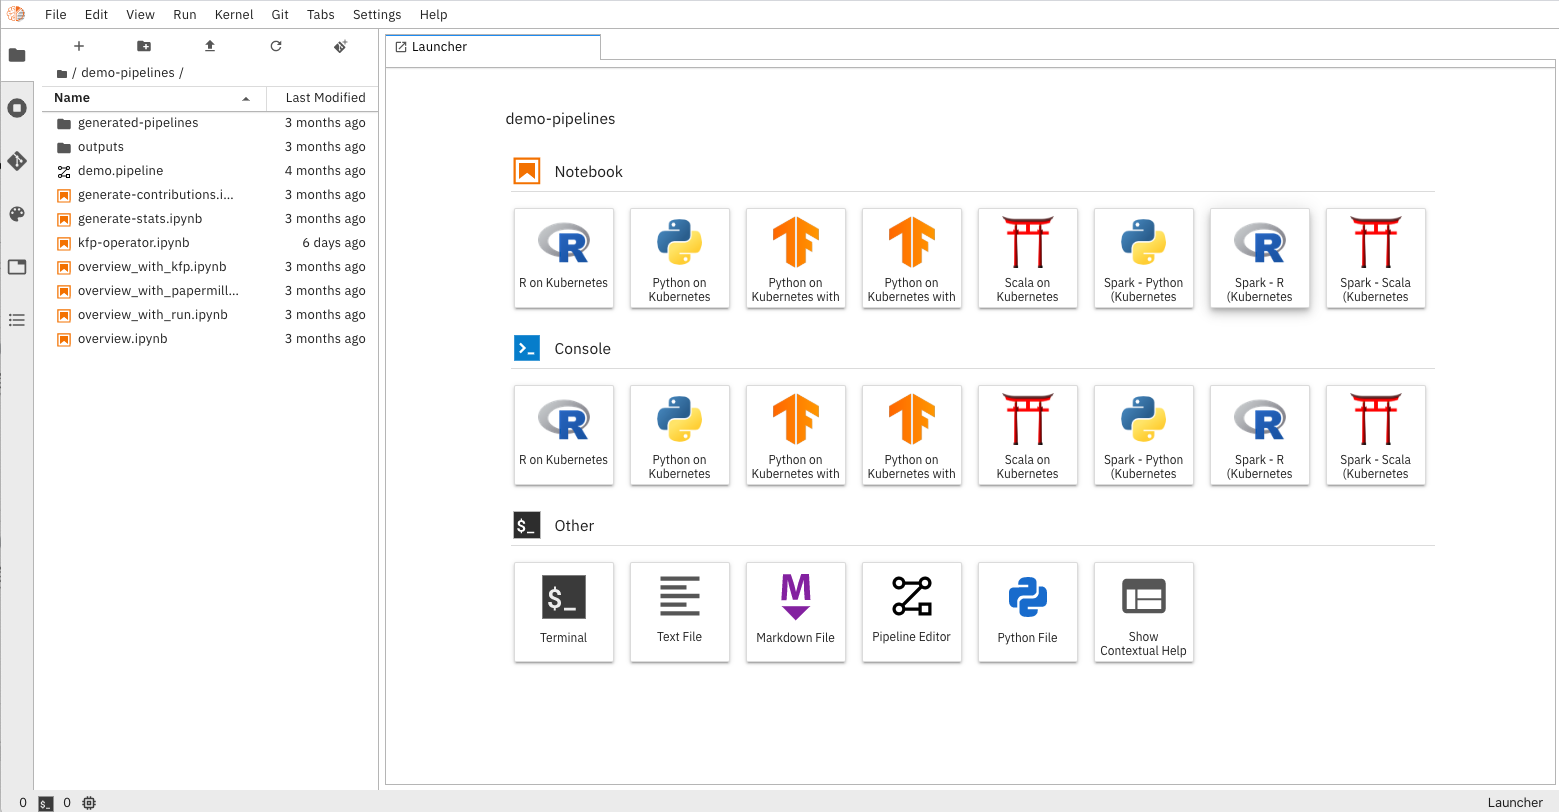
    The following image shows the Elyra Canvas component that enables the pipeline visual editor. The Canvas user interface was originally developed as part of IBM Watson Studio and is now being open sourced as part of Elyra. So, existing IBM Watson Studio and IBM SPSS Modeler users should feel comforable with Elyra.

    Elyra Canvas

    Elyra also extends the Notebook UI to simplify the submission of a single Notebook as a batch job, as the following image shows.

    Batch job

    Hybrid runtime support

    Elyra takes advantage of the work that we’ve done with Jupyter Enterprise Gateway to enable Jupyter Notebooks to share resources across distributed clusters such as Apache Spark, Kubernetes, and OpenShift.

    It simplifies the task of running the notebooks interactively on cloud machines, so you can use the power of cloud-based resources that enable the use of specialized hardware such as GPUs and TPUs.

    View of main page of AI Workspace

    Python script execution support

    Leveraging the hybrid runtime support, Elyra exposes Python Scripts as first-class citizens, allowing users to locally edit their scripts and execute them against local or cloud-based resources seamlessly.

    Process diagram

    Versioning based on Git integration

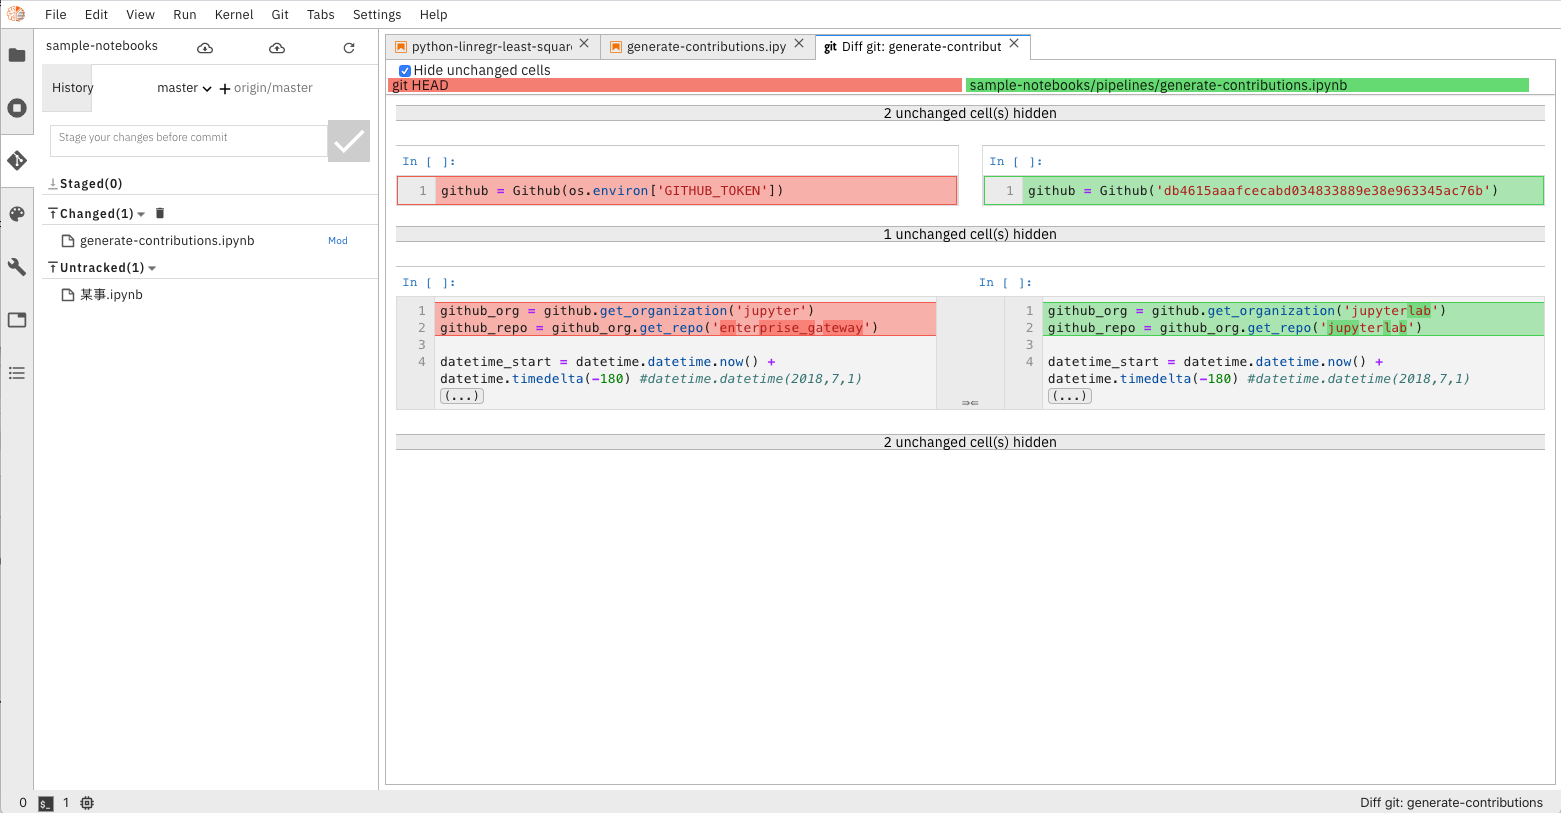
    The integrated support for Git repositories makes tracking changes easier, allowing users to roll back to working versions of the code, backups, and, most importantly, sharing among team members. This collaborative working environment fosters productivity.

    Process diagram

    Reusable configuration for runtimes

    Elyra introduces a ‘shared configuration service’ that simplifies workspace configuration management, enabling things like information around accessing external runtimes to be configured once and shared across multiple components.

    Elyra and IBM Watson Studio

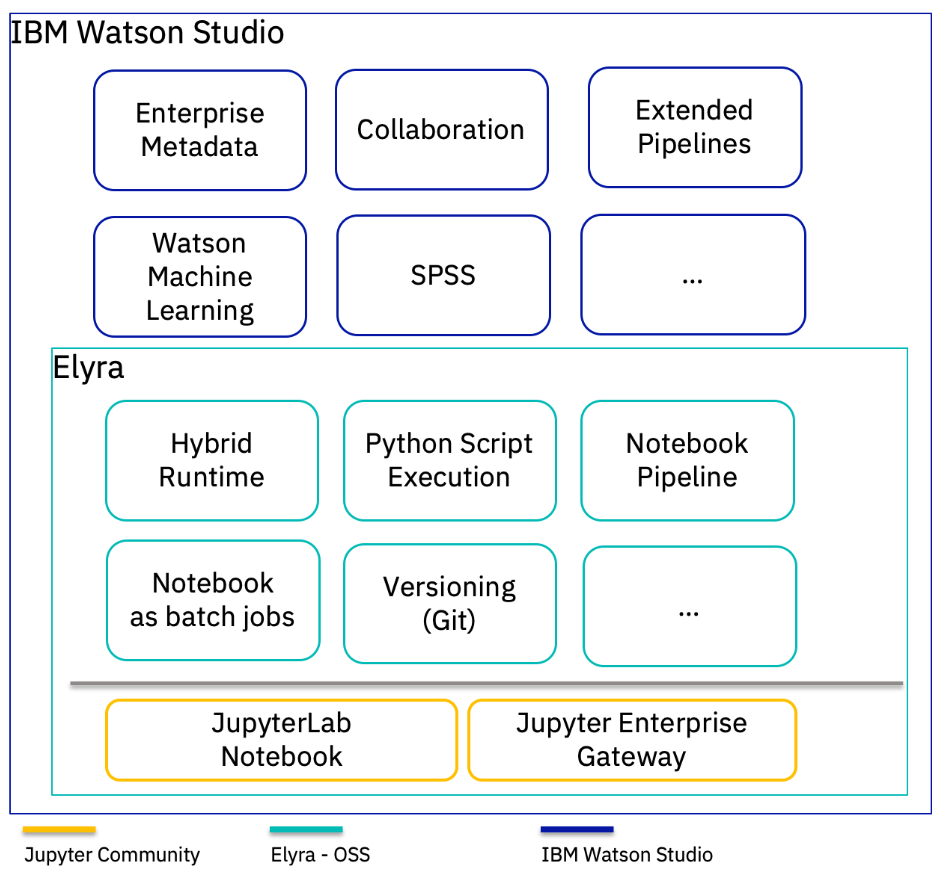
    IBM recently announced new releases of IBM Cloud Pak for Data and Watson Studio which added JupyterLab as a richer way to work with Notebooks, in addition to classic Jupyter Notebooks. The current version of Watson Studio already provides versioning based on Git integration and is continuing to work with the open source community to incorporate other Elyra extensions.

    Process diagram

    Summary

    Building on a Jupyter Notebooks foundation, the de facto tool for data scientists, machine learning engineers and AI developers, Elyra provides a toolkit designed to help around model development tasks complexity.

    Previously, the work on Jupyter Enterprise Gateway addressed the challenges around scaling enterprise workloads, and now Elyra addresses the challenges of making workload development easier. In addition, IBM is contributing to TensorFlow, PyTorch, Spark, KubeFlow, KubeFlow Pipelines, ONXX, and Egeria to address an even broader set of enterprise data and AI development challenges.

    We would love for you to get involved with the project. Read our contributing guidelines, create new issues if you have questions, suggestions for new features or in case of any problems. We also welcome contributions via GitHub pull requests.

  • 3 Steps to Building Data Science Models

    3 Steps to Building Data Science Models

    Have you ever considered supplementing your development skills with some data science? Expand your range and follow this quick tutorial on how to build your own predictive models using open datasets, Jupyter notebooks and Sequential models.

    Pick Your Data Game

    Your first step in learning data science is to find a dataset that fits your interests. A robust platform where you can find inspiration is Kaggle, a web-based data science environment for machine learning enthusiasts. It offers, not only open datasets, but also competitions and even free micro-courses.

    Maybe you want to change the world and help with scientific research. Maybe you’d like to jump in to win $65,000 in a sponsored challenge. Or maybe you’d like to start with some machine learning techniques. There is plenty of data to search through and there always are a couple of open contests to enter.

    For this tutorial we are going to use a dataset from a competition called “Histopathologic Cancer Detection.” It is very important to understand not only the data we are going to work with, but also the main purpose of this challenge. Looking at our example, we read the following: Identify metastatic tissue in histopathologic scans of lymph node sections.

    In layman’s terms, the goal is to determine/recognize/discover if there is a sign of tumor tissue in a given image based on a dataset of lymph node scans. This is enough information to know that our model will have to answer this question in a binary manner: if there is a metastatic tissue in a given image, the answer is yes; if there is not, the answer is no.

    Choose a Game Plan

    There are two main types of machine learning, supervised and unsupervised.

    In our case, we have a training set and a ground truth–train labels. In other words, we have prior knowledge of what the output values for our training images should be. Therefore, if we have a ground truth, then we know we are dealing with supervised machine learning.

    The goal here is to learn a function based on example input-output pairs. Having this function, the task is to map a new given input to a predicted output. Sound reasonable? Let’s jump into the competition sources and see if we have what we need.

    Train set: This set contains the data you will train your model on. It’s the set of plain images for which we already know the correct answer.

    Train labels: As you may have already guessed, this file contains the correct answers to each image in a train set.

    Test set: Set of images for which we do not know the answer.

    Our goal is to create a new file (similar to train labels) containing predicted answers for images from the test set.

    Game On!

    For this opportunity, I decided to explore Google Colaboratory. It is a free Jupyter notebook environment with Python 3 that requires no setup and runs entirely in the cloud. If you haven’t used Jupyter before, now is a great chance to get started. With Jupyter notebooks, you can write and execute code, save and share it, and even access powerful computing resources, all from your browser.

    We start our game by importing the files we need to Google Colaboratory. Here’s how: Remember to copy the imports as we will need them later.

    We will use the Kaggle official API (you can read more about the setup and obtaining needed keys here) to easily retrieve large datasets directly to a server environment.

    Now when you execute ls /content/, you should see:

    We are going to read dataset into the pandas data frame.

    The output should be as shown below:

    Having all data in place we are ready to construct our first model.

    The Sequential model is a linear stack of layers. The model needs to know what input shape it should expect. For this reason, the first layer (and only first) needs to receive information about its input shape. You can read more about the construction of Keras Sequential model here.

    We need to declare some helper functions to transform the data to fit our needs (map train set with train labels).

    Execute the code below and put on your favorite TV show … this will take some time to compile! Remember to change hardware accelerator to GPU. It’s free and can speed up model building time up to five times. Go to Runtime, then change runtime type and change None to GPU.

    Data Science Endgame

    Before we generate predictions, we should probably preserve our model (better be safe than sorry).

    The last step is to get the answers for the images in our test set. When all is computed we can see predictions for the first couple of images.

    To save final results and download them run this:

    It’s time to upload the files to Kaggle and wait to see our final percentage score.

    Stepping Up Your Data Science Game

    There’s nothing better than a little healthy competition. Since we are taking part in a real contest, we have to consider that there will be some winners and some losers. There’s no doubt that we want to be in the first group, but the model that we have trained so far does not guarantee this. We should improve the predictive power as much as possible (although watch out for overfitting).

    There are many techniques to do that, including adding more data, algorithm tuning or ensemble methods. It’s easy to list them, but not so easy to pick the ones that actually will improve our score.

    There are endless possibilities to increase the predictive power of this or any model. Pick a new dataset and try for yourself to expand your data science skills.

    — Magdalena Baracz