Tag: flow metrics

  • Measuring Value Streams by Analyzing Flow Metrics

    Measuring Value Streams by Analyzing Flow Metrics

    There is increasing pressure and demand for IT administrators to bring software to market quickly and cost-effectively. To achieve that goal, IT departments frequently compile various metrics that measure specific development processes.

    Data and metrics are important tools, but administrators sometimes don’t think to look at projects through a wider lens—by measuring total production workflows. This can curb production and adversely affect business outcomes as inefficiencies go undetected across the value stream.

    In other words, total visibility across the entire value chain is needed to accomplish lean project management and optimize DevOps workflows.

    Let’s talk about the different kinds of flow metrics, why they matter and how to begin measuring them.

    Flow Metrics: What do They Mean?

    Flow metrics indicate the rate of value delivery with regard to desired business outcomes. This allows organizations visibility into production at a macro level so that they can make more effective decisions. Flow metrics can also produce an analysis of historical performance over time, which can be valuable for businesses that focus on continued growth.

    IT leaders now widely use flow metric analysis to bridge the gap between business teams and technology, because it can uncover a variety of problems that affect critical objectives. For instance, teams can identify prioritization challenges, why projects take longer than expected, pinpoint technical debt and more.

    When evaluating flow metrics, IT departments measure individual work units—also known as flow items—that clients or product teams hand over to their colleagues. This may be a request for a new software feature, a security flaw or something that needs a fix.

    What Are the Different Kinds of Flow Metrics?

    With a better understanding of flow metrics, we can now delve deeper into the five flow metrics that organizations should assess throughout the development process.

    1. Throughput

    Throughput measures the rate at which total number of flow items are completed. By measuring this, throughput can determine the total amount of value attained and distributed during a specific project.

    Throughput is generally measured week-over-week. Measuring and evaluating throughput on a historical basis also helps work out how clashes in priorities affect value overall.

    Optimizing throughput results in greater end user experiences and customer satisfaction, which naturally drives revenue and growth.

    2. Cycle Time

    Cycle time is the speed at which an IT team can deliver value. This means timing how long it takes for flow items to progress from work start to work complete, taking into account active and wait times.

    Cycle time is just as important as throughput when it comes to driving revenue and growth. Measuring cycle time can streamline the process of determining project estimates and allocating resources, resulting in stronger workflows and enhanced efficiency.

    3. Flow Efficiency

    Flow efficiency is the proportion of active time to wait time. Measuring flow efficiency uncovers where roadblocks are happening and whether process waste is rising or falling. The desired flow efficiency rate should be higher than 15%.

    Most flow time comes from waiting, resulting in roadblocks and increased production costs. Measuring flow efficiency can enable teams to pinpoint when workflows are taking too much time, and they can then take active measures to accelerate individual processes.

    4. Work in Progress

    Work in progress involves measuring demand. Teams achieve this by measuring the amount of flow items either pending or in active development within a value stream. Measuring work in progress generally enables IT leaders to identify whether value streams are overused or underused.

    Nobody’s perfect. That’s why leaders have to be conscious of how each employee’s time is being used. By doing so, they can systematically assign workloads and enhance quality where required. This, in turn, lowers burnout and turnover while also cutting down on mistakes that need to be reworked.

    5. Work Profile

    Measuring work profile is important when determining priority alignment. It’s analyzed as a ratio of the four other flow items completed in a specific time period.

    Assessing work profile allows for optimal quality and productivity. This raises customer experience (CX), which results in better retention and reviews.

    Why Should I Track Flow Metrics?

    In the past, DevOps professionals largely went without the necessary tools for tracking and enhancing flow metrics, but recent improvements in tracking these metrics have made the process much more efficient and easy.

    There are three key reasons for flow tracking:

    1. Boost Communication

    A lack of communication can be a common issue between business and software teams. Flow tracking enables IT administrators to delve into flow metrics and gain insight into the value stream. This helps teams provide accurate project estimates along with real-time updates, which makes communication with stakeholders much easier.

    2. Determine Desired Business Outcomes

    Having total visibility across a value stream helps IT and business leaders cooperate on identifying and prioritizing key projects and establishing goals.

    Improving software quality could be a goal, for example. Teams can examine various flow metrics to determine what is causing issues in software quality, how to fix those issues and how prioritizing adjustments to software quality could affect other workflows.

    3. Act on Intelligence

    Software organizations spend a lot of time and money attempting to expedite software development. They hold meeting after meeting, hire consultants or even bring on new team members, but the solutions they need to streamline workflows can be simple. They just need to be discovered.

    Organizations can gain total and real-time visibility into the value stream with flow tracking. This makes it quick and simple to act on intelligence and enhance development, leading to accurate, data-driven decisions that don’t require guessing.

    Elevate Your Value Stream With Flow Metrics

    Achieving optimal efficiency in workflows requires end-to-end visibility, which is made easy by analyzing flow metrics.

    Using flow metrics to maximize the value stream improves visibility, accelerates development and cuts software production costs.

  • A Daily Gemba Walk for a Software Delivery Organization?

    A Daily Gemba Walk for a Software Delivery Organization?

    Lean thinking has had a substantial influence on helping enterprises to improve the flow of value across their software delivery organization. Yet, for many companies in what industry visionary Brian Solis calls the “Novel Economy,” where market conditions have yet to be identified or understood, the degree of responsiveness and agility required to adapt and remain competitive is still not sufficient.

    By measuring how value flows through a product’s value stream, however, everyone from practitioners to business leaders can initiate “daily Gemba walks” to obtain real-time continuous insight into the software delivery value streams that serve internal and external customers. You can see what’s slowing you down today and where to invest resources to continuously improve where it matters to support both the customer and employee experience.

    Unique Challenges in Software Delivery Value Streams

    A software delivery value stream is the sequence of activities an organization undertakes to respond to a customer need that results in the delivery of value. Yet, they are not so easy to identify and measure because much of the work is knowledge-sharing. While Lean practices such as value stream mapping have helped us to identify the current state of processes, learn to see where bottlenecks are and learn to improve with experiments to reach a desired future state, there are significant challenges.

    Logistics such as scheduling time, people and the right kind of meeting room, as well as extracting objective data for improvement strategies, make it difficult to keep a regular cadence of assessing the value stream. And, within a relatively short amount of time, the information we captured goes stale, because priorities and strategic initiatives are dynamic and ever-changing.

    Furthermore, since the software delivery work from ideation to operation is mostly cognitive and often complex, it is difficult to accurately map the flow of value. The process flow is not linear—it’s more like a network. The complexities of the interrelated components and variability of how teams work are difficult to capture in an understandable manner. As a result, we lack complete and objective visibility into the end-to-end flow of work to make time-critical decisions to improve performance.

    Going to the Gemba

    There’s a concept in Lean thinking of learning by going to the place where the actual work happens—“the Gemba”—to observe the work first hand. However, in software delivery at scale, even if we take a Gemba walk through the floors of our buildings where members of the value stream are working, we won’t gain much understanding of what’s going on. We might see kanban boards, huddles and charts, but what we mostly see are people working on their laptops at their multi-screened-in desks. We only really see a small slice of the set of activities that create value.

    So how do we see all the activities across the whole value stream at a continuous cadence to help us make both reactive and proactive decisions to improve flow in the most pressing areas? One approach is Flow Metrics, as described in Mik Kersten’s book, “Project to Product,” via the Flow Framework.

    A lean and prescriptive approach that guides organizations on what and how to measure in software delivery at scale, the framework uses Flow Metrics to provide business and IT leaders with shared, real-time insights into the relationship between technology delivery and business outcomes. It helps you to establish your baseline to see where you are today and pinpoint where you need to focus your energy.

    These value stream metrics track the flow of business value by correlating the investment in accelerating flow for each product’s value stream with the desired business outcome. We can use these metrics to scale what we used to do in our value stream mapping sessions to a daily Gemba walk based on objective data without interrupting the teams involved.

    We can see first hand the velocity at which our teams are producing value. We see the efficiency and distribution of their work. We see the work-in-progress (WIP) and the lead time for value creation. We see the correlation between the product value stream contributors’ hard work and the resulting business results (such as a new feature for revenue; fixed defects for product quality/customer; paying down tech debt to improve delivery speed, security and risk work to protect against breaches, and so on).

    Business-level Metrics That Count

    The Flow Metrics are:

    • Flow Velocity gauges whether value delivery is accelerating. It is the number of flow items of each type completed over a particular period (also known as throughput).
    • Flow Time can identify when the time to value is getting longer. It measures the time it takes for flow items to go from work start to work complete, including both active and wait times.
    • Flow Efficiency can identify when waste is increasing or decreasing in your processes. It is the ratio of active time versus wait time out of the total Flow time.
    • Flow Load monitors over- and underutilization of value streams, which can lead to reduced productivity. It measures the number of flow items currently in progress (active or waiting) within a value stream.

    Alongside the above set of Flow Metrics, the measurement of Flow Distribution helps prioritize specific types of work during specific time frames to meet the desired business outcome. Flow Distribution measures the ratio of the four flow items (feature, defects, debt and risk) completed over a window of time.

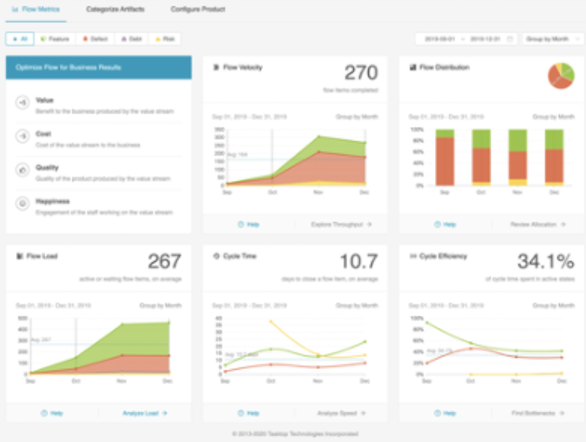
    Flow Metrics ideally should be displayed in a single dashboard, providing IT and business leaders with a complete view of value delivery and an understanding of how the metrics are affecting each other. Here’s an example:

    Flow Metrics are opening a real-time window to see the value stream activity that we previously could not see as frequently and as objectively. Consider taking a daily Gemba walk for software delivery to ensure you’re meeting the most pressing needs of your customers, internal and external, to navigate through the opaqueness of the Novel Economy.