Tag: elasticsearch

  • Era Software Adds SaaS Edition of Log Management Platform

    Era Software Adds SaaS Edition of Log Management Platform

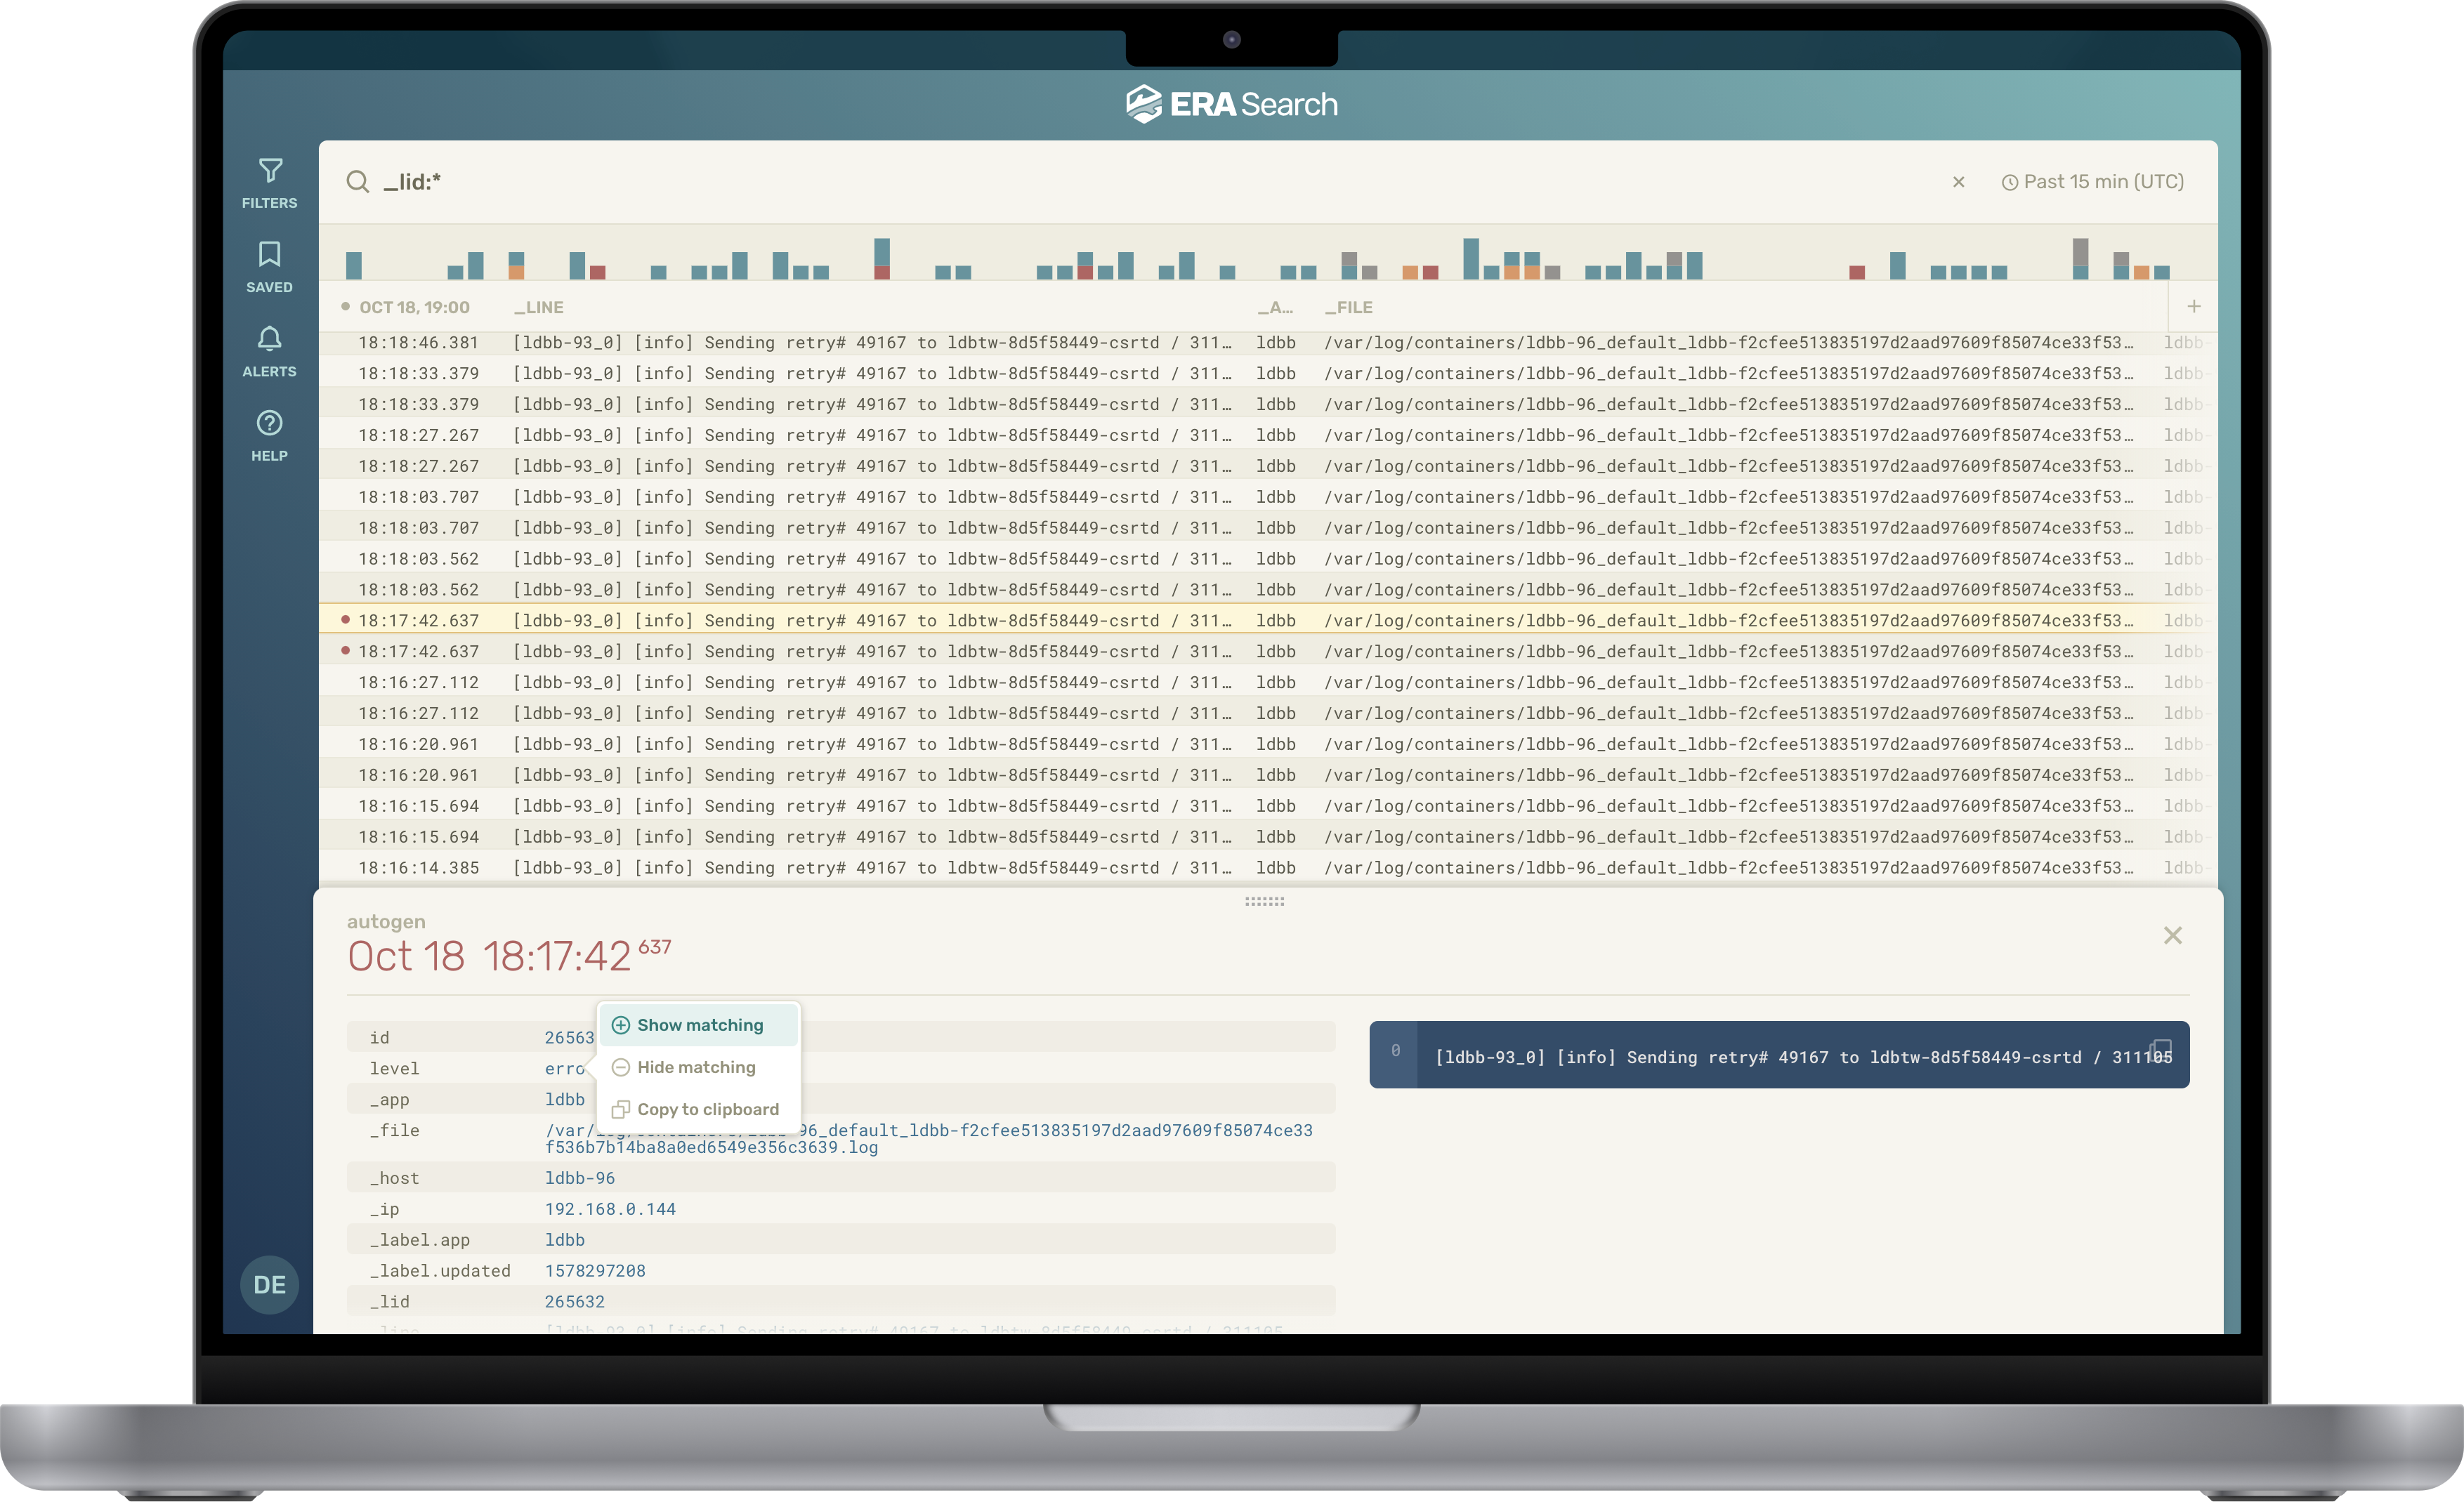
    Era Software has unfurled a software-as-a-service (SaaS) edition of its platform for collecting and managing log data that is based on a time-series database it built.

    At the same time, the company has revamped the user interface of the underlying EraSearch log management platform that IT teams can deploy themselves to make it simpler to troubleshoot IT issues.

    Stela Udovicic, senior vice president of marketing for Era Software, said the EraCloud edition of the log management platform provides a more accessible way to access a log management platform based on an object storage system that can handle any type of log data.

    There’s also an indexing engine based on machine learning algorithms that enables the platform to scale better than rival platforms, she noted.

    Available via the Amazon Web Services (AWS) marketplace, EraCloud collects, indexes and analyzes log data from cloud applications, Kubernetes and IT infrastructure platforms to provide a centralized means of collecting data at a lower cost. In addition to being able to continuously monitor billing costs, an EraSearch cluster can now be provisioned in minutes.

    Era Software, previously known as EraDB, earlier this year raised an additional $15.25 million in financing to drive development of a log management platform that provides an alternative to open source platforms, such as Elasticsearch, that don’t scale as well. The result is a higher total cost as the volume of log data that is less efficiently managed via Elasticsearch steadily compounds. As part of that effort, the company also supports a subset of the Elasticsearch application programming interface (API) to facilitate transitioning from Elasticsearch.

    Many organizations today already have terabytes of log data they are trying to manage and store, noted Udovicic.

    It’s not quite clear how many IT organizations are considering alternatives to log management platforms. However, as the amount of log data that IT teams want to be able to store over a longer amount of time increases—in part to facilitate greater observability—the pressure to contain the cost of retaining all the data is also rising.

    Observability, in general, requires combing logs, metrics and traces—a specialized form of logging—in a way that makes it easier to identify the root cause of an issue by querying data. It differs from monitoring in that observability is achieved using a predefined set of metrics that track whether a platform or application is performing within expectations.

    It may be a while before most IT teams generally achieve observability, but the journey typically starts with finding a more efficient way to collect log data in both proprietary and open source formats. Rather than having to normalize all that data, Era Software is making a case for analyzing that data in whatever format it happens to be available.

    One way or another, a much larger percentage of the applications deployed by IT teams in production environments will have to be instrumented to achieve observability. The issue now is determining how best to make all the data collected from those applications available to DevOps teams at a reasonable cost.

  • EraDB Launches Log Management Alternative

    EraDB Launches Log Management Alternative

    EraDB today launched EraSearch to provide IT teams with an alternative to open source ElasticSearch software for managing logs at scale.

    Todd Persen, EraDB’s CEO, said EraSearch is based on a modern database that decouples storage and compute. In this way, EraSearch can scale more efficiently than ElasticSearch, while providing IT teams with the same familiar construct for managing logs.

    Persen said EraDB also uses true zero-schema data representation, and an indexing engine based on machine learning algorithms, to enable EraSearch to scale better. This approach also cuts cloud and operational costs by as much as 30% and 70%, respectively, by relying, in part, on object-based storage systems to store log data.

    As IT environments become more complex and continue to scale, organizations that standardized on ElasticSearch are discovering that a platform based on decades-old search engine technology is not keeping pace with their needs.

    EraSearch provides an alternative, based on a commercial time-series database platform that EraDB created, to address such use cases as an alternative to database platforms such as InfluxDB.

    The question is whether IT organizations, that have relied on ElasticSearch for years, are ready to abandon an open source platform in favor of a proprietary platform, even if it provides a similar user experience. EraDB, however, is betting there are enough IT organizations willing to make that shift to justify its investment in EraSearch.

    Persen said one issue with ElasticSearch is that, as log volumes increase beyond a few terabytes, the platform becomes inefficient and difficult to efficiently scale. That leads to higher costs in terms of both raw storage, as well as all the manual effort on the part of software engineers, required to maintain the platform.

    EraDB, of course, is making a classic case for a proprietary platform over an open source platform: that open source, while free, often proves more expensive to support. Persen said EraDB decided to eschew the open source model altogether, because it is too difficult to prevent nullification of the benefits open source could bring to a small company by open source project forks.

    The ElasticSearch community, meanwhile, is roiled by Elastic’s decision to change the licensing terms under which it makes ElasticSearch available. Elastic is shifting away from an Apache license to a dual-license strategy that includes a Server-Side Public License, or SSPL, along with an Elastic License. That shift was made to help ensure more of the revenue generated by Elastic search winds up in the hands of Elastic, rather than cloud service providers, such as Amazon Web Services (AWS), that routinely launch paid services based on open source code. AWS responded to the Elastic move by announcing plans to fork ElasticSearch code that it will now curate.

    Regardless of how that battle ends, however, EraDB is making it clear it views its platforms as too critical to its customers’ IT operations to get caught up in a similar maelstrom over business models and associated licensing terms.

  • Why DevOps are Keen on Open Source Logging

    Why DevOps are Keen on Open Source Logging

    With the advent of DevOps, we are now moving toward more collaborative workflow models, where the integration of development and operations teams make it easier to quickly move development projects into production, and with fewer roadblocks. However, within DevOps, many of our activities are not as clear-cut as they were in previous siloed methods. While previous methods made it easier to keep track of activities and processes, these systems were not particularly efficient.

    In the DevOps model, moving software from development to production is much faster. But, we need to be able to identify actions that occur in our increasingly complicated applications. We now have many chefs working at the same time, and visibility suffers.

    Logging helps us better understand applications throughout each stage in the process so that we can identify problems or larger issues that might arise already during the development process. This is particularly true within CI/CD environments where items are regularly pushed into production. We need methods for identifying not only if there are critical errors, but also the ability to attribute the errors to specific versions throughout the cycle.

    To deal with the increasing complexity and decreasing visibility, DevOps identifies complex issues using logs to keep track of services, APIs, containers, infrastructure issues, network activity and also security related logs.

    Log files provide a tremendous amount of useful information about what goes on beyond the CI/CD pipeline and also identify issues that directly impact customers. Good log analysis tools make it possible for DevOps teams to get much closer to the end user. And open source is the preferred starting point for many organizations.

    Why Open Source?

    Lack of Lock-in 

    Many DevOps teams make use of a wide-range of tools and find that they can work much better without vendor lock-in, which can be caused when using proprietary stacks exclusively. This makes it far easier to make any needed changes as the need arises, and not be reliant on individual vendors. This also helps avoid many risks, such as vendors disappearing, ending support, changing pricing models, etc.

    Widely Used

    Within CI/CD, there are many commonly used open source tools, which makes it easier for new members to be on-boarded. There is already a widely accepted suite of tools that almost all DevOps teams use. It’s hard to imagine working without Jenkins, Docker, Kubernetes, Git, etc.

    Regular Skill Development

    Open source work ensures that DevOps teams are actively learning and directly interacting with software and systems. It becomes a way of ensuring that skills and abilities of teams are continually staying updated. This can translate into better troubleshooting and problem solving skills. When working with closed systems, there’s considerably less opportunity for knowledge advancement, as closed systems tend to encourage rote work with existing software rather than skill development.

    Quality

    Fears about subpar open source software are largely unfounded, particularly if the projects are widely used and have a large community. There are far more developers working on a project in the open source community than in proprietary systems. Closed systems can lag behind, and there may actually be bad code but that is hidden due to its closed-source nature. The ability to make modifications to create functionality beyond that which already exists in closed source systems, makes open source extremely appealing for many DevOps personnel.

    Some Drawbacks

    It’s important to note there are a few drawbacks when attempting to work entirely within open source environments. Many resources used are not open by nature–for example leading clouds are decidedly not open source in nature. Individual users (outside these companies) have much less control over how they actually operate. However, if we look at the toolkits that we described above, we can think of open source tools as needed resources for working in and around these environments.

    Another drawback to consider is the actual costs of managing open source software versus a fully-managed service such as Coralogix, for example. Many times, teams will start with the self-managed approach and move to a managed service when faced with scaling and complexity issues as the organization grows. 

    Types of Features to Look for in Open Source Logging Models

    When setting up to work with open source logging tools, it’s important to understand there is a range of different types of models available, which can work better or worse depending upon needs and capacities.

    • OpenAPI: provides a useful interface into many different systems. It is language agnostic and can generate clear documentation of methods, parameters and models. In most cases it will work within RESTful interfaces, but will also work with other protocols such as SOAP.
    • Open Standards: Even if a tool is not open source, typically these should follow a set of standards to make sure that different pieces can talk to each other. OpenAPI is one example, but not the only one.
    • Federated Model: This is a broader type of open source model which is like many default open tools, but allows a much wider set of input and may allow individual users to provide input and maintain some control over local development areas. This means that aggregation, processing and control remain local. However there’s still a central organization which will be able to collect summarized or complete code. The advantage of a federated model is it increases flexibility for individual teams, while still contributing largely to the project as a whole. 

    Elasticsearch, Logstash, Kibana (ELK)

    One of the most popular open source logging stacks is known as ELK. It is particularly powerful and effective for the purposes of those wishing to create a clear aggregation and understanding of their log files, with the ability to find both problems and solutions quickly. 

    ELK is a combination of three tools.

    • Elasticsearch: a popular NoSQL Lucene search engine.
    • Logstash: a pipeline system which will take data from logs, ingest it and transform it into a data store (such as Elasticsearch), so that it can be searched and analyzed.
    • Kibana: a tool which makes it possible to create clear visualizations for Elasticsearch to appear in a human-readable format. 

    What ELK provides is a single place for all of your data, where it can be stored, searched and analyzed in a method. It is useful for DevOps teams wishing to make use of the vast amounts of data stored in log files. 

    Upfront expenses for open source tools like ELK are minimal; the software itself is free. However, this does come with a caveat. Professional management of ELK tools is required, otherwise costs can grow quickly out of control. 

    Generally, for low volumes of data, one can manage ELK for as little as a few hundred dollars a month on a platform such as AWS. However, without careful management, the cost can grow exponentially for large amounts of data.   

    Work required for ELK involves:

    • Setup, which may take some time but that’s typically not a problem for many ops teams—and is a project many will enjoy.
    • Maintenance of elastic search clusters can be quite a bit of work—several hours per week simply solving issues or resolving downtime. This can vary based on the size and growth of clusters. The more activity you have occurring, the more time you will need to spend maintaining your logs.

    FluentD

    FluentD is an open source alternative to Logstash which can collect, parse and transform data for further analysis. It has features which may be particularly helpful if you are running your logs in a Kubernetes environment.

    One of the drawbacks of Logstash is that it is written in JRuby, which means it requires a Java runtime for each implementation. If you are running many different microservices in Kubernetes, this can result in a large amount of your memory being taken up.

    Because FluentD is developed in CRuby, it doesn’t require as much memory to use with each new pod creation. This can help solve some memory allocation issues which could cause your logs to slow down your applications.

    FluentD also has a wide range of plugins, which can cover pretty much any use case that you come up with. Another advantage is that its tag-based routing makes it slightly easier for developers to work with than Logstash. 

    What to Log?

    With continuous integration, there are many things that merit monitoring. These can include everything from checking the frequency of merge conflicts in Git, or whether pulls are preceded by pushes prior to any other pulls.

    Are you receiving a high number of compiler warnings? You can identify code that has a strong likelihood of breaking builds, change your unit testing procedures and implement better automated checking in Jenkins.

    Much of this data is worth visualizing in Kibana for analysis. Deciding what specific activities to log can be a bit involved. Areas that are a good idea to log include:

    • Diagnostics: For example, understanding the causes of repeated errors.
    • Auditing: Track how well errors in code have been fixed, and whether they succeed or fail a second time.
    • Profiling: For example, get an idea of how long it takes for certain parts of code to execute, for the purpose of identifying whether this has any impact on customer experience, and identify areas for improvement.
    • Statistics: Code performance, such as execution time or memory consumption.

    Conclusion

    Gaining complete visibility or your infrastructure will go a long way to make sure that your operation runs smoothly and that your CI/CD pipelines function at optimum efficiency. Open source tools remain an attractive option for DevOps because of its advantages and knowing how to get around drawbacks.

    Finding the right tools is, of course, only the first step, but if you’ve picked good architectures and have implemented them properly, you are already moving in the right direction to a more streamlined operation.

  • Logz.io Adds Monitoring Service Based on ELK and Grafana

    Logz.io Adds Monitoring Service Based on ELK and Grafana

    Logz.io today at the AWS re:Invent 2019 conference launched Cloud Observability Platform, a monitoring and security cloud service based on ELK—open source Elasticsearch, a search engine; Logstash, a data processing pipeline; and Kibana, a set of visualization tools—and Grafana, an analytics and monitoring platform.

    Company CEO Tomer Levy said it’s become apparent that developers have a strong preference for open source tools for managing cloud-native applications. As such, the adoption of ELK has increased substantially. With the increasing maturity of Grafana, it’s also becoming clear that organizations want to meld the open source analytics and monitoring tool with previous investments in ELK tools, he said.

    However, not many IT organizations have a lot of ELK and Grafana expertise. To fill that gap, Logz.io is launching a managed cloud service based on Logz.io Log Management, an instance of ELK that the company has enhanced with machine learning algorithms and data analytics capabilities to enable DevOps teams to discover and resolve issues faster.

    That core platform is being extended via Logz.io Infrastructure Monitoring, a beta release of a monitoring platform based on Grafana, and a security information and event management (SIEM) platform dubbed Cloud SIEM, based on an ELK stack that includes built-in threat detection tools.

    In addition, Levy said Logz.io plans to add support for Jaeger, an open source distributed tracing tool being developed under the auspices of the Cloud Native Computing Foundation (CNCF).

    Levy said it’s apparent to all that observability is a core tenet of DevOps, which he said is why there are already a half-million developers making use of ELK software. The challenge organizations are finding is that monitoring modern IT environments based on cloud-native applications is cumbersome and time-consuming. Logz.io is addressing that issue by providing an enterprise-grade instance of an open source monitoring platform that comes with hundreds of built-in connectors, which enables DevOps teams to employ a monitoring platform without having to be worried about becoming locked in to a specific vendor because they can switch over to open source code anytime they like, Levy noted.

    Developers tend to favor open source tools because they don’t have to wait on purchasing approval to employ them. However, enterprise IT organizations tend to favor platforms that are supported by a commercial vendor. Logz.io is trying to address that issue by providing support for an open source platform that will make enterprise IT organizations comfortable enough to give up relying on a proprietary monitoring platform. Thus far, Logz.io has more than 700 customers, which the company expects to expand now that it has an instance of its platform that can be consumed as a cloud service.

    It’s too early to say to what degree an open source platform might usurp proprietary platforms in the enterprise. Change tends to come slowly to enterprise IT organizations. However, as organizations embrace next-generation applications based on microservices and containers, enterprise IT organizations are clearly evaluating their monitoring platform options going forward.

    — Mike Vizard

  • Application Monitoring Using Stagemonitor

    Application Monitoring Using Stagemonitor

    This article covers important steps to monitor a typical Java application using Stagemonitor tool, Kibana as a dashboard viewing tool and Elasticsearch as a data processing engine.

    Stagemonitor is an open source Java application performance monitoring (APM) tool that provides everything you need in development, quality assurance and production to monitor the performance of your Java web application.

    Using this tool, we can have different dashboards such as JVM dashboards, application server, request metrics, host, request analysis, web analytics, etc.

    Architecture of the Stagemonitor

    Figure 1

    The Stagemonitor agent sits inside the application and sends metrics and details about requests (request traces) to Elasticsearch. Metrics can optionally be sent to Graphite, Influx DB and Prometheus.

    Prerequisites

    • Minimum of 2GB RAM and 200GB hard disk
    • Java version of 1.8 or more
    • Install latest versions of Kibana and Elasticsearch

    Steps to Monitor Java App with Stagemonitor

    Dev Time Monitoring With Browser Widget

    This step illustrates how to enable a widget in dev time monitoring, adding the Stagemonitor plugin inside the Java app. We can do this in two ways: We can directly edit the pom.xml/build.gradle file by adding the required stage monitor plugins, or we can add dependencies in the application’s LIB directory.

    Some of the important plugins we must have in pom.xml/build.grade to get monitoring dashboards are Stagemonitor configuration, Stagemonitor tracing Elasticsearch, Stagemonitor tracing, Stagemonitor-jdbc, Stagemonitor-jvm, Stagemonitor-os, Stagemonitor-web-servlet and Stagemonitor alerting.

    We’ll get the Stagemonitor plugins from the following location: https://mvnrepository.com/search?q=stagemonitor

    After installing the agent, will have to create one Stagemonitor configuration file as stagemonitor.properties file under src/main/resources in case of maven application. Otherwise, the file must be located at the root of class path. At the end, it has to be under the WEB-INF/classes section.

    The following is what the stagemonitor.properties file looks like:

    stagemonitor.applicationName=My Application

    stagemonitor.instanceName=dev

    stagemonitor.instrument.include=org.example.app

    Request Dashboard

    In this section, we focus on setting up the time series database to collect the data and visualization tool to view the metrics in detail. Here we’ll use Elasticsearch as the time series database engine and Kibana as the visualization tool.

    To get the data from Elasticsearch database, we will include properties in the stagemonitor.properties file:

    stagemonitor.reporting.elasticsearch.url=value,

    stagemonitor.reporting.elasticsearch.username=value

    stagemonitor.reporting.elasticsearch.password=value

    stagemonitor.reporting.interval.elasticsearch=60

    After adding all the required values and restarting the server, we will be able to open the (automatically added) request analysis dashboard in Kibana. Along with that, we will be able to see different dashboards automatically.

    To use Influx DB as a time series database, we’ll have to configure the values in stagemonitor.properties file:

    #following the details contains influxDB

    stagemonitor.reporting.influxdb.url=http://localhost:8086

    stagemonitor.reporting.interval.influxdb=60

    stagemonitor.reporting.influxdb.username= value

    stagemonitor.reporting.influxdb.password=value

    Logs Monitoring using Kibana/Stagemonitor

    We can track logs using Kibana/Stagemonitor. In the metrics dashboard, we can see matrices such as what URL address we’ve hit and the time to complete the request (Figure 2). We can track the host details such as how many servers our applications are running, the status of the server, memory stats, CPU stats, network stats, disk usage stats, networks processed, network packets errors, network packets dropped and how many cores of the CPU the host is using.

    Stagemonitor provides all the required dashboards under the request analysis dashboard. To open the request analysis dashboard, click on: Dashboard – Load Saved Dashboard and select “Request Analysis.”

    Figure 2

    Figure 3 shows the details of the CPU, such as CPU usage and CPU load.

    Figure 3

    Below, Figure 4 shows total page views, unique number of visitors to the site and call tree, and how much time it takes to complete.

    Figure 4

    Figure 5 shows the transaction history and individual transaction details.

    Figure 5

    Figure 6 shows the JVM details and all the other memory matrices.

    Figure 6

    As mentioned above, we can monitor various application metrics and infrastructure metrics.

    — Sai Babu Tanguturi

  • DevOps Chat: CHAOSSEARCH New Spin on Big Data Analysis

    DevOps Chat: CHAOSSEARCH New Spin on Big Data Analysis

    Analysis is the dark cloud overhanging big data — it’s difficult without the right tools. Elasticsearch by Elastic has become ubiquitous in helping organizations, but it can get unwieldy, as storage combining with compute is tricky. CHAOSSEARCH is an early stage startup designed to  make searching massive amounts of data using elasticsearch and Amazon S3 easy.

    Pete Cheslock, VP of Products at CHAOSSEARCH and a good friend of devopsy.kinsta.cloud, joined me in this DevOps Chat to discuss his latest company’s technology and how it might make big data searches less daunting. The key for big data search and analysis is separating storage from compute, using Amazon S3 and Elasticsearch.

    As usual, the streaming audio is immediately below, followed by the transcript of our conversation.

    Audio

    Transcript

    Alan Shimel: Hey everyone, it’s Alan Shimel, devopsy.kinsta.cloud, and you’re listening to another DevOps Chat. Today’s DevOps Chat features a returning guest to DevOps Chat. He’s actually probably been on DevOps Chat a number of times, right from I think the very beginning of when we first launched devopsy.kinsta.cloud. He’s pretty well-known in the DevOp community and really needs no introduction from me. It’s Mr. Pete Cheslock. Pete, welcome to DevOps Chat.

    Pete Cheslock: Hey, thanks a lot. Thanks for having me.

    Shimel: Yep. Pete, always a pleasure to have you, man. You know, I remember speaking with you – actually it was probably before I even launched devopsy.kinsta.cloud, up in Boston. And you kind of gave me your views on what was then a very kind of just starting to blossom DevOps community and DevOps movement. And since that time obviously a lot of water under the bridge and many different hats that you’ve worn, Pete. Here to introduce today though with your latest position in helping a company grow, and that company is called CHAOSSEARCH, correct?

    Cheslock: Yeah, that’s correct.   

    Shimel: And Pete, you’re VP of Products?

    Cheslock: Yeah, yeah, VP Products, Products, VP of Products? I don’t know, it’s a working title. We’re still trying to figure out what the best way to –

    Shimel: As long as they don’t call you a DevOps engineer, it’s all good. [Laughs]

    Cheslock: Exactly.

    Shimel: I hear ya. So Pete, well let’s start off with this. I’m going to assume a lot of people listening to this today don’t really know or are not familiar with CHAOSSEARCH, so why don’t we start with that? What’s CHAOSSEARCH?

    Cheslock: Yeah, absolutely. And yeah, I think that’s definitely a good assumption. You know, we’re an early-stage startup. We’re just going through seed funding right now, so we’re just going through an A round of fundraising, so then we’re going to be coming out to the market in a few months here. But basically what CHAOSSEARCH is is they’re trying to make it easier to access and make query-able your data as it exists on object stores. So if you think of an object store like Amazon’s S3 service. And so they developed basically a technology that allows you to store data. They basically process your data from S3 and store it back into your bucket. So what’s really interesting is they don’t hold any of your date. They’re simply – you know, you give them like a read-only to your S3 data. They’ll read in that data and shove the compressed, processed data back into your bucket. And then from there they expose APIs to allow you to access it.

    So for example, they’ll extend the S3 API to give you some really interesting capabilities of slicing and dicing your data. But the thing that they’ve exposed that’s most interesting, which got me excited about the company, is that they’ve exposed the elasticsearch APIs on top of your data on S3. And so it’s really compelling, because I spent a very long time as a really early user of elasticsearch, and it’s a great technology; it’s a great open source database. But it gets unwieldy over time. And so what really blew me away when I saw the product and what they’d built is that I can point open source log tools like Kibana to the CHAOSSEARCH APIs, accessing my own data on S3. No elasticsearch required. And so the kind of short pitch, we’re trying to make that long tail of data available to people, whether it’s log data or event data of some kind, where customers can run much smaller elasticsearch clusters of their log data or event data, and then they can essentially push the data up to S3. We’ll process it, and now they can get access to that data for weeks, months or even years.

    Shimel: Yeah. And Pete, that really highlights sort of a soft-white underbelly or a dark corner around the whole big data issue. It’s great to have – I mean, big data and – big data is only as good as the analysis we can do with it, right? That we can perform on it. And with big data we could certainly get some really keen insights to show us relationships, trends, facts that we might otherwise miss. But the dirty little secret was, for big data, to really get the value out of it, generally you needed big money kind of search to perform that kind of analysis. Because the bigger your data got, the harder it was to actually manage it, search it, analyze it. And so CHAOSSEARCH seems like a real solution for those people who are literally drowning in data.

    Cheslock: You’re exactly right. I worked at a company eight or nine years ago called Sonian, which – not a lot of people have heard of Sonian. They were one of the earliest users of Amazon’s S3 and EBS. At the time we were probably the top-three user of S3 and maybe the top-five user of EBS. What’s amazing about Sonian is the number of companies that actually came out of that place. Companies like CloudHealth, which just got acquired by VMware. Sensu was a technology that was built inside of there. Stackdriver was another one. And the reason all these startups came out of Sonian is because they were so early in the cloud space, they had to build out the technology to support it.

    One of the other ones that kind of came out on the side, not really related to us, was elasticsearch. We were trying to index customer e-mail data, like an e-mail archiving product. And so we got connected with Shay from elasticsearch before he really started the company because we were so blown away by what he had built. And elasticsearch at the time made sense, right? Using Lucene to store indexes of customer e-mail data allowed the indexes to be much smaller than the sourced e-mail files. But then over time, over the last say eight years or so, elastic’s been around, there’s been this explosion of using elasticsearch for log data. And in many cases, like structured JSON that we’re shoving into elasticsearch. And due to the inverted index nature of Lucene, the data blow up inside of Lucene where you might actually store four or five times more in disc storage on elasticsearch.

    So if you shove in a terabyte of JSON logs into your elasticsearch cluster, that could be three or four terabytes of Lucene indexes. And then you have to think about like, “Well, I want durability and reliability, so now I need to like run a replicant index.” So now you’re talking for every terabyte into elasticsearch you need like eight terabytes of physical disk. What was really amazing about what the founders and the early team here has created is the format, kind of solving for the Lucene problem. They’ve actually been able to reduce the size, yet still making the data query-able, using kind of the same APIs, which is what really blew me away, in that it’s now – you know, so many people have to make the choice. Do I keep my data for analysis, at a really high price of elasticsearch? Or, do I throw it away? And I think a lot of people just throw that data away, because they just can’t make it worthwhile in any sort of cost effective way. 

    Shimel: Right, not in an economic way. Pete, we’re far from a big data solution here at MediaOps, between our seven or eight websites, but I will tell you, just pure search, like an index search on devopsy.kinsta.cloud has become a struggle. Because a lot of the native WordPress search – you know, especially if it’s on server, is killing resources on your web server and so forth. So you want to do it sort of off-server search and it’s just a pain in the butt. Take my word for it. So this is great. You said the company’s launching in a few months though? Not that it’s launching – it’s looking for seed money now. Product will be in market. Where exactly is it now in terms of – is it in beta? Is it alpha?

    Cheslock: So yeah, we’re probably going to be closing our A fundraising round over the next 30 days or something like that. The company actually started about two and a half years ago, and so they’ve been essentially building this technology out over the past couple of years and really trying to refine it as they were kind of were coming up with this like product market fit. Like what’s the market we’re going into? And as the founders really looked at the space, they realized that log and event management is where a lot of pain is right now. What’s interesting is when people start using the product, they realize that they can process any kind of data with this and query it. And that’s where there’s a lot of interest, where maybe it’s not just log and event data. Maybe it’s like some long tail of data that you want to get access to or to monetize for your customers.

    But where we’re at right now, and what was exciting about me coming onboard is not only did my role change completely – I used to run Technical Operations for Threat Stack, which is a pretty successful cloud security company that’s still just crushing it. I changed my role over to become the Head of Product. So working with customers to understand their use cases and how they’re using tools like elasticsearch. So where we’re at right now is I’m basically looking for what we’re calling design partners, where – the best way to describe the product is in that beta phase, where we’re looking for people with really interesting datasets and maybe people who are on Amazon and have data on S3 or are using elasticsearch, and getting them into our proof of concept setup right now, where we can have them run queries, test the analysis, test how they might use it and really help us refine the final bits as we kind of _____ things up towards GA.

    And then, once we go to GA, towards – I would say October timeframe I think is what we’re aiming for, it’s really to continue to refine these really specific use cases like, “I’ve got data on S3 and I want to process this data.” We’ve had some customers that want to push their elasticsearch indices up through the service, which is a really interesting idea, because those loosing indexes already have a defined schema. And so that way, instead of storing seven days of data in elasticsearch, maybe they just store one day and that’s in their hot cluster in elasticsearch on EC2 or something. And then days two through 365 are up on S3 and are available through the CHAOSSEARCH service. So yeah, that’s kind of what the next month or two looks like for me. You know, really trying to work with customers, people with interesting datasets. You know, people who have just way too much elasticsearch and they want less of it. You know, they want to kind of run less servers, spend less money – which I feel like is kind of everyone out there right now.

    Shimel: Excellent. Very cool stuff. I mean, Pete, look, for you to get up and leave Threat Stack and come over here, obviously it had to be something really appealing and compelling, to bring you over there. Pete, it’s interesting. My background prior to devopsy.kinsta.cloud was founding and building companies, and one of the things I learned is it’s great to have these grand – come up with the idea of Docker for containers and change the way – you know, the basic platform that we use, right? For our apps and for IT. But those revolutionary kinds of things are really kind of few and far between, especially the ones that succeed. Really IT moves along in evolutionary kind of ways, where it’s a thing like this. It’s thing like with CHAOSSEARCH is doing, that makes it easier, better, faster, more economical to really get a hold of your big data and do the analysis and get a handle on it that you need to make it valuable. Right?

    Cheslock: Yeah. Exactly right.

    Shimel: And so, you know, this just feels that way to me – that this is a lot – some people may say, “Well, it’s not earthshattering.” But no, but it’s the logical step. It’s the glue that you need to – you know, big data is a big concept and it’s great and it’s going to revolutionize things when we get it. But you need the CHAOSSEARCH or sort of the glue to make these things happen, right?

    Cheslock: Yeah, what’s amazing is, as I’ve talked to people running a lot of elasticsearch, a lot of data on S3, it’s a really easy sell, because I can go to them and get them away from running these huge clusters that – they may not even take a lot of queries too. That’s what’s interesting is maybe they’re only querying their data in an automated way the last hour or 24 hours. But then you start looking out seven days, a few weeks, maybe a few months; those queries are significantly less. And so you have to either build out like a tiered storage. But at the end of the day the storage and computer are coupled so tightly that your scalable units on Amazon or any cloud provider is a lot of disk and a lot of CPA all together. And what CHAOSSEARCH has done, it uncoupled storage and compute, where the storage is on S3, specifically your S3 account, and the compute is the CHAOSSEARCH service.

    And so it’s a totally different way of thinking about, “How do I access my data? How do I make it query-able?” And now, because it costs so little – and we’re talking like go-to-market pricing a tenth of the price of running elasticsearch yourselves, and significantly less than a lot of the other kind of hosted management, log manager vendors. You know, it’s like now I can keep my data for month and a year and I can run machine learning models cost-effectively, because I can keep so much data. That’s the part that’s super interesting, is, how does this change data science and those companies that really want to have the long tail of data for ML/AI testing, and how does this change how they work their models, how they build it in? And we’re even trying to build in like tenser-flow integration into the application so that you can just access it from within without needing to have all this crazy data science experience.

    Shimel: Excellent. It really is. Pete, you know, 15 minutes goes quick. We’re coming up on our thing here. You’re VP of Product. Where do you see this going six months, a year, two years out? It’s a long way to look, but where do you see yourself taking the product direction here?

    Cheslock: Yeah, no, I always like to joke that the next six months are clear and in focus. Things get really fuzzy really quick after that. But the nice thing is I think we have a pretty clear plan going out of it. Through the end of the year, reaching GA, bringing some customers onboard that we can solve a problem for them. But really, early next year we’re going to start beta-ing a self-service kind of model, where people can come in and try it out. And probably doing even a freemium model, because since the data is in your S3 bucket and we’re just processing that data, cost is very low. So being able to provide someone a couple of gigs a day of data processing, it’s pretty easy for us. And then that way people can kind of get their feet wet and try it out and we can really start building a community around it.

    And then from there, I think the sky’s the limit. You know, we’re looking at some time end of next year, the ability to run it within your own data centers. Right now we want to be kind of pure SaaS so that we can continue and build it out and improve it in our kind of very quick, iterative development cycle. But really it’s a data platform we’re building. I mean, we’re going after that log and event management space because it’s so painful for so many people and it costs a lot of money. But the long-term for us is, what other APIs could we expose on top of your data on S3? Elasticsearch seemed to make a lot of sense, given the market. We’ve extended S3 with some interesting features. But like what else is there? What are different ways people are trying to access different data? And so I think that will be a lot of fun to kind of chat with people, understand their pain and maybe actually bring them a nice solution to that pain.

    Shimel: Yeah, absolutely. And I’m sure you’ll have a ball doing it, Pete. Anyway, we’re over time here. Pete Cheslock, newly minted VP Products, CHAOSSEARCH. Thanks for joining us on this episode of DevOps Chat, and we look forward to hearing more about CHAOSSEARCH and about your adventures, Pete.

    Cheslock: Yeah, thanks a lot. Thanks for having me. This was a lot of fun.

    Shimel: Always a pleasure. Pete Cheslock, CHAOSSEARCH. This is Alan Shimel for devopsy.kinsta.cloud. You’ve just listened to another DevOps Chat. 

    — Alan Shimel

  • Splunk and the ELK Stack: A Side-by-Side Comparison

    Splunk and the ELK Stack: A Side-by-Side Comparison

    This article’s purpose is to compare the “big two” in the log analytics world—Splunk and the ELK Stack. But before we go into details, a short introduction to the competitors is required.

    Splunk is the “Google for log files” heavyset enterprise tool that was the first log analysis software and has been the market leader ever since. The open-source ELK Stack of Elasticsearch, Logstash and Kibana is an up-and-coming rival that is a consolidated data analytics platform. The two compete in terms of features, usability and cost.

    Overview

    Splunk and the ELK Stack use two different approaches to solve the same problem. People typically choose one or the other based on how their organizations are structured and how much time they want to devote to log analytics. Splunk takes a pile of data and allows people to search through the information to extract what they need. ELK requires more work and planning in the beginning, but the value extraction is easier at the end.

    The three key components of Splunk are its forwarder, which pushes data to remote indexers; indexer, which has roles for storing and indexing data and responding to search requests; and search head, which is the front end of the web interface where these three components can be combined or distributed over servers. Splunk also supports the integration of its functionalities in applications via SDKs. Common use cases include operational monitoring, security and user behavior analytics. Splunk is a paid service wherein billing is generated by indexing volume.

    The ELK Stack is a set of three open-source products—Elasticsearch, Logstash and Kibana—all developed and maintained by Elastic. Elasticsearch is NoSQL database that uses the Lucene search engine. Logstash is a data processing and transportation pipeline used to populate Elasticsearch with the data (though also it supports other destinations including Graphite, Kafka, Nagios and RabbitMQ). Kibana is a dashboard that works on top of Elasticsearch and facilitates data analysis using visualizations and dashboards.

    Both Splunk and the ELK Stack can be used to monitor and analyze infrastructure in IT operations as well as for application monitoring, security and business intelligence.

    ELK vs. Splunk

    Loading Data

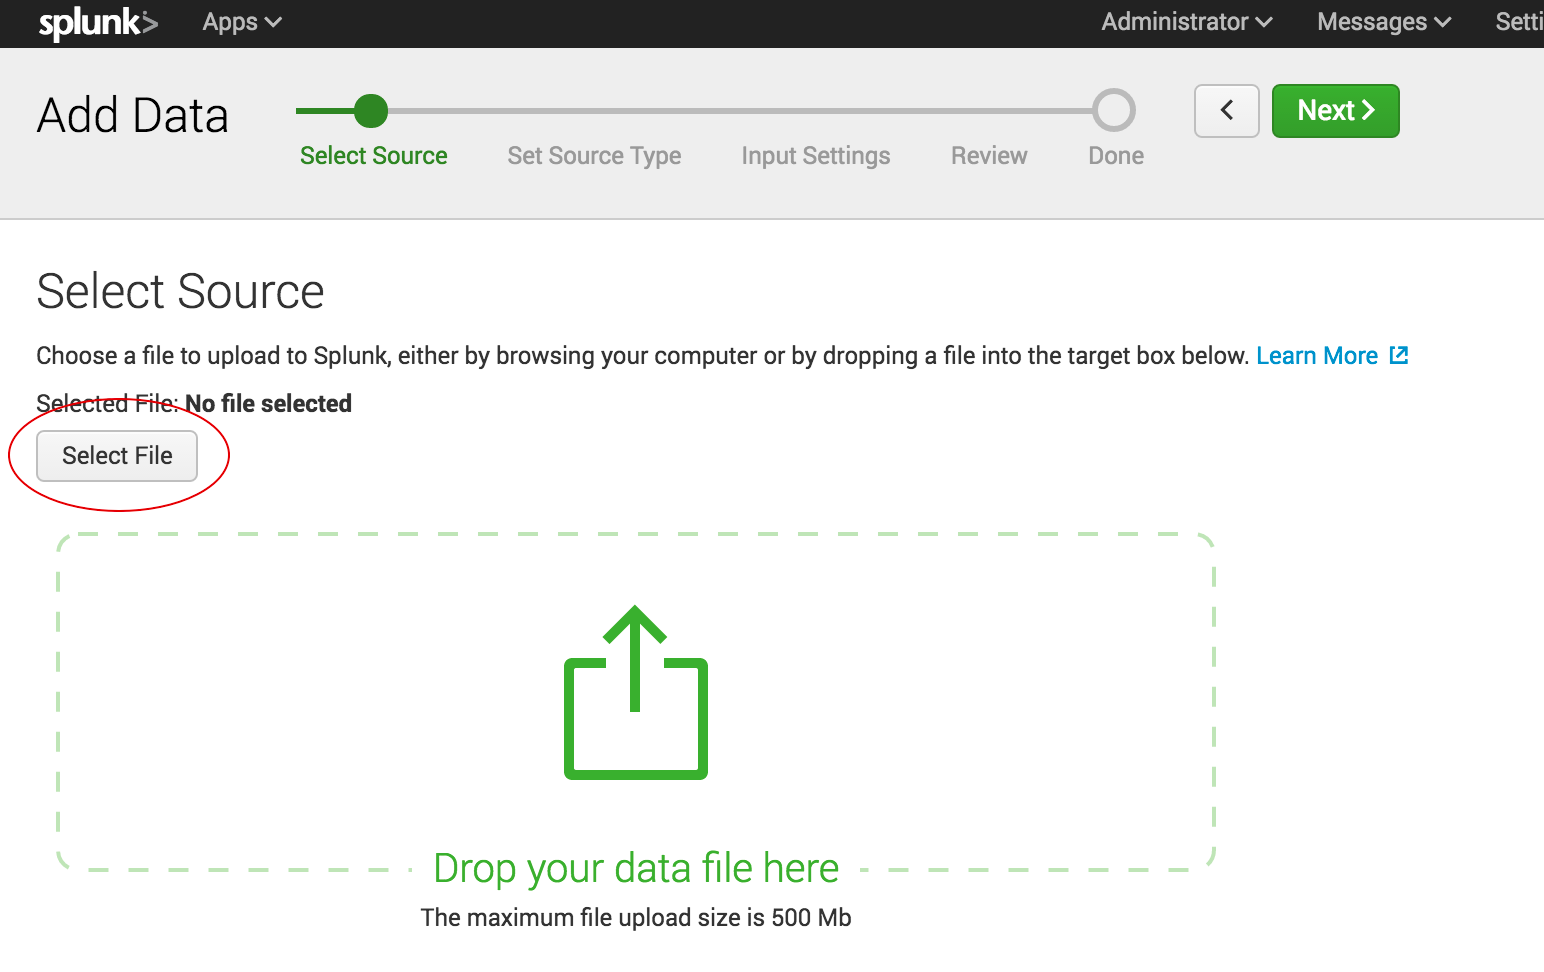
    Shipping data to Splunk is fairly easy. After installation, the forwarders come pre-configured for a wide selection of data sources such as files and directories, network events, windows sources and application logs, and they are used to import data into Splunk as shown:

    import data into splunk

    In the ELK Stack, Logstash is used to ship data from the source to the destination. However, Logstash needs to be configured so that each field is identified before the data is shipped to Elasticsearch. This kind of configuration can be tricky for those who do not work with scripting languages (such as Bash, Python or Ruby), but there is good support online that can be found quite easily.

    Visualizations

    The Splunk web UI includes flexible controls that allow you to edit and add new components to your dashboard. Management and user controls can be configured differently for multiple users, with each having a customized dashboard. Splunk also supports visualizations on mobile devices with application and visualization components that are easy to customize using XML.

    splunk xml customization

    Kibana is the visualization tool in the ELK Stack, and like Splunk, the platform supports the creation of visualizations such as line charts, area arts and tables and the presentation of them in a dashboard. The search filter is always shown above the different views: If a query is used, it is automatically applied on elements of the dashboard. Splunk also has a similar option, but it involves configuration in XML. Still, Kibana does not support user management, but hosted ELK solutions provide it out of the box.

    kibana

    Search Capabilities

    The search function is a key capability of any log management platform. Both the Splunk and ELK Stack’s web UIs support searching using a dedicated search field. The query syntax on Kibana is based on the Lucene query syntax while Splunk uses its own Splunk Search Processing Language (SPL). Those familiar with scripting languages may already be familiar with Lucene while SPL is proprietary and must be learned.

    One other difference is that Splunk offers dynamic data exploration to help users to find and extract everything as a searchable field when formatted in a manner that allows searching for non-configured fields. Elasticsearch fields, on the other hand, need to be defined in advance to use aggregation over the log properties.

    Here is one example of a query for each platform.

    Kibana:

    (beat.hostname: ES1 AND metricset.name: process) AND (system.process.username: root OR system.process.username: admin)

    Splunk:

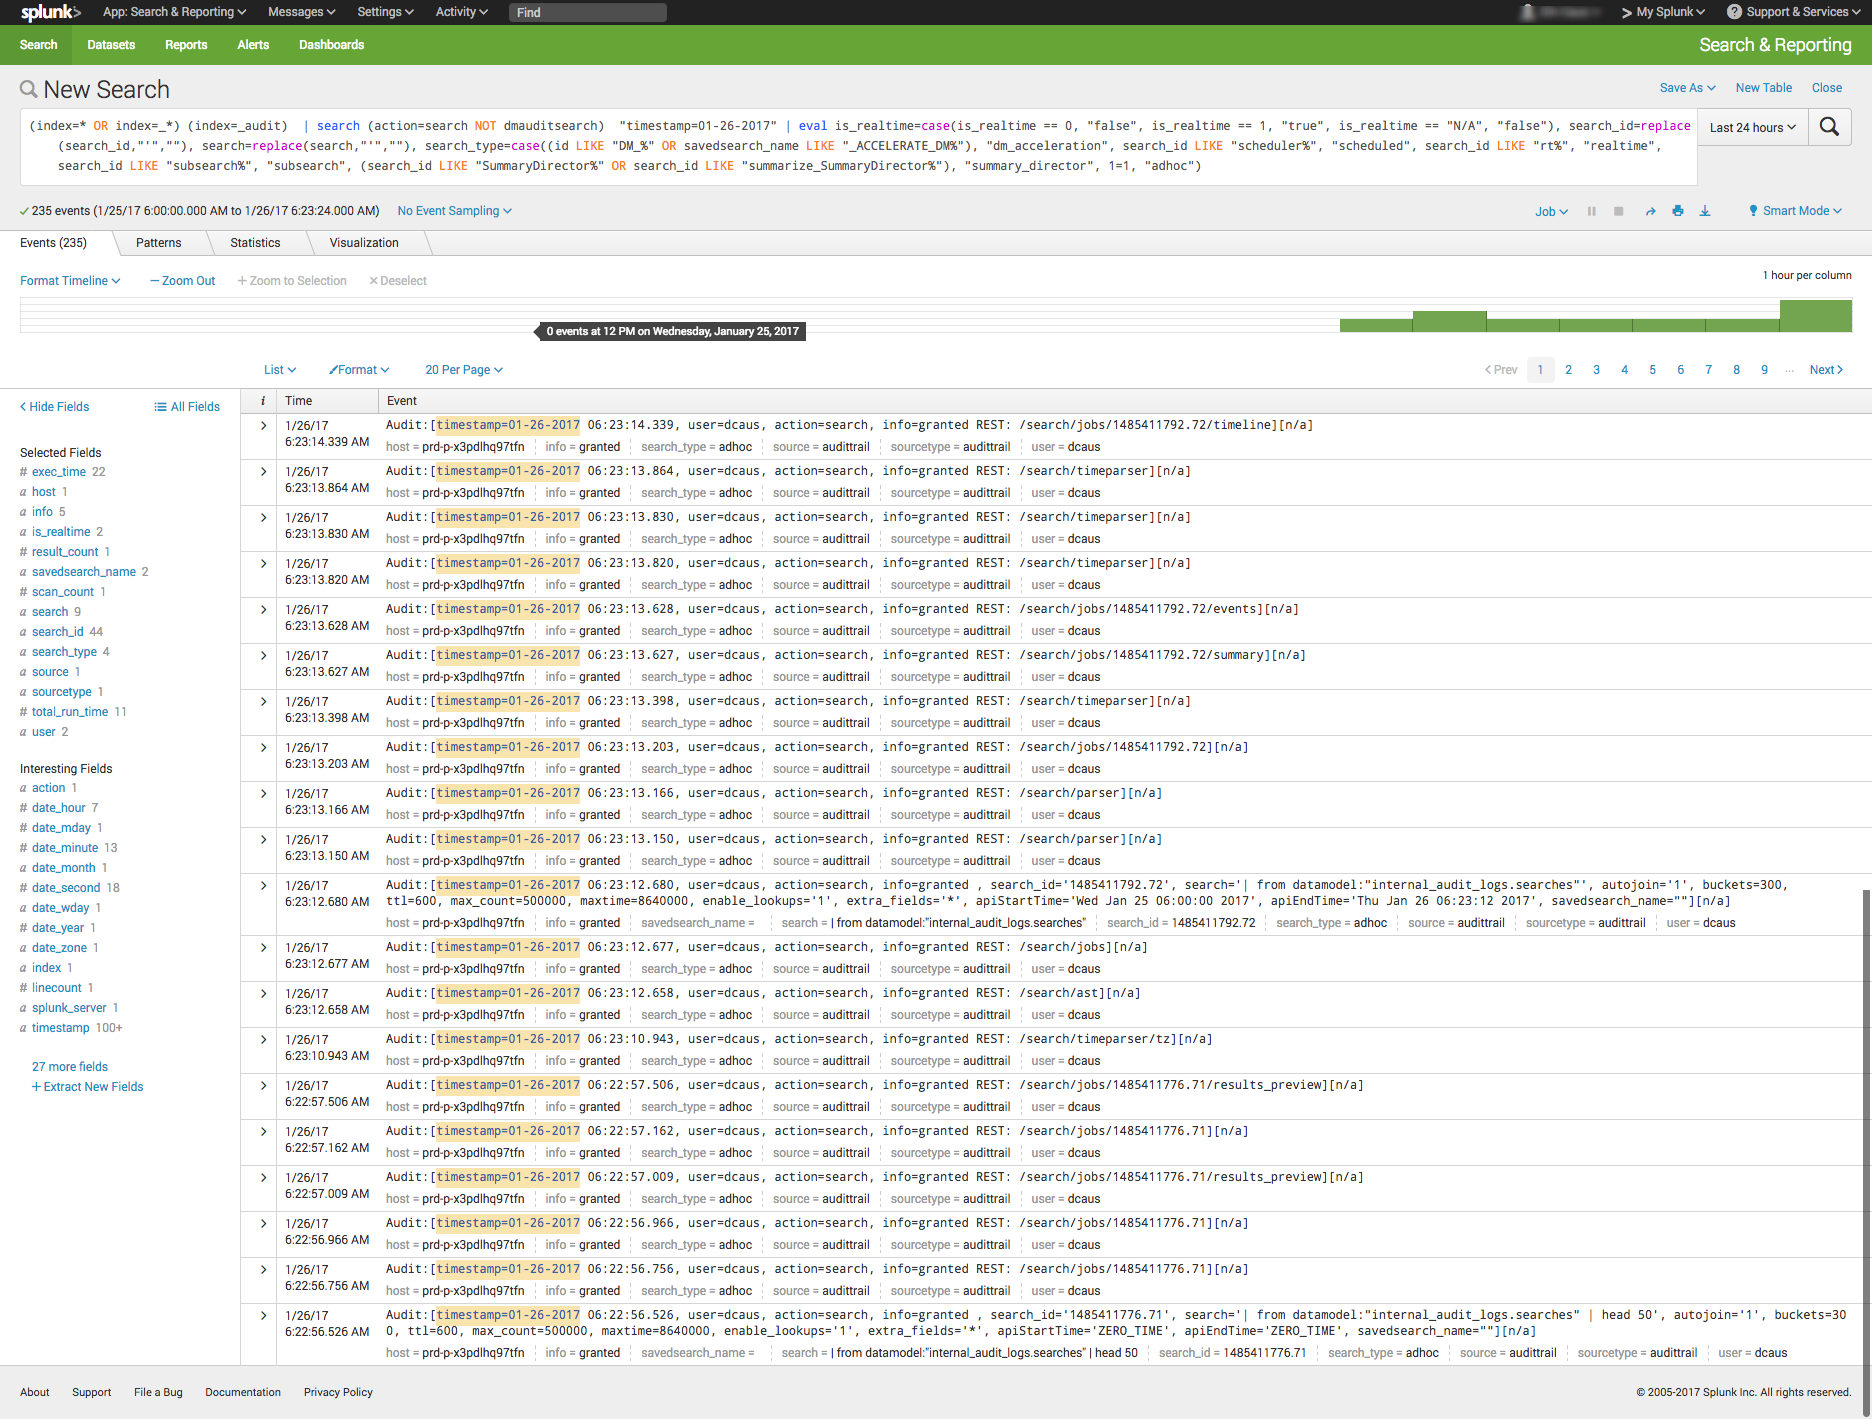
    (index=* OR index=_*) (index=_audit)   | search ( action=search NOT dmauditsearch )  "06:54"

    The difference between SPL syntax and Lucene queries is that SPL supports the search pipeline (as in the example above) in which consecutive commands are chained together using a pipe character that allows the output of one command to be used as the input of the next one. Lucene query syntax is more straightforward and can work to generate the output from the query without additional transforming.

    Traction and Community Support

    Both Splunk and ELK Stack have large communities of users and supporters. ELK also has its own clear and extensive documentation for each separate tool, making it easy to get started. In addition, Elastic itself offers educational sessions worldwide.

    In addition to having good documentation and a forum, Splunk, too, has customer and support platforms that offer various professional services. Splunk’s education program and instructors are available virtually or on site.

    The Learning Curve

    The ELK Stack’s learning curve is flat for what it’s meant to do. Elastic offers paid courses, but there is a lot of free material online due to the popularity of the open-source platform.

    For Splunk, the learning curve is moderate in size, especially when carrying out more specialized analyzes. The company offers a trial period with extensive documentation, but the advanced Splunk educational courses are fairly expensive.

    User Management

    The ELK Stack provides role-based security as a separate paid tool. Splunk and managed-ELK services offer user management out of the box with user auditing included.

    Pricing Levels

    As already mentioned, Splunk is proprietary software with a price tag. After one integrates several data sources with the platform, the cost will increase greatly as data is continuously generated.

    The open-source ELK Stack is free, but the true picture is not so black and white. The cost of the platform’s hardware and maintenance also adds up. To lower the cost of using ELK, features, plugins and tools must be developed.

    Vendor Lock-In

    Splunk’s high price tag comes with the benefit of offering an overall, well-rounded product. Users might be locked into a vendor, but that one vendor is all that is needed to do nearly anything. The open-source ELK Stack is seemingly free, but it does not provide many functionalities such as alerting out of the box—and it costs money to develop and maintain them.

    Spunk is Splunk. There are many varieties of ELK:

    One way to look at the Splunk-versus-ELK discussion is to frame it as the old Microsoft-versus-Linux debate. If you like Microsoft, you will probably prefer Splunk. If you like Linux, you will likely want to use the ELK Stack.

    Final Thoughts

    When one decides between these solutions, the ultimate choice should reflect not only on the platform but also on the customer’s specific needs.

    Both Splunk and the ELK Stack are currently popular. But what might the future hold?

    splunk vs elk
    Splunk (Blue) vs. Elasticsearch (Red) on Google Trends

    According to Google Trends, the ELK Stack has now overtaken Splunk in terms of the proportion of Google searches. But ELK’s traction does not stop there. As mentioned earlier, Splunk self-reports 12,000 total users. Elasticsearch is reportedly downloaded 500,000 times every single month. In IT departments, then, it is far more likely to meet people who are familiar with ELK than with Splunk, meaning that the adoption rate of the ELK Stack could “snowball” and increase even more in the future whenever ELK users join new companies or teams. People tend to use whatever software they already know or is already being used.

    It’s clear that many functionalities are being added to the open-source ELK Stack. This, in turn, is shrinking the gap between it and Splunk. hose features currently found only in Splunk are likely to be added to ELK at some point in time.

    So, if a more mature product is what you need, go with Splunk. But if you like a product that is more flexible, ELK is the way. Either way, it’ll be interesting to see how these two continue to compete.

    — Asaf Yigal

  • DevOpsQA NJ Meetup –  ELK Stack

    DevOpsQA NJ Meetup – ELK Stack

    Our guest speaker at the May DevOpsQA NJ Meetup was Peter Kim from Elastic.  Peter  is a Solutions Architect at Elastic with over 10 years of experience architecting and developing search applications with Endeca, MarkLogic and core Lucene.  He gave us a great overview of ELK Stack, which consists of ElasticSearch, LogStash and Kibana.

    In summary,  ELK Stack is an end-to-end stack that delivers real-time insights into data from almost any type of structured and unstructured data sources.  It was designed to address the issues of inconsistent log formats,  log distribution across servers as well as high level of expertise required to understand the log outputs.   ELK Stack provides open source integration with configuration management tools like Chef, Puppet and Ansible as well as a connector for Hadoop.

    Peter then extensively discussed each component of ELK stack.  Logstash manages events logs,  by collecting, parsing and storing data.  It is fully open source with the Apache 2.0 license .  Grok is a tool that can be used to parse unstructured data into something structured and queryable. logstash_logo

    ElasticSearch is schema-free, REST & JSON based document store.  It’s every function is exposed via REST APIs.  ElasticSearch is distributed and horizontally scalable, comes with a log of plugins for analysis,  localization support, etc and client API for various programming languages.

    Kibana is a data visualization and analytics platform integrated with ElasticSearch .  Peter gave a live demo of Kibana with Apache weblog data.

    The session  was followed by a lot of good questions ranging from security,  real-time data to the fuzzy search and complex aggregations.  At the end,  Peter told us about Elastic Roadmap including Watcher for alerting and new  features which are coming out as part of ElasticSearch 2.0.

    If you are interested to learn more about Elastic,  you can reach out to Peter at peter@elastic.co

    Special thanks to IshiSystems  (http://www.ishisystems.com/)  for sponsoring the venue.

    Join us at our next meetup by signing up at  http://www.meetup.com/DevOpsandAutomationNJ/  or follow on Twitter @DevOpsQA

    logo-elastic

  • A How to Guide on Modern Monitoring and Alerting

    A How to Guide on Modern Monitoring and Alerting

    syslog-ng, riemann, collectd-notifications, elasticsearch: putting it all together

    Context

    At our organization (CCIN2P3) we are building an event-based infrastructure to push structured messages to different subsystems for alerting, reporting and storage. Using syslog-ng, each message is normalized into a structured event, optionally correlated with other messages, and conditionally routed to the next systems, including:

    • a synchronous web-dashboard,
    • different asynchronous alerting systems, and
    • a searchable storage backend.

    The events which are collected are essentially system and application logs. Here’s a few examples of interesting messages:

    puppet-agent[16528]: Finished catalog run in 44.06 seconds
    kernel: Killed process 29959, UID 42046, (hadd) total-vm:202363492kB, anon-rss:13069860kB, file-rss:60kB
    ata2.00: exception Emask 0x0 SAct 0xffff SErr 0x0 action 0x0
    EXT3-fs error (device dm-1): ext3_journal_start_sb: Detected aborted journal
    

    The unified nature of this pipeline makes it possible for a human to easily identify an event in all the available back- and frontends.

    In this post you’ll learn a way to implement this model, and achieve the following:

    • Collect system metrics
    • Monitor events for outliers
    • Normalize and Correlate these events
    • Route the events to a real-time stream processor and to a searchable storage backend

    We’ll describe the configuration files you’ll have to change, and explain the workflow that processes an event. For the impatient, we’ll illustrate the final result in a short recorded demo.

    Demo

    Realtime monitoring using riemann, syslog-ng, collectd and elasticsearch

    Requirements

    We will assume you have basic knowledge of the following tools, as well as a running instance of each:

    The tools

    Here’s a list of all the tools we’ll be using, along with a short summary, and their main functions in the pipeline:

    On the client:

    • collectd: “a daemon that receives system statistics and makes them available in a number of ways”
      • periodically poll system metrics
      • trigger notifications based on predefined thresholds
    • (any)syslog: “system error logging protocol”
      • listen for syslog messages, including collectd notifications
      • forward them to a remote destination

    On the server(s):

    • syslog-ng: “a flexible and highly scalable system logging application”
      • listen for remote notification messages
      • patterndb: create structured events by parsing the flat collectd notification messages
      • route the events to the next stages (riemann, Elasticsearch, Nagios, Email, …)
    • riemann: “aggregates events from your servers and applications with a powerful stream processing language”
      • listen for remote structured messages (protocol-buffers)
      • expose a websocket and/or sse service for subscriptions
      • send asynchronous alerts to the next stages (e.g. Nagios or Email)
    • riemann-dash: “a javascript, websockets-powered dashboard for Riemann”
      • synchronous realtime in-browser display
      • web application to subscribe to collectd streams using websockets or sse
    • elasticsearch: “a flexible and powerful open source, distributed, real-time search and analytics engine”
      • store and index all events
      • expose an API for query e.g. by Kibana
      • “You know, for search!“
    • kibana: “Elasticsearch’s data visualization engine for the browser”
      • browser-based search interface to query elasticsearch

    Architecture

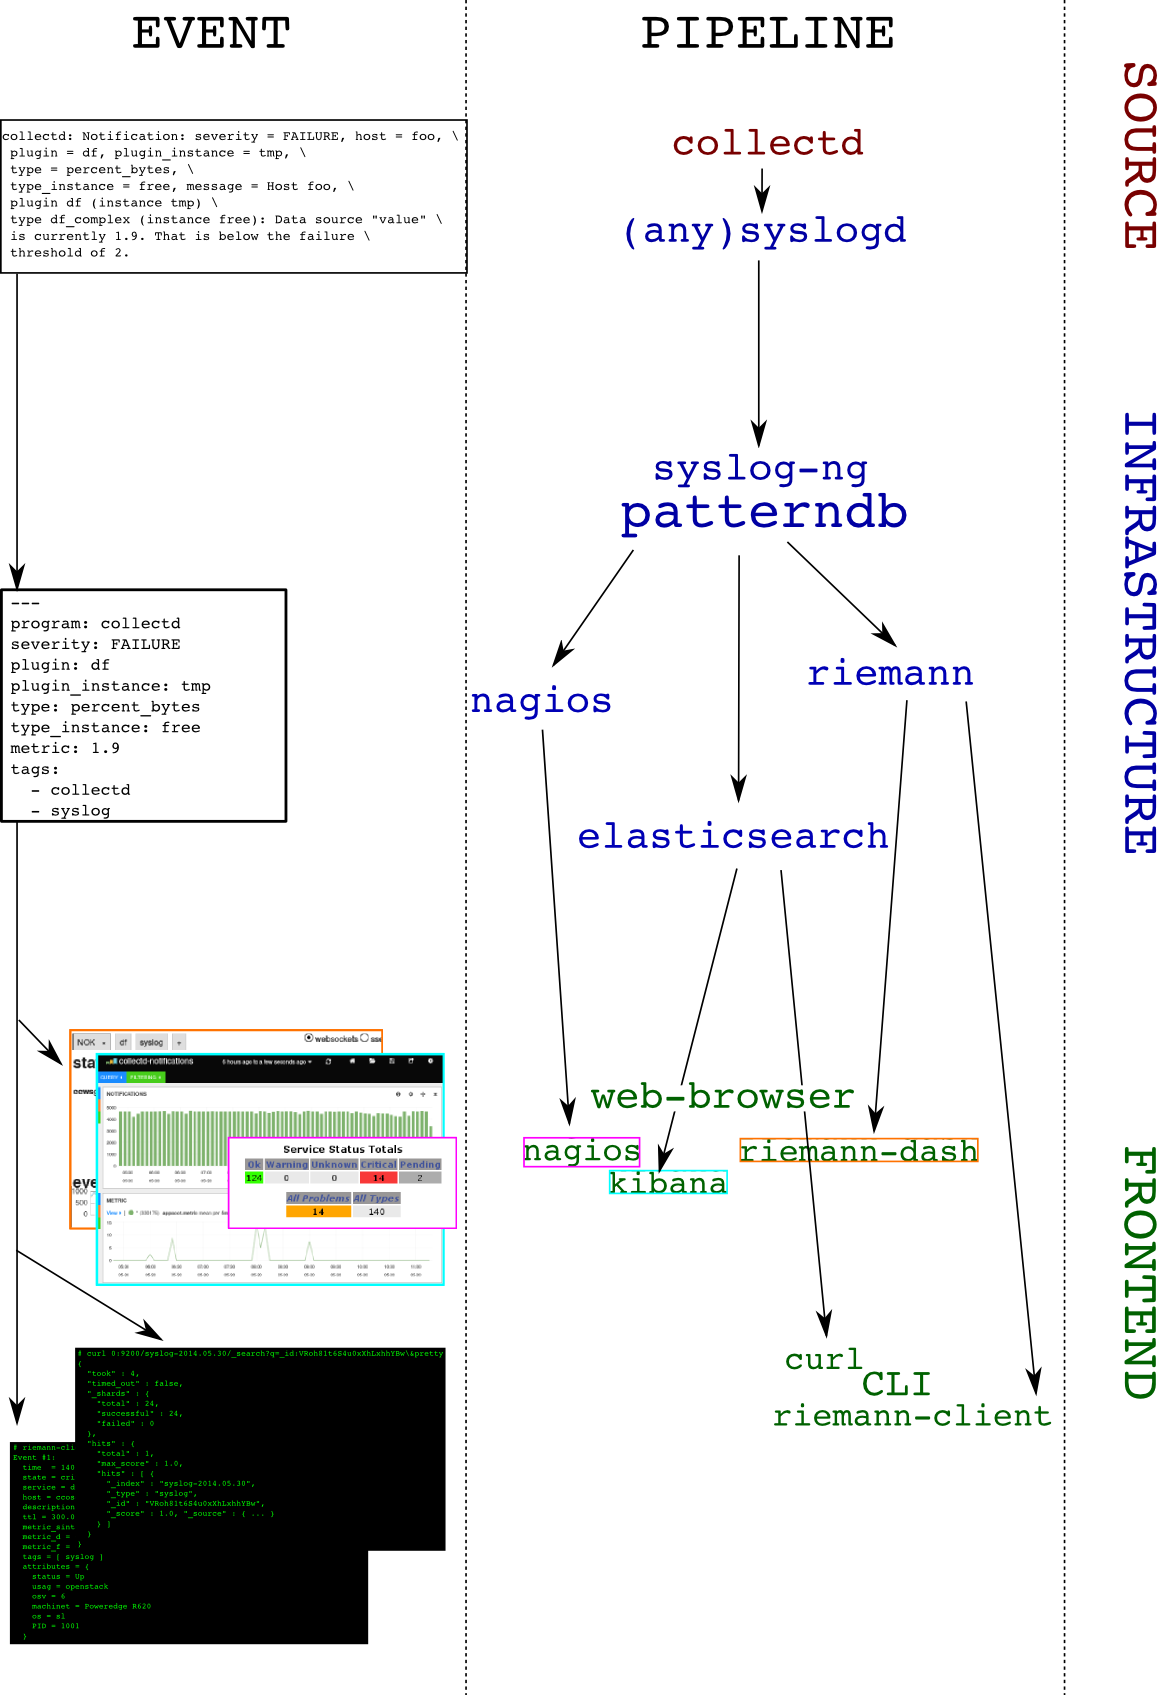
    To make things crystal-clear, we’ll choose an example: let’s track filesystem’s usage. The collectd-df plugin collects this information. Here’s a diagram depicting the dataflow: you can follow how an event is evolving from a user perspective on the left column, as it travels the pipeline (right column):

    architecture

    And the details:

    1. collectd-df plugin polls the filesystem utilization:
      df-tmp/percent_bytes-free is 1.9
    2. collectd-threshold plugin issues a notification as the failure threshold is reached: Notification: severity = FAILURE, host = foo, plugin = df, plugin_instance = tmp, type = df_complex, type_instance = free, message = Host foo, plugin df (instance tmp) type df_complex (instance free): Data source "value" is currently 1.9. That is below the failure threshold of 2.0
    3. collectd-network plugin receives this notification and sends it over to the local syslog server
    4. the local syslog server forwards the flat message to a remote destination
    5. the remote syslog-ng server receives the message and parses it using patterndb
    6. the patterndb extracts relevant values and creates a hash table (name-value pairs):
    • program: collectd
    • host: foo
    • tags: syslog, collectd
    • collectd.plugin: df
    • collectd.plugin_instance: tmp
    • collectd.type: percent_bytes
    • collectd.type_instance: free
    • collectd.thresh_type: the thresh type (above/below)
    • collectd.thresh_value: the failure thresh: 2
    • collectd.metric: the value of the current reading: 1.9

    This structured event is then routed to syslog-ng destinations, in our case riemann and elasticsearch. Both of these applications can then be used to query the event in a comprehensive manner, for example, “show me all collectd notifications concerning the plugin df and the instance tmp“

    Configuration

    Due to formatting issues, and for detailed examples on configuring the components of this solution, see the folowing link.

    Conclusion

    In this article we showed how to send collectd threshold notification messages to a central syslog-ng server, and how to extract numeric metric information from it. We also showed how to route the result to two backends, one of which can be used to view the data in real-time (riemann), and the other to query historical data (elasticsearch). This system could be extended in multiple ways, for instance:

    • by compiling a large patterndb to match multiple subsystem messages
    • by tagging important messages, and routing them to relevant destinations. For instance: “send all hardware errors to nagios“
    • by using the correlation context information to generate alerts, excluding self-healing components: “send an email if a filesystem is full and doesn’t come back to normal in less than 5 minutes”
    • by using the correlation context information to generate alerts upon reaching a threshold on the number of messages: “run this command if the same scsi device is referenced in more than 100 messages every minute”
    • send metric data to graphite

    Configuration files

    tarball

    Here‘s a transcript from a shell session working on these configuration files.

    Link to full article including configuration on github