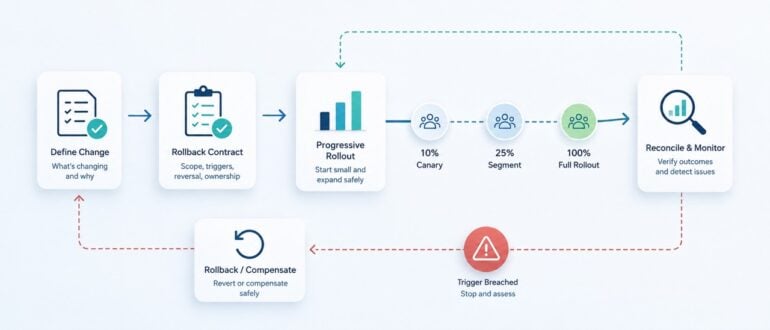
Business automation often reaches production without the release discipline applied to application code. A routing rule changes, an approval threshold moves, or an integration starts writing to a new system. The edit may happen in a visual builder instead of a repository, but its blast radius is still real: orders can duplicate, customers can receive the wrong message, and operators can lose the context needed to recover.
The useful shift is to treat every workflow change as a deployment. That does not mean forcing a full software delivery platform onto every automation tool. It means defining a small release contract before the new behavior touches live work.
Define the Deployable Unit
A workflow is larger than its diagram. Its deployable unit includes decision rules, field mappings, credentials, schedules, permissions, retry behavior, operator screens, and every external side effect. If a change affects any of those elements, the release record should name them explicitly.
Give the unit a version and a stable change identifier. Capture its expected inputs, outputs, and side effects. Then record which systems can be read, which can be written, and which actions are irreversible. This turns an informal edit into something a team can inspect, approve, and reconstruct later.
Configuration deserves the same treatment as code. Changing a threshold from 5,000 to 10,000 may involve only one field in a builder, but it can alter thousands of decisions. Exportable configuration, versioned rule definitions, and environment-specific values make that difference visible.
Write the Rollback Contract Before Release
A rollback contract states what the team will do when the new behavior is unsafe. It should be written before release, when the team can still think clearly. At minimum, it answers six questions.
Scope. Which version, rules, integrations, queues, and records does the change affect?
Preconditions. What must be true before activation, including dependency health, schema compatibility, permission checks, and current queue depth?
Repeat safety. Which idempotency key or deduplication rule prevents retries from creating the same side effect twice?
Reversal. Can the change be disabled, or must its effects be compensated with a second action such as a refund, correction, or restored assignment? Rollback should never be used as a vague synonym for compensation.
Trigger. Which observable threshold stops the rollout? Examples include error rate, duplicate rate, unresolved exceptions, processing latency, or reconciliation mismatch.
Ownership. Who can pause the workflow, who validates recovery, and who communicates the operational impact? A kill switch without an authorized operator is not a control.
These answers can fit on one page. Their value comes from being testable. The team should rehearse the stop path with production-like data and confirm that the old version can still read any state written by the new one.
Roll Out Behavior Progressively
A workflow does not need to move from zero to all traffic at once. Start with a dry run that calculates decisions without executing side effects. Compare proposed outcomes with the current process, then release to a narrow segment: one region, one queue, one account class, or a controlled percentage of eligible events.
Each stage needs a defined observation window and stop/go thresholds. Watch both technical signals and operational ones. A workflow can return successful API responses while creating more manual rework, longer exception queues, or confusing handoffs. Those are release failures even when infrastructure dashboards remain green.
Keep the previous version available during the observation window. If rules and configuration live only inside a mutable interface, export a signed snapshot before activation. Recovery should not depend on remembering what a screen looked like yesterday.
Reconcile After Every Change
Deployment is not complete when the workflow starts running. Reconciliation compares intended effects with recorded effects across system boundaries. Counts alone are insufficient; teams should sample identities, amounts, statuses, timestamps, and ownership fields to detect partial writes or silent mapping errors.
Measure time to detect, time to pause, time to restore safe processing, duplicate-side-effect rate, compensation volume, and exception age. These metrics reveal whether the rollback contract works under pressure. If restoration depends on manual database edits or one unavailable specialist, the release process is still fragile.
Treating workflow changes like deployments adds a small amount of structure before release and removes far more uncertainty during failure. Automation becomes easier to operate because every change arrives with boundaries, evidence, a stop condition, and a tested path back to safe work.
Microsoft has shipped Visual Studio Code 1.133, and the headline change is architectural rather than cosmetic: AI agent sessions now run in a dedicated background process rather than within the editor’s extension host.
The release, which rolled out August 12, moves agent execution into what Microsoft calls the Agent Host, a standalone process built on a new open specification: the Agent Host Protocol (AHP). Microsoft published the AHP spec on GitHub under an MIT license, positioning it alongside the Language Server Protocol (LSP) and Debug Adapter Protocol (DAP) as infrastructure other tools can build on, not just a VS Code implementation detail.
The practical effect for developers is that an agent session no longer has to live and die with a single editor window. Because the host runs independently, multiple VS Code windows can connect to the same session and see a synchronized view. The protocol uses JSON-RPC, immutable state, and pure reducers to keep clients in sync, with each state change carrying a sequence number so nothing arrives out of order. Sessions can also run remotely, reached over SSH or a dev tunnel, which matters for teams running agents against machines that aren’t sitting on a developer’s desk.
“Moving agent sessions into a standalone host lets a developer reconnect to a running session from another window or over SSH. The agent no longer dies when one editor closes. It starts behaving like shared infrastructure,” said Mitch Ashley, VP and practice lead, Software Lifecycle Engineering and AI-Native Software Engineering, for The Futurum Group.
Microsoft built first-party adapters for Copilot, Claude, and Codex that translate each agent’s native runtime into the common AHP session model. For DevOps teams standardizing on Copilot, one of the more useful changes is in Claude sessions: you can now mix Anthropic and Copilot models in the same session. The model picker groups both under separate headings, and you choose per turn — models under Anthropic bill against your API key, models under Copilot draw on your Copilot subscription. Previously, switching providers meant reconfiguring the agent host entirely.
VS Code also added an experimental setting, chat.agentHost.allowSignedOutWhenUsable, that lets the Agents window open without a mandatory GitHub sign-in prompt. That prompt used to block anyone whose machine couldn’t reach github.com, or who simply didn’t want to authenticate against GitHub to use an agent they’d already configured through an API key. With the setting enabled, GitHub authentication attaches to individual agents or models rather than gating the entire window. For now, that only works with Claude; Microsoft says support for Copilot with custom model keys and for Codex is coming in a future release.
Developers who want to run the host themselves, rather than relying on VS Code to spin one up automatically, can type “code agent host” in a terminal to start a server on localhost, which is protected by a connection token by default. Adding the –tunnel flag exposes it through a dev tunnel for remote access. If none of this appeals to you yet, nothing forces your hand: sessions created before the Agent Host was enabled continue to run under the old extension-host model, and flipping chat.agentHost.enabled to false reverts to that behavior entirely.
The rest of the update is smaller but still worth knowing about. Sticky scroll now applies to chat prompts, not just code: as you scroll back through a long conversation, the prompt you’ve scrolled past stays pinned at the top so you don’t lose track of which response belongs to which question. You can click it to jump back, or step through prompts with the previous and next buttons beside it. And the integrated browser now auto-refreshes local HTML files when they change on disk, a small fix that removes a manual refresh step developers have been hitting for a while, whether the change came from an agent’s edit or their own save.
Ashley sees the open spec as much a land grab as an engineering decision. “Publishing the protocol as an open spec, alongside LSP and DAP, is Microsoft staking the agent execution surface before rivals do,” he said. “Open beats proprietary only if the adapters for Claude and Codex stay first-class. Buyers should test that promise before committing a stack.”
None of this is a dramatic user-facing overhaul on its own. But the architecture shift underneath it is the more interesting story for anyone tracking where AI-assisted development is headed. By separating the agent host from the editor and publishing the protocol openly, Microsoft is inviting other tools and IDEs to plug into the same session model, rather than keeping agent orchestration locked inside VS Code. That’s a bet that agent sessions are becoming infrastructure in their own right, something teams run, monitor, and reconnect to, rather than a chat window that disappears the moment you close a tab.
For teams already leaning on Copilot or Claude in VS Code, the near-term upside is simpler: fewer forced logins, an easier way to compare models without breaking your workflow, and a chat interface that’s a little less likely to lose your place. The update is rolling out gradually through VS Code’s built-in updater, or developers can trigger it immediately with Check for Updates in the toolbar menu.
Arm has made available a Dynamic Insights tool that leverages artificial intelligence (AI) models to generate recommendations for optimizing software running on its processors using actual data collected at runtime.
Alex Spinelli, senior vice president for AI and developer platforms at Arm, said the Dynamic Insights tool provides both human developers and AI agents with verified evidence that enables them to optimize application performance using insights surfaced by AI models that have been trained by software engineering experts from Arm. That approach ensures AI guidance is based on how the workload and hardware behave together, rather than relying on source code assumptions alone, he added.
Available as a module with a suite of open source Arm Performix tools, the overall goal is to reduce the level of expertise that previously was required to optimize code at a time when IT infrastructure resources are becoming more expensive, said Spinelli.
In general, the number of workloads that now run on Arm-based platforms continues to exponentially increase. Historically, optimizing the performance of any application required a deep understanding of the underlying processor architecture. However, as large language models (LLMs) understand code better, it’s now possible to surface optimization insights in a way that is much more accessible to the average developer, noted Spinelli.
That’s critical because, as the volume of code being generated in the age of AI continues to increase, it’s no longer feasible for software engineers to manually optimize every line of code. The issue, of course, is that in the absence of that optimization, the cost of running applications that consume infrastructure resources inefficiently only continues to rise.
The Dynamic Insights tool identifies, for example, which functions consume the most execution time, whether workloads are constrained by the CPU, memory, or I/O, how effectively AI accelerators are being used, and whether an issue originates elsewhere in the system.
Mitch Ashley, vice president and practice lead for software lifecycle engineering at the Futurum Group, said tuning code for Arm chips has been specialist work, done by a few engineers who could read what the processor was doing at runtime. Dynamic Insights puts that evidence in front of everyday developers so experts are no longer a bottleneck, he added.
The evidence matters more than the recommendation. A suggestion a developer can’t verify is just faster guessing that regresses under real load. Teams still own proving the change holds before it ships, noted Ashley.
At a time when compute capacity is becoming more limited, the need to optimize code in a way that improves efficiency is becoming more critical with each passing day. There will always be a need for software engineers to achieve that goal, but as AI continues to evolve, the number of instances where applications are inefficiently consuming limited IT infrastructure resources should be sharply reduced. The challenge, as always, is getting the right tools into the hands of application developers to ensure the best possible outcome in the first place.
ProjectDiscovery has made available an autonomous security testing platform that leverages an open source artificial intelligence (AI) testing framework to detect and validate vulnerabilities at a lower total cost.
Company CEO Rishi Sharma said version 1.0 of the Neo platform is also available via a cloud service that makes it possible for DevSecOps teams to run tests and conduct investigations using a consumption-based pricing model.
Additionally, Neo 1.0 adds integrations with DevOps tools and platforms such as GitHub, Jira, Confluence, Slack, Linear, application programming interfaces (APIs), webhooks, and the Model Context Protocol (MCP).
Based on an open source project, ProjectDiscovery, in addition to using Neo to detect, validate and route vulnerabilities to the responsible developer, also provides access to Nuclei, an open-source vulnerability scanner driven by customizable YAML templates to detect misconfigurations and exploits. Also included are tools such as Subfinder for discovering subdomains, an httpx tool to probe HTTP, a web crawling tool dubbed Katana, and a port scanning tool known as Naabu.
Collectively these components provide the foundation for an open source ProjectDiscovery ecosystem that already includes more than 100,000 practitioners, making it less costly to discover and remediate vulnerabilities using an autonomous security testing and penetration platform that continuously generates alerts in real time or can be used to run tests at scheduled intervals, said Sharma. Relying on code scanning tools is no longer enough, he added. Instead, there needs to be an entire tool chain in place that not only identifies vulnerabilities but also makes it simpler to identify which vulnerabilities can be reached and actually abused, noted Sharma. Otherwise, DevSecOps teams will soon find themselves overwhelmed by the number of false positives that are generated by AI models, he added.
As artificial intelligence (AI) models advance to the point where discovering vulnerabilities and creating exploits becomes trivial, DevSecOps teams now more than ever need to be able to discover those vulnerabilities before software is deployed in a production environment. The challenge is that, historically, the cost of applying AI to test code has been too high for many organizations to adopt, said Sharma.
In fact, organizations need to realize that application security in the AI era is not just a technical issue but more importantly requires new processes to be defined and embraced that go beyond simply asking an AI model to identify vulnerabilities in source code, he added.
Mitch Ashley, vice president and practice lead for software lifecycle engineering at the Futurum Group, said the truth is there has never been a shortage of vulnerability findings. DevSecOps teams drown in them and burn triage time sorting real threats from noise. Neo validates what it finds, then routes the exploitable issues to the developer who owns the code. The scan-and-fix cycle was built for human code at human speed. AI writes and exploits faster than weekly scans keep up, so testing now has to run where code gets created, he added.
It’s not clear how long it will be before there is a full-blown vulnerability crisis, but it’s apparent DevSecOps teams are running out of time. Technical debt that has been kicked down the proverbial road for years now needs to be rapidly reduced because many more cybercriminals will have access to more advanced models in a matter of weeks. Each DevOps team will then need to determine at what rate to remediate vulnerabilities in existing applications versus opting to replace legacy applications with ones that are, hopefully, more secure.
In the meantime, however, DevSecOps teams, while continuing to hope for the best, would be well-advised to start preparing for the worst-case scenario as soon as possible.
A newly open-sourced Python charting library, called XY, from Reflexoffers an advantage few other charting tools provide: massive scalability.
The library rethinks how to render a set of points on the computer screen, and opens new possibilities for using charts in daily workflows.
Most Python charting libraries today, such as Plotly, Bokeh, or Matplotlib, take a similar approach to creating charts: they serialize every data point and send it to the browser, where it is usually parsed by JavaScript. GPU acceleration can help, though portraying thousands to millions of rows can hog memory, slow interactions and frequently lead to crashes.
The XY library shifts all this heavy data processing to speedy Rust-built libraries, where the rendering job can be matched to the pixel/density surface of the screen. The core then only sends to the screen what the screen can physically display.
The library keeps the chart values in a ColumnStore format. The Rust-compiled libraries compute the level of detail, and transfers the results out as typed binary buffers.
A New Kind of Charting
This approach brings untold benefits, not the least of which is the memory saved by not sending data the browser can’t use.
The time it takes to render a chart stays about the same—around 80 milliseconds—regardless of whether you are plotting 10,000 or 10 million points.
While reducing the number of points, the software preserves the peaks, troughs and overall shape of the data. Even outliers and tail behavior is captured.
Another benefit is that the rendered charts are dynamic. Should the user want to zoom into a region of a chart, XY will recalculate the new area of interest. The user can drill all the way down to individual data points.
Reflex built XY to be a drop-in replacement for Matplotlib workflows. Existing charts in the pyplot format can be rerendered with XY.
The developers admit that XY doesn’t cover some charts rendered by other libraries. This initial release of XY only handles two-dimensional charts. It doesn’t draw polar or 3D charts. Overall, Plotly, Bokeh, and Matplotlib cover more chart types.
A New Horizon for Charts
The ability to quickly render large charts opens a new range of uses previously considered impracticable.
Entire datasets can be rendered without additional sampling. Dashboards can now show live data. The chart.append() method updates an existing chart, meaning dashboards can connect to a live data source without requiring a rebuild.
The library also sets the stage for sharing charts as stand-alone interactive files. A 10-million-point interactive scatter chart exports to 258 KiB of HTML, which is small enough to send as an e-mail attachment. The Plotly equivalent would be 259 MiB, Reflex calculated.
Time series data – Telemetry, market tick data, and log-derived metrics – can also be plotted. The library “renders the full series in one pass with every spike and drop intact, and zoom resolves them without a second query,” the documentation notes.
Installing XY into your Python environment is simple: either `pip install XY` or `uv add XY`, depending on which packager you are using. Import the library in your code and then the numbers can be added through a Python container. NumPy may or may not be used for this task.
Of course, XY can be integrated into Reflex, the company’s open source Python-based Web framework. Any XY chart can be turned into a Reflex component. No JavaScript, iframe, or separate chart service is required.
During a recent UiPath Test Cloud showcase with Tech Field Day, I had a chance to look past the usual “AI can automate testing” message and think about how agents might fit into a real enterprise delivery process. As a Cloud Solutions Architect with a DevOps mindset, I tend to look beyond whether a platform can automate a task and ask what happens once that automation becomes part of an actual operating environment. AI-assisted development is helping teams create and change software faster, but every one of those changes still has to be tested before it can be released with confidence. UiPath described that growing imbalance as a release gap between development and QA. What interested me most was not the idea of putting an agent everywhere, but how agentic reasoning, deterministic automation, and human judgment might work together.
The Release Gap Is More Than a Testing Problem
Software development teams have spent years improving how quickly they build, integrate, and deploy applications. AI is pushing that work even faster, while many testing processes have not evolved at the same pace. During the showcase, UiPath described how development teams are producing changes daily or weekly while QA teams are still dealing with a large amount of manual testing and disconnected automation. The faster development moves, the harder it becomes for testing teams to keep up and confidently say a change is ready to release.
What kept standing out to me was that this is not only a test-execution problem. A lot of the delay lives around the test: reviewing requirements, figuring out what needs to be validated, preparing data, maintaining scripts, investigating failures, creating reports, and waiting for approvals. A team can have an automated regression suite and still rely on a mostly manual process to move from a new requirement to a release decision. At that point, the automated test becomes one fast step inside a much slower system.
This is where my DevOps brain kicked in. One of the questions I asked during the session was whether UiPath could help distinguish between an application defect, a broken test, and an issue with the environment. I pushed to get clarity on that distinction because each one needs a different owner, a different investigation path, and a different response. UiPath explained that its self-healing capabilities can recognize and repair certain automation failures, such as an interface element moving or changing, a blocking overlay, or a timing issue. Failures that fall outside those supported recovery patterns, including potential application defects or broader environment problems, still require further investigation and human judgment.
I also asked whether the platform could help identify which tests were most relevant to a particular application, workflow, or infrastructure change. That is a practical problem I run into in my own work: teams know they need to test something, but the harder question is often, “What exactly should we test to prove this change is safe?” The response from UiPath was that requirements, user stories, existing tests, and supporting documentation can provide context for identifying and refining candidate tests.
Not Agents Everywhere: Finding the Right Boundary
UiPath Test Cloud brings several parts of the testing lifecycle together. Test Manager manages requirements, test cases, executions, results, and traceability, while also serving as an entry point for AI-assisted testing workflows; Studio creates repeatable robotic test automations; Orchestrator schedules and coordinates execution; and Insights provides reporting and analytics. UiPath also emphasized that it can integrate with existing application lifecycle management and CI/CD platforms rather than asking every engineering team to replace the tools they already use.
The distinction between robots and agents was one of the most useful parts of the showcase. In UiPath terminology, a robot follows explicit instructions and produces a more deterministic result, while an agent reasons through the task and adapts as it goes. The presenter explained that robotic execution does not require LLM inference to carry out each predefined test step. Agentic execution may take longer, cost more to run, and produce slightly different behavior from one attempt to the next.
That difference matters more than it may seem at first. A large regression suite usually needs predictable execution, clear assertions, and repeatable outcomes. A UAT scenario, an exploratory workflow, or a frequently changing interface may benefit from an agent that can interpret intent and work through some ambiguity. The UiPath hybrid approach allows teams to keep the stable parts of a test deterministic while inserting ScreenPlay where reasoning or flexibility is actually useful.
The pattern that made the most sense to me was not agents everywhere. Let the agents help where interpretation, investigation, or adaptation adds value. Let deterministic automation handle the work that needs to be fast and repeatable. Then keep people involved where risk, governance, and accountability matter.
That approach also preserves an important role for experienced QA practitioners. The presenters from UiPath did not describe AI as a replacement for the testing mindset. They talked about helping testers move toward test strategy, automation development, agent design, and workflow orchestration. The mechanics may become easier to automate, but someone still must decide whether the system is testing the right things.
From Better Requirements to a Connected Testing Workflow
The UiPath Test Cloud demonstration started in Test Manager before any test was executed. UiPath first evaluated the quality of a business requirement, suggested missing details, generated possible tests, and looked for existing tests that might be redundant or obsolete. The platform can use the requirement along with screenshots, release notes, documentation, existing test cases, and other supporting material as context.
I liked that the workflow started there because weak requirements do not suddenly become strong tests just because AI generated them. If the source material does not explain validation rules, error behavior, session handling, security expectations, or important boundary conditions, the test suite may only automate an incomplete understanding of the application. In the demo, the AI surfaced those gaps for a person to review before the suggested scenarios became actual test assets. The presenter came back several times to the idea of trusting but verifying the output.
Because I regularly help customers evaluate and implement AI platforms, I asked whether an organization could control which models were available inside Test Cloud. UiPath said organizations can govern which approved models are available for supported AI capabilities and can also configure bring-your-own-model options where available. For a regulated organization, that is not just a preference setting. Model access has to align with approved vendors, data-handling rules, and the organization’s broader AI governance policies.
I also asked what the deployment model might look like for a financial institution or another customer that could not accept a standard SaaS implementation. UiPath has its Public Test Cloud, which UiPath operates, and Private Test Cloud, which customers operate through Automation Suite. Requirements such as data residency, isolated environments, or government deployment need to be mapped to the appropriate edition and current availability. The tradeoff is an important one: a self-managed deployment may help address isolation or residency requirements, but the customer also takes on more responsibility for maintenance and platform updates. UiPath also explained that some AI capabilities use platform-based consumption or feature-specific entitlements, while bring-your-own-model arrangements may shift underlying model charges to the customer’s provider agreement.
The larger Test Cloud architecture story came together in UiPath Maestro. UiPath demonstrated a BPMN-style workflow that coordinated environment creation, test-data generation, several testing frameworks, failed-test investigation, proposed fixes, human approval, cleanup, reporting, and notification. Agent Builder supplied specialized agents, while Maestro connected those agents to deterministic automation and people as part of one end-to-end process.
What stood out to me later in the demo was the orchestration layer. Most enterprises already have test runners, pipelines, automation frameworks, and specialized tools. The challenge is not necessarily adding another one; it is coordinating what already exists and preserving context across the full release workflow. From that perspective, Maestro started to look less like another testing feature and more like a possible release-confidence control plane.
The demo was interesting, but the day-two questions were what stayed with me. Can one run be traced across the agents, robots, external frameworks, and human approvals involved? Can teams see which model, prompt, test data, and automation version influenced a result? What happens when an agent times out, an approval stalls, or environment cleanup fails? A workflow can look autonomous on the happy path, but operational maturity shows up in how clearly the platform handles everything that happens outside of it.
Conclusion
My main takeaway from the UiPath Test Cloud showcase is that agentic software testing does not have to mean turning the entire testing process over to AI. The stronger pattern is to let agents assist with interpretation, investigation, and adaptation, while deterministic automation handles repeatable execution and people remain accountable for the decisions that carry real risk. The RPA foundation of UiPath gives it an interesting starting point for that model, while Test Manager, Studio, Agent Builder, and Maestro extend the conversation from individual test scripts into a connected testing lifecycle.
Technology selection, though, is only one part of adopting this kind of platform. When I asked what the customer partnership looked like, UiPath described an implementation approach involving professional services or certified partners, initial integrations and data connections, representative test-case development, and hands-on enablement for customer teams. Low-code tooling may reduce the barrier to building automation, but it does not remove the need for architecture, governance, operating-model decisions, or organizational learning.
I left the showcase thinking less about whether agents will replace traditional testing and more about how deliberately teams will design the boundary between reasoning, automation, and accountability. For teams working through the growing gap between faster software creation and slower release validation, the UiPath Test Cloud showcase offers a useful look at where agents may help—and where determinism and human expertise still belong. If you want to see the demonstrations and hear the full discussion for yourself, you can watch the UiPath Tech Field Day Showcase on the Tech Field Day website.
At 2 a.m., a payment service starts throwing errors. Within minutes, your observability stack fires off 40 alerts: Elevated latency on three services, a spike in 5xx errors, a memory warning on a downstream cache and a handful of dependency timeouts. Somewhere in that noise is the one signal that actually explains what broke. Finding it manually, alert by alert, is how a 5-minute fix turns into a 45-minute outage.
This is the core problem AIOps was built to solve — not more dashboards, not more alerts but correlation. By automatically grouping related signals across metrics, logs and traces, AI-driven correlation collapses an alert storm into a single, prioritized incident with a probable root cause attached.
In this guide, you’ll learn how incident correlation actually works, how to set it up on top of your existing observability stack and how to measure whether it’s actually reducing your mean time to resolution (MTTR). By the end, you’ll have a practical framework for moving your team from manual alert triage to AI-assisted incident response.
Why MTTR Breaks Down Without Correlation
MTTR is typically broken down into four phases: Detection, triage, diagnosis and remediation. Most teams invest heavily in detection — that’s what observability tooling is good at. The bottleneck almost always sits in triage and diagnosis, for a simple reason: One root cause typically produces many alerts, and someone has to manually figure out which alerts belong together before the diagnosis of the actual problem can even begin.
A few patterns show up repeatedly:
Alert storms mask root cause. A single upstream failure can cascade into dozens of downstream alerts, each looking like an independent incident.
Signals live in silos. Metrics, logs and traces often sit in different tools or dashboards, so the engineer on call has to manually stitch together a timeline.
Tribal knowledge bottlenecks diagnosis. The person who ‘just knows’ that a cache-eviction warning usually precedes a checkout failure isn’t always the person on call.
AI-driven correlation directly targets this middle stretch of the incident life cycle — the time between ‘something is wrong’ and ‘here’s what’s actually wrong’ — which is usually where the most time is lost.
Prerequisites
Before you begin, make sure you have:
An existing observability stack producing metrics, logs and traces (StackGen’s ObserveNow or a Prometheus/Grafana/Loki/Jaeger-style setup)
Alerting already configured on key services, even if it’s currently noisy
Admin access to configure integrations and correlation rules
At least one recent incident with alert history you can use to validate correlation output
Estimated time: 30–45 minutes for initial setup, plus 1–2 weeks of tuning based on real incidents.
Step 1: Connect Your Observability Stack
AI-driven correlation is only as good as the data it can see. If your metrics live in one tool, logs in another and traces in a third with no shared identifiers, correlation has nothing to work with.
Start by making sure your telemetry shares common context — service name, environment and ideally a trace ID or request ID that threads through logs and traces.
# Example: Shared labeling convention across metrics, logs and traces
service: checkout-api
environment: production
trace_id: “{{request.trace_id}}”
If you’re using ObserveNow, connecting metrics, logs and traces into a single pane is largely a matter of pointing your existing Prometheus, Loki and Jaeger (or equivalent) instances at it — StackGen integrates with these directly rather than requiring a rip-and-replace.
Expected Result: A unified view where a single service’s metrics, logs and traces are queryable together, ideally with a shared identifier connecting them.
Troubleshooting: If correlation later feels inaccurate, this is almost always the first place to look — inconsistent service-naming or missing trace propagation breaks the AI’s ability to link signals correctly.
Step 2: Configure AI-Driven Correlation Rules
With unified telemetry in place, the next step is telling the correlation engine what ‘related’ should mean for your environment. Most AIOps platforms, including Aiden AI Copilot, combine two approaches:
Topology-Aware Correlation: Using service dependency maps to group alerts from services that call each other
Pattern-Based Correlation: Using historical incident data to learn which alert combinations tend to co-occur
# Example: Correlation policy
correlation_policy:
time_window: 5m
group_by:
– service_dependency
– shared_trace_id
confidence_threshold: 0.75
The time_window matters more than it looks. Set it too short and you’ll miss slower-cascading failures; set it too long and unrelated incidents start getting merged. Five minutes is a reasonable starting point for most microservice architectures — narrow it down if your services are tightly coupled with fast failure propagation, widen it for slower, more decoupled systems.
Expected Result: Incoming alerts are grouped into incidents rather than arriving as isolated tickets.
Troubleshooting: If everything gets grouped into one mega-incident, either your confidence threshold is too low or your time window is too wide. Tighten both and re-test against a known incident.
Step 3: Test Against a Real Incident
Don’t wait for a live outage to find out if your correlation setup works. Pull the alert history from a recent real incident and replay it against your new configuration.
Ask three questions about the output:
Did the correlation engine group the alerts that actually belonged together?
Did it surface a root-cause candidate that matches what you now know actually happened?
Did it leave out anything that should have been included or wrongly include something unrelated?
This is also where Aiden/AIOps automated root cause analysis is worth validating directly. It should be able to point to the earliest anomaly in the correlated group and rank likely causes, not just group alerts together and leave the analysis to you.
Expected Result: The correlated incident matches (or comes close to) the retrospective understanding of the incident, with the root-cause candidate ranked at or near the top.
Step 4: Monitor, Tune and Automate Remediation
Correlation isn’t a one-time setup. It improves while identifying more of your real incident patterns. Over the first few weeks:
Review every correlated incident and confirm or correct the grouping.
Watch for recurring false groupings (two unrelated services that keep getting merged) and adjust topology mappings.
Track false-negative correlations — alerts that should have been grouped but weren’t.
Once correlation accuracy is consistently high, you can layer-in automated remediation for well-understood incident patterns — for example, automatically restarting a service instance when a specific correlated pattern (memory leak signature + latency spike + no recent deploy) is detected with high confidence. This is where Aiden for SRE typically comes in: Using the correlated, root-caused incident as the trigger for a pre-approved remediation action, rather than waiting for a human to read the alert and act.
Expected Result: A shrinking gap between detection and remediation, with routine incident patterns increasingly self-resolving.
Testing Your Setup
Before trusting correlation in production, run it through a structured validation pass:
Replay 3–5 historical incidents of varying severity and complexity.
Compare AI-correlated groupings against what your team determined manually during the actual incident.
Check root-cause ranking accuracy — was the true cause in the top 1–2 candidates?
Confirm the time to first correlated alert is meaningfully faster than your team’s manual triage time.
If correlation accuracy is inconsistent across incident types, it’s usually a sign that your topology mapping is incomplete for certain services, which is why it is worth revisiting Step 1 before adding more correlation rules on top of gaps in the data.
Real-World Results
Teams that move from manual alert triage to AI-driven correlation typically see improvement concentrated in the triage and diagnosis phases specifically, since that’s the part of MTTR correlation is designed to compress:
Alert Volume per Incident: Often reduced from dozens of individual alerts down to a single correlated incident
Time to Root-Cause Identification: Meaningfully faster when root-cause ranking is accurate, since engineers stop manually cross-referencing dashboards
On-Call Burden: Fewer distinct pages per incident, since related alerts are grouped rather than firing independently
Your specific numbers will depend heavily on how mature your topology mapping is and how much historical incident data the correlation engine has to learn from — treat the first few weeks as a tuning period, not the final benchmark.
Next Steps
Now that you have AI-driven correlation running, you can:
AI-assisted development has quietly changed which part of the software lifecycle is hardest. Writing code is no longer the bottleneck. Understanding what the resulting system is actually doing in production is. When agents and assistants can generate whole services in an afternoon, the ability to validate change, investigate incidents and reduce risk becomes the constraint that actually decides how fast a team can ship — and that puts observability engineering squarely at the center of the conversation.
Alan Shimel talks with Liz Fong-Jones, Technical Fellow at Honeycomb, about what that shift looks like from the ground. Fong-Jones draws a sharp line between telemetry and observability that most teams still blur. Telemetry is the raw material: logs, metrics, traces describing what is happening inside a system. Observability is the broader property of being able to combine that data with human knowledge and process to actually understand the system and make better decisions. Her framing is that observability is a living quality of software — like testability or accessibility — and a team is never done with it.
They get into how AI reshapes the observability loop itself. Fong-Jones sees real leverage in agent-assisted workflows that generate instrumentation code, sift through mountains of telemetry and help engineers move through investigations faster. The point is not that AI removes human judgment from the loop. It changes where humans spend their time, pulling them off toil and toward the interpretation and decision-making that only a person can do. The second edition of the O’Reilly book Fong-Jones co-authored reflects that shift — the field has moved past arguing whether observability differs from monitoring and into how it supports AI-driven software delivery.
The bigger arc is that cloud native has become the default substrate for modern software, containers and Kubernetes are now assumed rather than debated, and OpenTelemetry sits underneath the whole picture as the standard everyone builds on. In that world, observability engineering is not a nice-to-have added on top of production. It is the thing that lets teams move faster with AI while keeping the risk of moving faster inside acceptable bounds — and the organizations that treat it as a first-class engineering discipline are the ones that get to keep shipping when everyone else is chasing incidents.
Code creation has never been faster, but the machinery around it has not sped up in step. AI coding tools can now produce more lines in a morning than a team used to ship in a sprint, while testing pipelines, review processes and device coverage still move at the pace they did two years ago. The result is a widening gap between how much software is being written and how much of it anyone can actually verify — and that gap is where production incidents live.
Mike Vizard sits down with Prince Kohli, CEO of Sauce Labs, to work through what that imbalance is doing to release quality. Kohli’s framing is that leaders keep mistaking code velocity for product velocity. Generating an application in an afternoon is not the same thing as shipping one. Reviews still need to happen, tests still need to be authored, device coverage still needs to be real, user journeys still need production-like validation. Skip those layers and the AI advantage evaporates the first time a subtle defect makes it to customers.
Kohli lays out a specific failure pattern engineering leaders should look for: using the same AI model to write the code and verify the code, which he compares to letting a student grade their own homework. Mature teams are moving to independent verification systems that evaluate application intent, author their own tests, run them in the right environments and troubleshoot the failures they surface. Human reviewers also carry a heavier cognitive load in this world, because developers now read a lot more code than they write and often lack the context behind the AI-generated architecture in front of them.
Sauce Labs research puts numbers on the risk. Kohli says 80 percent of organizations have traced a production incident or outage back to AI-generated code, 90 percent reported serious business impact from those incidents, and 66 percent admit they compromised quality or testing standards to hit faster release deadlines. His pitch is not to slow AI down. It is to invest in verification at the same rate as generation, because the teams that treat testing as a second-class citizen in an AI-first pipeline are the ones already writing incident post-mortems they did not need to write.
Conducted by Wakefield Research on behalf of Sauce Labs, a provider of an application testing platform, the survey finds 83% of respondents work for organizations where more than 10% of the code running in production environments has been generated using AI, with 28% now running more than a quarter of the code in their production environments using AI tools.
A full 93% said they also receive reports on that code, but only 38% receive them regularly. A total of 89% also said they disclose to customers when code has been generated using AI, but only 27% said they do so consistently.
A total of 70% said their organizations now spend more than $1 million annually on AI-assisted application development tools and platforms, with 41% spending $5 million or more. A total of 89% described the return on investment (ROI) in AI as either significantly positive (30%) or somewhat positive (59%). More than half (51%) expect fully autonomous testing and software deployment to be possible in either two (27%) or three years (24%), compared to 8% that believe it is achievable now.
More than half (53%) said deploying AI too quickly is the greater risk than falling behind rivals, while conversely, 47% said falling behind is the greater risk. More than 91% also said software quality has either significantly improved (18%) or somewhat improved (73%) thanks to adoption of AI tools.
Overall, only 12% said leadership was greatly concerned about risks that result from deploying AI-generated or AI-tested code in production environments, compared to 58% that are moderately concerned. Only 12% are extremely concerned that safeguards are not effective at preventing AI-generated or AI-tested features that have quality or safety concerns from reaching production, compared to 81% that are very or somewhat concerned.
Additionally, the survey finds a full 84% of respondents lead organizations that have eliminated or significantly reduced roles because of AI adoption, with 53% having cut junior/entry-level developers, while 42% have cut QA testers. Another 34% have reduced the number of technical writers employed, with 24% having cut automation engineers. A total of 42% have also reduced the number of entry-level software engineering positions, compared to 38% that have increased them.
Sauce Labs CEO Prince Kohli said, overall, the survey results suggest that given the number of production incidents traced back to AI code it is apparent that not enough attention is being paid to the need to test code generated using AI tools before it is deployed in production environments. As the volume of code being generated increases, it’s now more a question of how many more incidents will there be before DevOps teams are required to revisit existing workflows, he added. On the plus side, a full 61% said that code is at least sometimes tested using AI tools, but only 6% said they use these tools all the time or often.
Of course, many DevOps teams have not been consistently testing code for years. The survey, for example, finds 53% of respondents admit their organization sometimes (47%) or frequently (6%) has shipped software to production with known or unresolved testing issues in the past year. Two thirds (66%) said their organization has either definitely (21%) or probably (45%) compromised on quality or testing standards to meet release deadlines in the past 12 months. Nearly two thirds (65%) said the approximate financial impact of their most significant software quality incident in the past 12 months exceeded half a million dollars.
Those software defects also resulted in negative media coverage (40%), loss of a major contract/customer (38%), a regulatory inquiry or fine (34%), customer lawsuit/legal action (33%), stock price impact (30%) and an executive departure (27%).
On the plus side, nearly two thirds (64%) report dedicated quality assurance/testing headcount has increased in the past year, with 18% seeing a significant increase.
As always, the proof is in the quality of the proverbial application pudding. While AI has clearly improved productivity, it is also worth remembering that it only takes one or two disgruntled customers to wipe out any of the business benefits that might have been gained.