Tag: devop metrics

  • Accelerate State of DevOps Report: The Move to Multi-Cloud

    Accelerate State of DevOps Report: The Move to Multi-Cloud

    Analysis of the 2021 Accelerate State of DevOps Report (SODR) data shows an increasing number of organizations are choosing multi-cloud and hybrid cloud solutions. In our survey, respondents were asked where their primary service or application was hosted, and the results showed that public cloud use is on the rise.

    Of the 1,200 survey respondents this year, 55% indicated they’re using a public cloud, a 5% increase from 2019. Of those approximately 660 people, 21% indicate they use multiple cloud providers and 34% indicate using a hybrid cloud strategy. For clarification, multi-cloud refers to the use of two or more public cloud providers and hybrid cloud refers to the use of an on-premises data center and/or private cloud in combination with one or more public clouds.

    multi-cloud adoption

    Our data indicated that the No. 1 reason for using multiple providers is to leverage the unique benefits that each provider brings to the market. Every cloud provider provides basic compute and storage services, but building a best-in-class business can be best achieved by taking advantage of best-in-class cloud computing features and not being locked into a specific vendor. In fact, 26% of our respondents indicated this was their primary reason for their multi-cloud or hybrid cloud approach.multi-cloud reasons

    The second most-reported reason, at 22%, was availability. Companies around the world are increasingly identifying as software companies and relying on software to be their primary business driver. Software allows companies to deliver value to their customers, outperform their competition, respond to market events and bring innovation to the market. Availability of this core product is not a “nice to have”, it is essential. The truth is, however, that computers and networks are fragile—they fail. If we accept this fact, we can design and build systems that are prepared for this eventuality. Companies are addressing these risks with strategies that decrease the blast radius of changes and allow systems to continue operating even in the face of failure.

    Speaking of worst-case scenarios, disaster recovery (DR) is the third most-reported reason for adopting multiple cloud providers. In fact, the cloud and the global proliferation of data centers has allowed companies to rethink what disaster recovery actually means. Gone are the days of systems going down and operators scrambling to rebuild systems and restore from tape backups—the cloud is the backup. The adoption of cloud plus fully automated pipelines creates a paradigm shift around DR that allows companies to design their disaster recovery strategy around zero downtime.

    In addition to hybrid and multi-cloud strategies increasing, we also saw a rise in the use of the five essential characteristics of cloud computing. The National Institute of Standards and Technology (NIST) defines the five essential characteristics as:

    These five characteristics must be embraced and used to realize the value of the cloud. A company that adopts cloud but does not employ these characteristics simply shifts their operating environment from one place to another but doesn’t gain anything. In fact, the unfamiliarity of a new environment, new pricing models and lack of optimization from years of running on-premises often leads to disappointment. Successful companies embrace these five characteristics.

    We know from previous reports that these characteristics are essential for delivering software at a high or elite performance level. We see adoption rates between 73% and 78% across the five characteristics with the lowest being on-demand self-service (73%) and the highest being measured service (78%). There is no doubt that this increased adoption is a key driver for the jaw-dropping performance we saw this year from our elite performers.

    Elite performers can now deploy 973x times more frequently, have a 6,570x faster lead time to deploy, have a 3x lower change failure rate and a whopping 6,570x faster time to recover from incidents when failure does happen. Go back and read that again—no, those are not typos nor an error in the data! An elite-performing company can bring a new feature to market 6,570x faster than a low-performing company. This is one of the reasons we see a direct link between software delivery performance and overall business performance.

    We encourage you to read the entire 2021 Accelerate State of DevOps report. There’s lots of great information in the report including the addition of a fifth key metric—that’s right; the ‘Four Keys’ are now the ‘Five Keys.’ “What is the new metric?” you ask? Well, I guess you will have to read the report and find out. 🙂

  • Choosing the Right Metrics for DevOps Adoption

    Choosing the Right Metrics for DevOps Adoption

    DevOps adoption has skyrocketed in recent years. Its impact on traditional development platforms has long been well-documented, but in more recent years it has started to influence low-code platforms, too. In its recent survey on the state of Salesforce DevOps, Gearset found that 69% of teams are already using source control and another 20% plan to start this year. Additionally, 45% of companies have implemented CI/CD, and that number is set to increase by 33% this year. However, for high-performing developer teams to recognize the benefits of DevOps and strive for further DevOps adoption, they must use the right KPIs.

    While it can be tempting to take a ‘big bang’ approach to DevOps adoption, teams see more success when they take it one step at a time, with each stage building on the last.

    That said, to experience the full ROI of DevOps adoption, it’s still critical to see the journey through to the end. It’s not uncommon for teams who begin the process of DevOps adoption to stop halfway through or, worse still, lose motivation and halt the process entirely. DevOps adoption is a process full of technical and cultural change, and one of the most common causes of its failure is an emphasis on the technical at the expense of the cultural.

    The best way to tackle this is to encourage teams to take a product mindset and apply it to DevOps adoption. Simply put, rather than tasking your teams with “adopting CI” for instance, they should be asked to solve a specific business problem. For example, “When we finish work on a story, it takes weeks for it to get released!” It sounds obvious, but focusing teams around business impact rather than on individual tasks makes sure that there’s a direct correlation between the work that’s happening and the desired business outcome. This is the crux of adopting a DevOps mindset, rather than a purely technical and perfunctory approach to DevOps adoption.

    One of the key things a team can do to drive this type of change—and to avoid common causes of failure—is to use the right metrics at each stage of their DevOps journey.

    There are a number of well-recognized metrics for measuring DevOps success, including:

    • Deployment time
    • Change failure rate
    • Release cadence
    • Lead time
    • Recovery time

    These metrics serve two purposes. They’re well-documented and benchmarked indicators of performance that can help teams focus on their biggest problem areas. And they’re measurable outcomes that prove the business benefits of DevOps, such as agility, improved collaboration, higher quality systems and resilience, not to mention significant time and cost savings and efficiency.

    Choosing the Right Metrics

    Teams must choose the right metrics at the right time to identify their opportunities for improvement and to measure the impact of each stage of DevOps adoption. The right metric empowers a team to solve their most pressing challenges, and to demonstrate the value of their work to their leadership.

    Here’s how the benefits of each stage of DevOps maturity should be measured: 

    Stage of DevOps maturity

    Most relevant metric(s)

    Choosing your release tools

    Deployment time

    Adopting version control

    Change failure rate

    Recovery time

    Automating testing

    Change failure rate

    Automating deployments (CI/CD)

    Release cadence

    Lead time

    Integrating backup into DevOps tools and process

    Recovery time

    Let’s expand on each stage and the appropriate KPI.

    Choosing Your Release Tools

    This is more relevant to low-code platforms, but still broadly applies to the wider tech world. Even in the most mature of development processes, there will be manual steps. Getting changes into version control, reviewing changes, resolving conflicts, triggering releases—each of these is a manual step, and the effort involved in each of these manual steps is heavily dictated by the tools you use.

    Finding the right tool for each stage of your development and release process can therefore have a massive impact. The right deployment tool, for instance, can cut down deployment time by as much as 90%. This step alone increases efficiency and ultimately saves companies vast amounts of time and money. In extreme examples, teams that save so much time by picking up a couple of new tools to patch up their manual processes can be tempted to stop there. This is why teams need to look at other metrics as they proceed to adopt more DevOps processes.

    Adopting Version Control

    For most teams, a world without version control is unthinkable, having built their development and release processes around it a decade or more ago. For others, particularly in the low-code space where it’s yet to reach ubiquity, it can feel like an unnecessary burden. The introduction of version control is an extra step in the releases process and another level of complexity, with new tools and practices to learn. But version control is the foundation of an automated DevOps workflow. This step allows for more team collaboration and visibility into that collaboration, with code reviews and a detailed change history. Version control also allows teams to deal with merge conflicts early, rather than in the middle of a release. 

    After adopting version control, teams will see a reduction in their change failure rate due to code reviews and their recovery times will be shorter as version control offers rollback and a quasi-backup of the code and config captured by their version control system. But the real benefits of version control are in the DevOps processes it unlocks. 

    Automating Testing  

    It goes without saying that the purpose of testing is to improve the quality of releases. It does this in a few ways:

    • Unit testing – Exercising individual methods and functions in isolation generally results in more maintainable code, which has positive benefits for developer productivity and even things like handling merge conflicts.
    • Static code analysis – While this is not testing in the strictest sense, automatically verifying that code adheres to a set of best practices similarly improves code maintainability.
    • Integration testing – This type of testing ensures that combinations of classes interact and generate the expected results when combined together. This brings another level of validation that changes being made are likely correct.
    • End-to-end testing – UI testing is an example of this; exercising the system in the way a consumer would and verifying that the results are deterministic and correct. This also includes regression testing for key workflows and sometimes even acceptance testing.

    The more of these testing approaches a team uses, the more confidence they’ll have in their changes and the less human verification and intervention will be required. As teams’ DevOps processes mature, it’s often the human element that becomes the biggest bottleneck, so confidence in deploying changes is very valuable.

    When teams introduce more testing and test automation to their release pipeline, the right metric to watch is change failure rate—the proportion of releases that include a bug or error. The immediate benefit of higher-quality code translates to savings in the long term as less time is spent finding and fixing bugs or reworking code.

    Automating Deployments (CI/CD)

    If choosing the right deployment tool significantly reduces deployment times, automating deployments with a CI/CD workflow eliminates the time it would usually take to run those deployments manually. However, deployment times aren’t the key metric for measuring the success of CI/CD implementation. The most important metrics to pay attention to here are release cadence and lead times, which are dramatically improved thanks to painless, automated deployments. 

    With automated deployments, teams can increase their release cadence; rather than releasing huge batches of changes once a month, they might begin to release smaller packages every week. Ultimately, the goal is to have a steady stream of incremental improvements being released on-demand, and usually multiple times per day. Accelerated release cadences then result in reduced lead times—the period between work being finished and finally released to production. This is beneficial for developers and their end users as more frequent releases create more opportunities to act on user feedback earlier in the process. 

    Integrating Backup Into DevOps Tools and Process

    Recovery times are a key metric for DevOps success, as robust DevOps processes will improve the speed at which teams can restore after an incident. For even better resilience and faster recovery times, teams should integrate backup into their DevOps tools and processes.

    Restoring from a backup is comparable to a deployment, and this means that restore processes also can harness the power of DevOps so they feel like a familiar process—not something unusual that teams struggle to execute at the point when it matters most. It’s also important to make it as easy as possible to back up on demand just before a risky release.

    Downtime and data loss are massive costs to any business, so improving recovery times is a huge benefit of a fully mature DevOps process.

    See the Benefits of Maturing your DevOps Process

    When teams pay attention to the right metrics, they understand the benefit of each DevOps process individually and they are motivated to keep maturing their DevOps processes as a whole. It’s all well and good to take the pain out of deployments and releases, but high-performing DevOps teams effectively make deployments an asset for releasing more often and getting feedback earlier. As a result, they are better equipped to deliver more value to their companies—sooner.

  • Why You Should Embrace Incidents and Ditch MTTR

    Why You Should Embrace Incidents and Ditch MTTR

    The cliché is that everyone in IT hates incidents, and the natural reaction when assembling incident response metrics is to look for numbers that you can lower over time. Fewer incidents and shorter incident response times must be better, we think. You might already be familiar with the common metrics associated with these goals, including mean time-to-resolution (MTTR) and total incident count.

    As it turns out, however, these metrics actually work against your company’s resilience goals. To understand why, let’s look at the industry that birthed most of our modern incident management practices and has learned the most about how to properly apply them: the airline industry.

    What the Airlines Can Teach Us

    From the 1950s to the 1990s, the airline industry built and refined best practices for incident management that we have since simplified and that have been widely adopted across the tech industry. What’s often termed “modern incident management” simply means the predictable and repeatable approach to handling unexpected disasters and the learnings-driven remediation steps that are prized when building a DevOps or SRE practice.

    One of the most important findings to come out of this research is the somewhat surprising fact that incidents weren’t being declared often enough. Instead, incident reports were created and the carefully assembled response and cataloging process was only followed after catastrophic events, which meant earlier opportunities to catch the underlying problem during a less severe incident were being missed.

    So why did an industry with such incredibly high stakes take so long to realize that more incidents were actually a good thing? You guessed it: a misguided desire to decrease the incident count. In chasing this goal of “lowering the number,” pilots and mechanics were often reluctant to file incident reports for anything less than the most critical situations, which meant the powerful, learnings-focused response and remediation process was only triggered in response to relatively rare and critical situations.

    This is a textbook example of Goodhart’s Law in action. To paraphrase, Charles Goodhart posited that any metric created will ultimately become the goal. In other words, if the incentives are aligned to reduce incidents, no matter how good your response and learning process is, it will only be executed in the most dire and unavoidable circumstances. After discovering this, the industry rapidly moved their focus towards expanding the use of the incident process by working to expand the spectrum of situations that could be classified as incidents with the goal of triggering the formal incident response process more often, distributing learnings for more incidents of lower relative severity and, yes, ultimately resetting the goal to increase the number of incidents.

    This approach effectively turned Goodhart’s Law to the airlines’ advantage—any effort to game the metric(s) meant more learning, not less. Filing incidents became directly and heavily incentivized and these metrics were never used as a justification for punitive action. This resulted in the safest decade of commercial aviation on record, with over 12 billion passengers traveling and no fatal accidents.

    What IT Can Learn About Successful Incident Response

    As technology companies, there is much for us to learn from this exercise in achieving resilience versus chasing “lower numbers.” The primary learning is this: increasing your incident count by incentivizing the use of your incident management process for more non-critical incidents—likely your SEV2s and below—and focusing your metrics and incentives on that goal, is likely the best way to reduce your overall count of catastrophic failures.

    For most companies, this means putting MTTR on the back burner and instead focusing on making the incident process itself more accessible throughout your company and across your organizations. It means leaders should talk about impactful and recent postmortems publicly and that postmortem distribution should be a priority; it should also be something that’s measured. Most importantly, it means opening up the incident management process more widely. Ideally, everyone at your company should have access to systems that allow them to file incidents, read incidents in progress and review postmortems from previous incidents.

    I like to reference the “big red button” philosophy of factory floors, where the decision-making power to declare an incident is in the hands of every employee. An unsafe situation shouldn’t be up for discussion, debate or approval before being acted on, even if the situation is later determined to be less severe than originally thought. The context of why that incident was filed—why that big red button was pressed—may prevent larger, more catastrophic failures in the future.

    So if you’re just getting started building out an incident management practice at your company, or you’ve been chasing MTTR metrics and focusing on pushing your incident count down as a primary goal, consider taking these learnings to heart and creating a positive incident culture with positive metrics meant to encourage and reward incident responders and reporters. Your company’s future depends on it.

  • Changing the Culture of Metrics Analysis

    Changing the Culture of Metrics Analysis

    You could say the development and operations teams gave birth to the idea of DevOps, as it is believed the chief benefits are garnered in those two functional disciplines. Because of this, metrics nearly always are conducted from the points of view of cost reduction, speed and efficiency. This makes perfect sense when business treats IT (and IT sees itself) as a service- or cost-based organization. But what if DevOps has a few more characteristics that could actually change that culture? What if, for the first time, DevOps could enable IT to become a real partner with the business organization it serves?

    To make this happen, business and IT must begin to share attainable goals. Imagine the impact of a highly functioning, enterprise-class DevOps service within IT; upon the time to market of products and services the business is looking to launch. A proven, consistent ability of IT to deliver on time or ahead of schedule (i.e., reliability) then begins to change the dynamics of what marketing proposes and delivers. Time then becomes a valid metric to consider when looking at customer adoption rates. DevOps usually does not directly impact initial market demand, but the impact of delivering new services or features months or years ahead of previous projections can dramatically impact time to market. For example, if your business is able to change its billing model or billing methods six months to a year ahead of every one of your competitors, what impact might that have on market adoption? At that point DevOps becomes a key business differentiator, until the rest of the universe has it.

    Consider an additional impact of a highly functioning DevOps service on feature delivery or the feature road maps themselves. The implementation of DevOps inherently delivers smaller units of change on a higher frequency, reducing risk and allowing iteration and alteration of future plans based on the real-time feedback of change success. Marketing focus groups may provide an original road map, but the impact of DevOps can be integrated back into those same focus groups. Instead of imagining what might be possible, DevOps allows delivery of what is possible to see, feel, touch and prompt further imagination. The net impact is an increase to the pace and depth of innovation itself. You know what your customers really want, and you can give it to them quicker. What kind of impact does that have on the reputation of your business if it becomes a market leader because of this? Or what happens when a large organization is then able to deliver with the speed, agility and flexibility of a small firm?

    Cost Reduction vs. Revenue Generation

    Now consider the value of cost-reduction metrics compared with revenue-generation metrics. It is easy enough to determine that the pre-DevOps delivery cycle might have been 12 weeks per feature as an example, or that each build took six hours to complete and now post-DevOps takes only 12 minutes to run. Metrics like these will begin to show an increase in productivity by existing development staff—or, maintaining the same feature delivery rate, a reduction in the number of personnel needed to achieve them. Similarly, it is easy to show a reduced number of trouble tickets post-DevOps, and a concurrent reduction in the average time to resolve each ticket. DevOps then has enabled the CIO to continue to take arbitrary budget cuts demanded by the business each year. This is not partnership—over time this is a recipe for the reduction, pace and quality of innovation (the smartest people leave first during layoffs; they don’t need to stay).

    However, even significant cost-reduction metrics pale in comparison to revenue-generation metrics. As an alternative, imagine what the net growth in customers of a given product might be, over a six-month period of time, because a desired feature set was delivered early? And what if it is two to three years before your competitors can implement the same high-functioning DevOps services you already have in place today? If a business makes $2 per-widget profit and captures 20 percent additional market share over six months, equating to “x” million new customers … well, you begin to get the idea. All of the sudden IT is no longer viewed as a cost center by business; it is viewed as a revenue-enabler. The immediate business response is, “If I allocated more budget into the types of staff facilitating DevOps services (running the gamut from coding to operations to marketing), could I gain even faster delivery rates or deeper feature sets or more market share by pioneering what has never been pioneered?”

    The two main reasons this realization hardly ever occurs in business today are that 1.) IT has failed at delivering on promises so often it has trained the business to believe it “cannot” deliver on time or on budget; and 2.) few businesses conduct accurate time-to-market metrics measuring the delta of what additional “time” does to the equation, largely because they never had to. DevOps provides the catalyst to begin to re-examine both of these phenomenon.

    But it goes deeper than that. Changing the culture of innovation, in which I am eager to test new ideas faster, means I need more ideas all the time. The competitive advantage our nation, our businesses and our careers have always benefited from is our ability to create and innovate. Other nations around the world, or other organizations your company competes with, may be able to do repetitive tasks faster or more efficiently. But rarely do worker-drones create or produce a wealth of ideas. But if we begin to focus on the long-term impact of fostering innovation in our own country, and in our companies, we will remain perpetually out front. The goal of DevOps is not merely efficiency, it is also to spark the imagination. When our focus and our metrics reflect this, we all win.

    If you would like to continue a conversation on how to create and implement a highly functioning enterprise class DevOps service, feel free to contact me.

  • Free Your Metrics

    Free Your Metrics

    If you’re not collecting metrics, how do you know how your organization is doing? Metrics provide the data to get to the root cause of an outage or uncover a bug that would otherwise go undetected. Metrics can also surface trends that are difficult to discern without visualization. Here are some ideas for making the most of the data around you.

    What to measure

    What are the right metrics? As Etsy put it “If it moves, graph it. If it doesn’t, graph it anyway in case it moves later.” Sure, you should collect system metrics like CPU, memory, and disk utilization but those alone won’t tell you how your product is really doing.

    Sell widgets? Measure the rate of widget sales, the time it takes to sell a widget, and the availability of the widget selling system. Serve cat pics? Measure the time to process the images and the size of the processing queue. At the end of the day, these are the types of metrics that indicate how the product is performing.

    Your applications should be instrumented to emit counts and timing for key code paths. This is especially important in service-oriented architectures where a slowdown in one service can impact other services. So, record how long it takes for services to interact with other services so you can pinpoint the source of the latency. If you use a database, there’s a wealth of metrics exposed by the database system that can help determine why a query is slow.

    You should record every code deploy so you can correlate issues with deploys. If memory usage spikes and throughput drops after a deploy – you know it’s probably a new problem introduced by that deploy. Furthermore, you should collect and examine metrics from your pre-production environments so that problems are caught before they go to production and impact users.

    High value metrics

    Non-application metrics are often overlooked but they can provide important insights into the health of the business. Have a support system or call center? Measure the number of new support cases opened. Use social media? Measure mentions and followers. There’s also a wealth of data generated from sales and marketing activities. Imagine being able to correlate an uptick in sales with increased system reliability or the opposite, where outages and bugs are actually causing customer churn. You can’t make these inferences if you don’t have the data.

    Free your metrics

    Collecting metrics is great, but the real value comes from sharing the data across the organization. When you share your metrics, you increase visibility and transparency into the entire stack, which in turn allows you make informed data-driven decisions. So break down the silos and open up your metrics. Put them up on big screens that everyone can see. Put them up in unusual places like the break room. Then watch how people, who wouldn’t normally care about operations, suddenly start paying attention.

    Stay alert!

    You should also alert from your metrics. Response times jump beyond an SLA? Alert on it. Is a queue for a critical part of your workflow high? Alert on it. By reducing the time until detection you can get to fixing the problem faster. After every production outage ask yourself, ‘do I have the correct monitoring in place to detect this problem if it happens again?’ If you don’t, make it a priority to get it in place.

    You’ve got the tools, now go and free those metrics!


    About the Author/Eric Heydrick

    Eric HeydrickEric Heydrick is a DevOps Engineer at Praesidio, a big data Cybersecurity Management (CsM) company that bridges the gap between IT Security and Policy Governance in protecting Financial Institutions from cyberattacks. Praesidio’s integrated policies and best practices help Financial Institutions know definitively that they are safe. Eric has 15+ years of experience wrangling computers and building scalable infrastructures. Eric lives in Seattle, WA where he enjoys only the best microbrews. Email: eric@praesidio.com | Twitter: @eheydrick

  • How Deploy Frequency Impacts Infrastructure Stability

    How Deploy Frequency Impacts Infrastructure Stability

    I recently took some time out from reading the Internet to read a very specific piece of research I found on the Internet from IDC – its “DevOps and the Cost of Downtime” to be exact. Sponsored by AppDynamics, this fascinating read included a variety of statistics that are helpful in understanding the impact of (or a lack of) DevOps on organizations given certain financial and competitive impacts.

    I won’t bore you by repeating what you can so easily read yourself, but I have pulled out a few key stats that are worthy of further investigation – that of the failure of  stability on the business and the predicted increase in deployment frequency.

    • The average hourly cost of an infrastructure failure is $100,000.
    • The average hourly cost of a critical application failure is $500,000 – $1M.
    • The average number of deployments per month is expected to double in 2 years.

    Interestingly, that prediction on deployment frequency is a good thing and carries with it the possibility of making sure the costs associated with the other two rarely (if ever) happen.

    We’ve already gotten to a point where “speed” with respect to DevOps is effectively equivalent to “time to market”. But there’s another measure of “speed” that’s just as critical, particularly when we apply it to maintaining stability in the infrastructure. That measure is MTTR (Mean Time to Resolution).  This measure is very important when you consider that 60% of production failures are caused by human error or lack of automation according to research from ZeroTurnaround. A goal of DevOps, then, should be to reduce that number as much as possible and introduce more stability into the environment. Frequency of deployment can actually be of assistance in realizing that goal.

    So how does frequency of deployments help do that?

    possible points of failureFirst let us consider the number of possible points of failure that might cause downtime – both in the application and core network infrastructure. Then let us consider that each of those possible points of failure also have multiple potential causes of failure. A single service in the logical critical data path within the core service infrastructure, for example, can easily cause “downtime” that, in the case of IDC, would be characterized as “infrastructure failure” and run a tab of $100K per hour.

    If that application is a critical business application, the tab runs much higher per hour.

    Obviously the speed with which we restore stability (service) in such an event is a factor in the overall impact to the business.

    This is where DevOps comes in and where operationalization can play a significant role in mitigating the impact of downtime by aiding in faster time to resolution.

    Consider that one of the most difficult tasks in the network is not provisioning or configuration, but troubleshooting. To be fair, troubleshooting in app dev, too, is one of the more time-consuming and frustrating tasks, consuming 75% of a developer’s time (according to research from InitialState). That’s close to the 65% of network engineers who are dedicated to “break and fix” tasks, who spend their time troubleshooting network issues up and down and all along the network stack. Needless to say, if you just deployed ten or fifteen different configuration changes splayed across the core and per-app service infrastructure and suddenly something is “wrong”, it’s going to take some time to figure out exactly which configuration change caused the problem in the first place.

    The relationship between number of changes and frequency of deployment is no secret; if you’re deploying changes more frequently then it’s likely there are fewer of them. With an average sprint cycle of 3-4 months, the amount of change is logically not going to exceed that of a cycle that takes 12-18 months. The same holds true for the infrastructure; more frequent deployments should mean fewer changes).

    Logic (and math) tells us that the fewer lines of code and configuration that have changed, the less time it should take to identify the culprit should something go wrong, thereby hastening the time to resolution. Assuming that an agile, frequent deploy rate results in fewer changes to the environment it stands to reason that this approach should also reduce both the number of failures and the time to resolve any that do crop up. Frequency is a significant factor  in reducing failures by increasing its overall stability.

    This is backed up anecdotally by Puppet Labs findings in its “State of DevOps” in which organizations adopting a DevOps approach reported 50% fewer failures and a 12x improvement in time to resolution. That’s stability at work and it’s driven in part by the frequency of deployments and its positive impact on MTTR.

    So let’s apply this approach (and logic) to the rest of the services along the critical data path in the data center infrastructure, i.e. apply it to application services like caching, web application security, load balancing, identity management and application access control.  Automation to reduce misconfiguration caused by human error and smaller, more frequent changes that enable a faster time to identity the inevitable issues that will be introduced. No methodology or approach is going to completely eliminate errors, after all. There’s a limit to how perfect we can get and it’s pretty much a Zeno’s Paradox kind of problem. While we keep solving current issues, more config and code is being deployed that is statistically likely to contain yet another error, and so and so forth.

    But the goal is not necessarily to eliminate all errors (though that’d be nice, it’s simply not practical and it’s the primary reason why our goals for uptime are called “5 9s” and not a “1 with two zeros”) it’s to reduce the number of errors and their impact on downtime. And that is something we can achieve without running afoul of Zeno and his paradox.

    Smaller, more frequent deployments can result in a more stable environment in which downtime is reduced to a level consistent with acceptable risk.

    DevOps, whether applied directly to infrastructure or not, will play a role in improving its stability which in turn has a direct and very real impact on the business by eliminating (some) downtime thanks to more frequent deployments.

  • The DevOps Scorecard

    The DevOps Scorecard

    Mid-last year our team switched from doing Agile to doing DevOps. As we forayed into the journey trying to learn about DevOps and practice it at the same time,  a lot of questions arose in the team.  How was this different from agile and most importantly How were we going to be successful?

    That’s when we wrote down what would be the success criteria for our team: “Ship code frequently without causing a customer outage“.

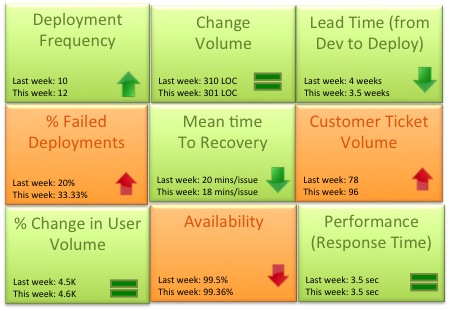
    As the team matured we started evaluating a more granular way to track success.  Could the team mantra be broken down into quantifiable success metrics that could be represented in a scorecard? Based on our experience the DevOps scorecard should contain these 9 metrics to track DevOps team success:

    DevOps Scorecrd

    1. Deployment frequency: How often were we deploying code and getting new code in the hands of our customers? This metric should trend up or remain stable from week to week. Example: Twice a week, 50 times a day
    2. Change volume: For each deployment how many user stories and new lines of code were we shipping?  Example: 3 new features per day, Average 500 lines of new code per week. Another parameter to consider in addition to volume is complexity of change.
    3. Lead Time (from Dev to Deploy): How long does it take on an average to get the code from development complete through a cycle of A/B testing to 100% deploy and upgrade on production? Lead time should reduce as the team gets a better hold of the lifecycle.
    4. Percentage of failed deployments: What percentage of deployments failed causing an outage or a negative user reaction? This metric should decrease over time. Example: 9% deployments failed this month as opposed to 15% last month. This metric should be reviewed in combination with the change volume. If the change volume is low or remained the same but the percent of failed deployments increased, then there maybe a disfunction somewhere.
    5. Mean time to recovery: When we did fail, how long did it take us to recover? This is a true indicator of how good we are getting with handling change and this should ideally reduce over time.  You can expect some spikes in this number due to complex issues not encountered before. Example: On an average it took the team 15 minutes to resolve each last week, 14 minutes this week.
    6. Customer Ticket Volume: Number of alerts generated by customers to indicate issues in the service. This is a basic indicator of customer satisfaction. Example: 54 tickets were generated this week as opposed to 38 while the user volume remained steady is not a good thing
    7. % Change in User Volume: Number of new users signing up, interacting with my service and generating traffic. As new users sign up is my infrastructure able to handle the demand? Example: This week the number of customers spiked by 30% due to an external event causing volume of requests to go up
    8. Availability: What is the overall uptime for my service and did I violate any SLAs? Example: 99.9% uptime consistently for the last 3 months even with change in user volume
    9. Performance (Response Time): Is my service performing within my predetermined thresholds? This metric should remain stable irrespective of % change in user volume or any new deployment. Example: Sub 5 second response time from all geographies and devices

    Would love to hear thoughts on what other critical metrics DevOps teams are using

  • DevOps Dirty Little Secrets

    DevOps Dirty Little Secrets

    By all outward appearances DevOps is gaining real velocity within IT shops worldwide, Duh tell you something you don’t know. I have read much on this topic as I am sure you have, but I never seem to read much with hard data results, other than we are doing great with some very broad  metrics. What are the hard numbers as compared to the legacy IT shop?  So my search begins; where in the world are devops metrics in Fortune 500/Enterprise organizations?

    What got me thinking about this were a couple of recent AppDynamics blogs “Measuring your devops success” and   “Quantifying the value of devops”.  Both blogs do an excellent job at breaking down DevOps to the implementation level. Hard data creates metrics that set a baseline with the legacy system that is the critical measurement component, without a baseline there is nothing to compare or measure against. This approach creates a meaningful way to measure the success of executing a DevOps strategy within an IT shop.  The blogs also point other factors not quite as easy to measure, particularly human elements. Many others have written on measuring DevOps, you need to adopt the approach that makes sense for you and your organization.

    At that point I figured it was time to visit Puppet Labs, when you think DevOps Puppet Labs and their survey’s comes to mind. I utilized the 2013 State of DevOps Report; the 2014 report is not available yet. I believe that in order for any new philosophy to be adopted as a true standardized practice, the C-level in Fortune 500 organizations need to embrace it. In my long experience, typically the first sign of acceptance in traditional Fortune 500 organizations is when the financial vertical embraces it.  As an example, Wall Street traders will pay good money to save two milliseconds on a trade.

    The Puppet Labs report numbers demonstrate real velocity in the adoption of DevOps as an accepted business practice. The first takeaways I had from the report were that organizations ship code 30x times faster with 50% fewer failures. The numbers paint a glowing picture for DevOps. But looking beyond the glowing numbers, I see something else. DevOps is at a critical fork in the road and needs to cross the chasm before it loses its luster and becomes just another application development tool, as opposed to a practice.

    Only 17% of the respondents were Managers or C-level, with only 22% of respondent companies having 10,000 employees or more.  It is essential to look at individual Fortune 500 companies IT shops and measure them with hard data before and after the implementation of DevOps.  I would love to read some in depth case studies of the Fortune 500 with hard numbers and metrics; I did not find anything with the legacy baseline data. A huge benefit of DevOps to the Fortune 500 is it will enable them to fail fast as opposed to continuing an implementation that will inevitably fail anyway and consume a huge amount resource in the process. Anyone who has worked for a Fortune company I am sure has witnessed this.

    In truly understanding what DevOps is and is not, certain questions need real answers; Are Enterprise/Fortune 500 companies really doing the same old thing and just need to write better code utilizing some new application development tools, does that make it DevOps or just continuous improvement? Will some IT execs change the organizations title from sysadmin to Devops Admin to protect their silo and make them seem kinder gentler Ops? Are the DevOps tools available today ready for prime time in the Fortune 500 IT environment? Is Devops about technology and metrics or really about culture? We can speculate, but time will tell us the real answers. I am looking for good metrics on what does DevOps do to a Fortune 500 company Not some so called Unicorn that was born with a DevOps spoon in its mouth, but a good old fashioned Wall Street firm who adopts DevOps. Until then call me the DevOps skeptic.

    If you would like say something; email parker@devops.com and don’t forget to comment here.